• 미리보기
  • 리뷰 (4)
  • 코멘트 (5)
  • 새 소식

Chart Drawing Cloner

5

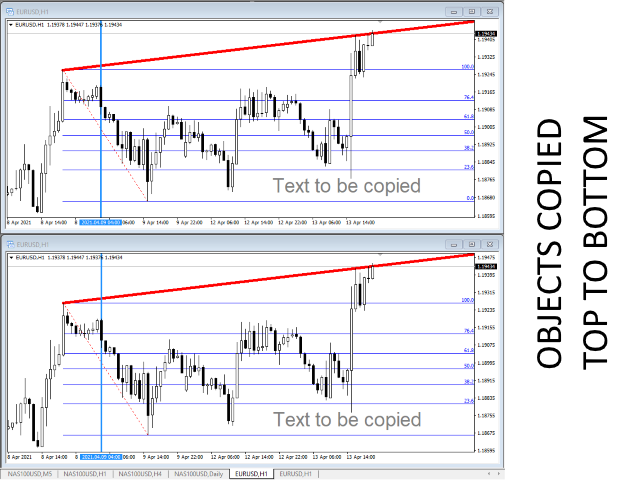
이 스크립트를 사용하면 추세선, 피보나치 되돌림 등과 같은 모든 유형의 그리기 개체를 하나 이상의 다른 차트에 복사할 수 있습니다.


기본적으로 스크립트는 현재 차트, 즉 스크립트가 적용된 차트의 모든 개체를 현재 로드된 동일한 심볼의 다른 차트에 복사합니다.


설정

목적지 시간 프레임

PERIOD_CURRENT 이외의 값으로 설정하면 스크립트가 적용된 차트와 동일한 심볼의 열린 차트에 객체를 복사합니다.

값을 특정 기간(예: PERIOD_D1)으로 설정하면 동일한 기호 AND 기간의 차트만 업데이트됩니다.

CopyObjectsOfType

이것을 복사하려는 특정 유형의 개체로 설정할 수 있습니다. 그러면 해당 유형의 개체만 다른 차트에 복사됩니다.

CopyIndicatorWindowObjects

True로 설정하면 표시기 창의 개체도 복사됩니다. 이는 소스 차트와 동일한 지표를 동일한 순서로 갖는 두 번째 차트에 의존합니다.


마음의 내용에 차트 사이에 개체를 복제하십시오!


리뷰 4
Christian Astillero
1203
Christian Astillero 2022.03.08 14:52 
 

Perfect

CasiousD
794
CasiousD 2021.10.30 19:39 
 

2nd indicator I have from this author. Took some getting used to understanding how it interacts with other indicators already on the chart, but once I figured it out (I can be slow sometimes), works perfectly. As with the other indicator I have from this author (Multi Chart Crosshairs), this is going to make my market analysis so much easier! Thank you again!

Payman
663
Payman 2021.04.16 15:05 
 

its really cool because its the only copier that also copies the objects description i found. i wish i could exclude certain objects like buttons and labels. but anyways its already awesome. thanks

추천 제품
VR Cub
Vladimir Pastushak
VR Cub 은 고품질 진입점을 얻는 지표입니다. 이 지표는 수학적 계산을 용이하게 하고 포지션 진입점 검색을 단순화하기 위해 개발되었습니다. 지표가 작성된 거래 전략은 수년 동안 그 효율성을 입증해 왔습니다. 거래 전략의 단순성은 초보 거래자라도 성공적으로 거래할 수 있다는 큰 장점입니다. VR Cub은 포지션 개시 지점과 이익 실현 및 손절매 목표 수준을 계산하여 효율성과 사용 편의성을 크게 높입니다. 간단한 거래 규칙을 이해하려면 아래 전략을 사용한 거래 스크린샷을 살펴보세요. 설정, 세트 파일, 데모 버전, 지침, 문제 해결 등은 다음에서 얻을 수 있습니다. [블로그] 다음에서 리뷰를 읽거나 작성할 수 있습니다. [링크] 버전 [MetaTrader 5] 진입점 계산 규칙 포지션 개설 진입점을 계산하려면 VR Cub 도구를 마지막 최고점에서 마지막 최저점까지 늘려야 합니다. 첫 번째 지점이 두 번째 지점보다 빠른 경우, 거래자는 막대가 중간선 위에서 마감될 때까지 기다립
숫자 시퀀스 중 하나를 "산불 시퀀스"라고 합니다. 가장 아름다운 새로운 시퀀스 중 하나로 인식되었습니다. 주요 특징은 이 시퀀스가 ​​가장 짧은 경우에도 선형 추세를 피한다는 것입니다. 이 지표의 기초를 형성한 것은 이 속성입니다. 금융 시계열을 분석할 때 이 지표는 가능한 모든 추세 옵션을 거부하려고 합니다. 그리고 그가 실패하는 경우에만 그는 추세의 존재를 인식하고 적절한 신호를 제공합니다. 이 접근 방식을 통해 새로운 트렌드가 시작되는 순간을 정확하게 결정할 수 있습니다. 그러나 거짓 긍정도 가능합니다. 숫자를 줄이기 위해 이 표시기에 추가 필터가 추가되었습니다. 새 막대가 열리면 신호가 생성됩니다. 어떤 경우에도 다시 그리기가 발생하지 않습니다. 표시 매개변수: Applied Price - 적용된 가격 상수. Period Main - 표시기의 기본 기간, 유효한 값은 5 - 60 이내입니다. Period Additional - 추가 기간, 이 매개변수의 유효한 값은 5 -
Trendiness Index
Libertas LLC
5 (3)
"The trend is your friend" is one of the best known sayings in investing, because capturing large trendy price movements can be extremely profitable. However, trading with the trend is often easier said than done, because many indicators are based on price reversals not trends. These aren't very effective at identifying trendy periods, or predicting whether trends will continue. We developed the Trendiness Index to help address this problem by indicating the strength and direction of price trend
Trend Ray
Andriy Sydoruk
The indicator shows the potential trend direction by cyclical-wave dependence. Thus, all the rays of the intersection will be optimal rays, in the direction of which the price is expected to move, taking into account the indicator period. Rays can be used as a direction for potential market movement. But we must not forget that the approach must be comprehensive, the indicator signals require additional information to enter the market.
Bigger chart labels would allow the user to be entirely aware of which chart he/she is on.  Each chart window is unique, containing different patterns and economic motives so acknowledging the chart window would be absolutely essential!  There are well known Economic Time Zones included in clear view, by choice!    Simple does it! Use your computing mouse scroller, clicking with the right finger on the label, in order to customize the label properties. From there, choose your preferred color,
FREE
Awesome Oscillator by Bill Williams with the ability to fine-tune and replace the averaging algorithms of the indicator, which significantly expands the possibilities of using this oscillator in algorithmic trading and brings it closer in its properties to such an indicator as the MACD. To reduce price noise, the final indicator is processed with an additional Smooth averaging. The indicator has the ability to give alerts, send mail messages and push signals when the direction of movement of th
Big Trend Signal   indicator is designed for trend and signal trading. This indicator generates trend signals.  It uses many algorithms and indicators to generate this signal. It tries to generate a signal from the points with the highest trend potential. This indicator is a complete trading product. This indicator does not need any additional indicators.  You can only trade with this indicator. The generated signals are displayed on the graphical screen.  Thanks to the alert features you can ge
Trend Catcher with Alert
Issam Kassas
4.8 (50)
트렌드 캐쳐: 알림 인디케이터와 함께 하는 트렌드 캐쳐 전략은 시장 트렌드와 잠재적인 진입 및 체크 포인트를 식별하는 데 도움이 되는 다목적 기술 분석 도구입니다. 이는 시장 상황에 적응하여 트렌드 방향을 명확하게 시각적으로 표현하는 동적 트렌드 캐쳐 전략을 제공합니다. 트레이더는 선호도와 위험 허용도에 맞게 매개변수를 사용자 정의할 수 있습니다. 이 인디케이터는 트렌드 식별을 지원하고 잠재적인 반전을 신호로 제공하며 트레일링 스탑 메커니즘으로 작동하며 실시간 경고를 제공하여 신속한 시장 대응을 돕습니다. 특징: - 트렌드 식별: 상승 트렌드와 하락 트렌드를 신호합니다. - 트렌드 반전: 양봉 색상이 상승에서 하락으로 변경되거나 그 반대의 경우 잠재적인 반전을 경고합니다. - 실시간 경고: 새로운 트렌드 식별을 위한 경고를 생성합니다. 추천사항: - 통화 및 페어: EURUSD, AUDUSD, XAUUSD 등... - 시간 프레임: H1. - 계정 유형: 모든 E
FREE
Close by percentage MT4
Konstantin Kulikov
4.86 (7)
Hello friends. I wrote this utility specifically for use in my profile with a large number of Expert Advisors and sets ("Joint_profiles_from_grid_sets" https://www.mql5.com/en/blogs/post/747929 ). Now, in order to limit losses on the account, there is no need to change the "Close_positions_at_percentage_of_loss" parameter on each chart. Just open one additional chart, attach this utility and set the desired percentage for closing all trades on the account. The utility has the following function
FREE
Gvs Undefeated Trend   indicator is designed for trend and signal trading. This indicator generates trend signals.  It uses many algorithms and indicators to generate this signal. It tries to generate a signal from the points with the highest trend potential. This indicator is a complete trading product. This indicator does not need any additional indicators.  You can only trade with this indicator. The generated signals are displayed on the graphical screen.  Thanks to the alert features you ca
The professional utilities "Ichimoku Waves Meter" to analyse graphs using the correct interpretation of Ichimoku kinkōhyō! Is a graphic program that allows traders to quickly and easily measure the proportions between the indicated points on the price graph. This time and price indicator is a basic tool for analysing the chart according to the Ichimoku strategy on the MT4 platform. Using this tool allows an insightful and complete analysis of time waves as well as price waves in a very short t
This    Perfective Signal System   indicator is designed for signal trading. This indicator generates trend signals. It uses many algorithms and indicators to generate this signal. It tries to generate a signal from the points with the highest trend potential. This indicator is a complete trading product. This indicator does not need any additional indicators. The indicator certainly does not repaint. The point at which the signal is given does not change.     Features and Suggestions
The Arrow Scalper
Fawwaz Abdulmantaser Salim Albaker
1 (2)
Dear Friend..  I share with you this simple Expert Adviser .. it is full automatic  this Expert Adviser following the trend of the pair you install on or any stocks or indices , it is works like that: - when the trend on H4 chart show a start of up trend the expert will wait till the 15M & 1H charts show an up trend the EA will open a buy order directly , and do the same for down trend and open a sell order the buy or sell  order lot size and take profit and stop loss will measured manually  by
FREE
Quantum Heiken Ashi PRO MT4
Bogdan Ion Puscasu
4.43 (7)
소개       Quantum Heiken Ashi PRO   차트 시장 동향에 대한 명확한 통찰력을 제공하도록 설계된 Heiken Ashi 양초는 노이즈를 필터링하고 잘못된 신호를 제거하는 기능으로 유명합니다. 혼란스러운 가격 변동에 작별을 고하고 더 매끄럽고 신뢰할 수 있는 차트 표현을 만나보세요. Quantum Heiken Ashi PRO를 정말 독특하게 만드는 것은 전통적인 촛대 데이터를 읽기 쉬운 색상 막대로 변환하는 혁신적인 공식입니다. 빨간색과 녹색 막대는 각각 약세와 강세 추세를 우아하게 강조하여 잠재적 진입점과 퇴장점을 매우 정확하게 파악할 수 있습니다. Quantum EA 채널:       여기를 클릭하세요 MT5 버전:       여기를 클릭하세요 이 놀라운 지표는 다음과 같은 몇 가지 주요 이점을 제공합니다. 선명도 향상: Heiken Ashi 바는 가격 변동을 완화하여 시장 추세를 보다 명확하게 나타내므로 유리한 거래 기회를 쉽게 식별할 수 있
Harvest GOLD
Sayan Vandenhout
Harvest GOLD USES THE TREND WAVE INDICATOR AND IT CAN IDENTIFY THE BEGINNING AND THE END OF A NEW WAVE TREND MOVEMENT. AS AN OSCILLATOR, THE INDICATOR IDENTIFIES THE OVERBOUGHT AND OVERSOLD ZONES. IT WORKS GREAT TO CATCH THE SHORT TERM PRICE REVERSALS AND USES A MARTINGALE STRATEGY TO CLOSE ALL TRADES IN PROFIT. USE DEFAULT SETTINGS ON H1 OR HIGHER TIME FRAME ON ANY PAIR FOR MORE ACCURATE TRADES WHY THIS EA : Smart entries calculated by 3 great strategies The EA can be run on even a $
REX complete 3in1
Christophe Godart
This is the complete REX package. It consists of the lite, pro and ULTRA version.  Perfect for beginners and intermediates. REX complete is 100% non repaint. The strategy is based on a mix of different strategies, statistics, including pivot points, oscillators and patterns.  As the trading idea consists of a variety of some classic indicators like Momentum, Williams Percent Range, CCI, Force Index, WPR, DeMarker, CCI, RSI and Stochastic, it is clear that the fundamental indicators have being
TLM Map AM
Andriy Matviyevs'kyy
TLM Map AM (Trend Line Momentum Map) is an indicator developed based on a set of digital technical analysis indicators described in the article by Vladimir Kravchuk: " Digital indicators in the technical analysis of financial markets ". The indicator displays in a separate window a complex of digital technical analysis indicators such as FTLM and STLM. Recommended for use in conjunction with the RTL Map AM (Reference Trend Line Map) indicator. The indicator has no customizable parameters.
FREE
Introduction It is common practice for professional trades to hide their stop loss / take profit from their brokers. Either from keeping their strategy to the themselves or from the fear that their broker works against them. Using this indicator, the stop loss / take profit points will be drawn on the product chart using the bid price. So, you can see exactly when the price is hit and close it manually.  Usage Once attached to the chart, the indicator scans the open orders to attach lines fo
Diamond PRO
Fanur Galamov
5 (11)
Diamond PRO is enhanced powerful version of Diamond for advanced traders. Pro version includes optimized cores, new impoved entry points filters, new multistage profit closure algorithm and сontains number of external control parameter that allows build and fine tune own tradind decisions and algorithms. The system provides more accurate market entries, analyzes and filters upcoming economic news, contains spread protection and an advanced position management algorithm. Main goal of Diamond PRO
RSI heatmap
Mr Pimook Chokdamrongsuk
Welcome to the world of trading and technical analysis. In today's fast-paced markets, understanding market sentiment and identifying potential entry and exit points is crucial for successful trading. One essential tool in a trader's arsenal is the Relative Strength Index, or RSI. And now, we introduce the Free RSI Heat Map, a powerful visualization tool that brings RSI data to life. RSI Heat Map offers a comprehensive overview of the RSI values across multiple instruments, allowing trade
FREE
LineBreakMT4
Nattadecha Tangpakinwat
Key Features: Type of Indicator: Line Break Chart Indicator Usage: Identifying trend reversals and potential market turning points. Input Parameters: The primary input parameter is 'Lines_Break,' which represents the number of lines the price needs to move to create a new line in the opposite direction. How it works: The indicator draws green and red histogram bars to represent the line break chart. Green bars indicate an upward trend, and red bars indicate a downward trend. The indicator calcul
FREE
FreqoMeterForecast
Stanislav Korotky
The main idea of this indicator is rates analysis and prediction by Fourier transform. Indicator decomposes exchange rates into main harmonics and calculates their product in future. You may use the indicator as a standalone product, but for better prediction accuracy there is another related indicator - FreqoMaster - which uses FreqoMeterForecast as a backend engine and combines several instances of FreqoMeterForecast for different frequency bands. Parameters: iPeriod - number of bars in the ma
Strong Oscillator is an indicator designed to find indicator trends. It finds trends using a set of algorithms and a set of indicators. This indicator is a trend indicator. Helps to find trends easily. You can use this indicator alone, or you can use it as an auxiliary indicator for other strategically appropriate indicators. You can use it as a trend validation indicator. Suggestions and Features There are 4 level lines on the indicator. These level lines 5, 20 and 80 are 95 lines. 5, 20 le
Free automatic fibonacci
Tonny Obare
4.65 (62)
Free automatic Fibonacci is an indicator that automatically plots a Fibonacci retracement based on the number of bars you select on the BarsToScan setting in the indicator. The Fibonacci is automatically updated in real time as new highest and lowest values appears amongst the selected bars. You can select which level values to be displayed in the indicator settings. You can also select the color of the levels thus enabling the trader to be able to attach the indicator several times with differe
FREE
Noize Absorption Index MT4
Ekaterina Saltykova
5 (1)
Noize Absorption Index - is the manual trading system that measures the difference of pressure between bears forces and bulls forces. Green line - is a noize free index that showing curent situation. Zero value of index shows totally choppy/flat market.Values above zero level shows how powerfull bullish wave is and values below zero measures bearish forces.Up arrow appears on bearish market when it's ready to reverse, dn arrow appears on weak bullish market, as a result of reverse expectation. S
Indicador Taurus All4
Fabio Oliveira Magalhaes
Taurus All4 Taurus All4 is a high-performance indicator, it will tell you the strength of the trend, and you will be able to observe the strength of the candle. Our indicator has more than 4 trend confirmations. It is very simple and easy to use. Confirmation Modes Candle Trend Confirmations: When the candle switches to light green the trend is high. When the candle switches to light red the trend is reverting down. When the candle changes to dark red the trend is low. Trendline Trend Conf
Alpha Trend
Evgeny Belyaev
3.33 (3)
Alpha Trend is a trend indicator for the MetaTrader 4 platform; it has been developed by a group of professional traders. The Alpha Trend indicator finds the most probable tendency reversal points, which allows making trades at the very beginning of a trend. This indicator features notifications, which are generated whenever a new signal appears (alert, email, push-notification). This allows you to open a position in a timely manner. Alpha Trend does not redraw, which makes it possible to evalua
Royal Dutch Skunk
Sayan Vandenhout
ROYAL DUTCH SKUNK USES THE TREND WAVE INDICATOR AND IT CAN IDENTIFY THE BEGINNING AND THE END OF A NEW WAVE TREND MOVEMENT. AS AN OSCILLATOR, THE INDICATOR IDENTIFIES THE OVERBOUGHT AND OVERSOLD ZONES. IT WORKS GREAT TO CATCH THE SHORT TERM PRICE REVERSALS AND USES A MARTINGALE STRATEGY TO CLOSE ALL TRADES IN PROFIT. USE DEFAULT SETTINGS ON H1 OR HIGHER TIME FRAME ON ANY PAIR FOR MORE ACCURATE TRADES WHY THIS EA : Smart entries calculated by 6 great strategies The EA can be run on even a $20000
FreqoMaster
Stanislav Korotky
The main idea of this indicator is rates analysis and prediction by Fourier transform. The indicator decomposes exchange rates into main harmonics and calculates their product in future. The indicator shows 2 price marks in history, depicting price range in the past, and 2 price marks in future with price movement forecast. Buy or sell decision and take profit size are displayed in a text label in the indicator window. The indicator uses another indicator as an engine for calculations - FreqoMet
MA Crosses PRO MT4
Vladimir Gribachev
5 (1)
MA CROSSES PRO MT4는 이동 평균 십자 화살표 표시기입니다. 표시기 매개변수는 직관적인 이름을 가지며 각 라인은 별도로 구성됩니다. 표시기는 화살표를 표시하고, 신호음을 울리고, 이동 단말기 및 전자 메일로 알림을 전송하여 신호를 보낼 수 있습니다. 표시기는 다시 그리지 않습니다 촛불이 닫힐 때만 신호를 보냅니다. 스캘핑에 탁월 모든 쌍 및 모든 시간대에서 작동 시간 프레임이 오래될수록 신호가 더 좋습니다. 모든 거래 전략과 애드온으로 호환됩니다. 옵션: FASTER_MA - 빠르게 움직이는 기간; FASTER_MA_METHOD - 빠르게 이동하는 평균화 방법. FASTER_MA_PRICE - 중고 가격; FASTER_MA_SHIFT - 시프트; SLOWER_MA - 느리게 움직이는 기간; SLOWER_MA_METHOD - 느린 이동 평균 방법. SLOWER_MA_PRICE - 중고 가격; SLOWER_MA_SHIFT - 시프트; ALERT - 대
이 제품의 구매자들이 또한 구매함
Trade Assistant MT4
Evgeniy Kravchenko
4.46 (181)
거래당 위험 계산, 라인을 사용한 손쉬운 신규 주문, 부분 청산 기능을 통한 주문 관리, 7가지 유형의 트레일링 스탑 및 기타 유용한 기능을 제공합니다. 주의, 응용 프로그램은 전략 테스터에서 작동하지 않습니다. Manual, Description, Download demo 라인 기능       - 차트에 개시선, 손절매, 차익실현을 표시합니다. 이 기능을 사용하면 새로운 주문을 쉽게 하고 개봉 전에 추가 특성을 볼 수 있습니다. 위기 관리       -       위험 계산 기능은 설정된 위험과 손절매 주문의 크기를 고려하여 새 주문의 볼륨을 계산합니다. 이를 통해 손절매 크기를 설정하고 동시에 설정된 위험을 존중할 수 있습니다. 로트 계산 버튼 - 위험 계산을 활성화/비활성화합니다. 필요한 위험 값은 위험 필드에 0에서 100 사이의 백분율 또는 예금 통화로 설정됩니다. 설정 탭에서 위험 계산 옵션을 선택합니다. $ 통화, % 잔액, % 지분, % 자유 마진, % 사용
가격이 순식간에 변할 수 있는 시장에서 주문은 가능한 한 간단해야 한다고 생각하십니까? Metatrader에서는 주문을 열 때마다 시작 가격, 손절매 및 이익실현 및 거래 규모를 입력하는 창을 열어야 합니다. 금융 시장 거래에서 자본 관리는 초기 예금을 유지하고 곱하기 위해 필수적입니다. 따라서 주문을 하고 싶을 때 얼마나 큰 거래를 열어야 하는지 궁금할 것입니다. 이 단일 거래에서 위험을 감수해야 하는 예치금의 비율은 얼마입니까? 이 거래에서 얼마나 많은 이익을 얻을 수 있으며 위험 대비 이익 비율은 얼마입니까? 거래 규모를 설정하기 전에 거래 규모가 어떻게 되어야 하는지에 대한 질문에 대한 답을 얻기 위해 필요한 계산을 수행합니다. 이 모든 작업을 자동으로 수행하는 도구가 있다고 상상해 보십시오. 차트를 열고 시장 분석을 하고 진입점, 방어점(손절매) 및 목표(이익 실현)를 수평선으로 표시하고 마지막에 위험 수준을 정의합니다. 이 거래에서 감당할 수 있는 가용 자본의 %로, 이
Local Trade Copier EA MT4
Juvenille Emperor Limited
5 (80)
Local Trade Copier EA MT4 를 사용하여 매우 빠른 거래 복사 경험을 해보세요. 1분 안에 간편하게 설정할 수 있으며, 이 거래 복사기를 사용하면 Windows 컴퓨터 또는 Windows VPS에서 여러 개의 MetaTrader 터미널 간에 거래를 0.5초 미만의 초고속 복사 속도로 복사할 수 있습니다. 초보자든 전문가든 Local Trade Copier EA MT4 는 다양한 옵션을 제공하여 사용자의 특정 요구에 맞게 맞춤 설정할 수 있습니다. 이는 수익 잠재력을 높이려는 모든 사람을 위한 최고의 솔루션입니다. 지금 사용해보시고 이것이 왜 시장에서 가장 빠르고 쉬운 무역용 복사기인지 알아보세요! 팁: 여기 에서 데모 계정에서 Local Trade Copier EA MT4 데모 버전을 다운로드하여 사용해 볼 수 있습니다. 다운로드한 무료 데모 파일을 MT4 >> File >> Open Data Folder >> MQL4 >> Experts 폴더에 붙여넣고 터미
The product will copy all telegram signal to MT4   ( which you are member  ) , also it can work as remote copier.  Easy to set up, copy order instant, can work with almost signal formats, image signal, s upport to translate other language to English Work with all type of channel or group, even channel have "Restrict Saving Content", work with  multi channel, multi MT5 Work as remote copier: with signal have ticket number, it will copy exactly via ticket number. Support to backtest signal. How to
MT4 to Telegram Signal Provider 는 사용하기 쉽고 완전히 사용자 정의가 가능한 도구로, 텔레그램으로 신호를 보내어 계정을 신호 제공자로 변환할 수 있습니다. 메시지 형식은 완전히 사용자 정의가 가능합니다! 그러나 간단한 사용을 위해 미리 정의된 템플릿을 선택하고 메시지의 특정 부분을 활성화하거나 비활성화할 수도 있습니다. [ 데모 ]  [ 매뉴얼 ] [ MT5 버전 ] [ 디스코드 버전 ] [ 텔레그램 채널 ] 설정 단계별 사용자 가이드 가 제공됩니다. 텔레그램 API에 대한 지식이 필요 없으며, 개발자가 필요한 모든 것을 제공합니다. 주요 기능 구독자에게 보낸 주문 세부 정보를 사용자 정의할 수 있는 기능 예를 들어 브론즈, 실버, 골드와 같은 계층 구독 모델을 만들 수 있습니다. 골드 구독은 모든 신호 등을 받게 됩니다. ID, 심볼 또는 코멘트별 주문 필터링 주문이 실행된 차트의 스크린샷을 포함 보낸 스크린샷에 종료된 주문을 그려 추가
Trade Dashboard MT4
Fatemeh Ameri
5 (24)
Tired of complex order placement and manual calculations? Trade Dashboard is your solution. With its user-friendly interface, placing orders becomes effortless, by a single click, you can open trades, set stop loss and take profit levels, manage trade lot size, and calculate risk to reward ratios, allowing you to only focus on your strategy. Say goodbye to manual calculations and streamline your trading experience with Trade Dashboard. Download   demo version  right now. You can find details
당신이 멤버인 어떤 채널에서든(비공개 및 제한된 채널 포함) 신호를 직접 MT4로 복사하세요.  이 도구는 사용자를 고려하여 설계되었으며 거래를 관리하고 모니터하는 데 필요한 많은 기능을 제공합니다. 이 제품은 사용하기 쉽고 시각적으로 매력적인 그래픽 인터페이스로 제공됩니다. 설정을 사용자 정의하고 제품을 몇 분 안에 사용하십시오! 사용자 가이드 + 데모  | MT5 버전 | Discord 버전 데모를 시도하려면 사용자 가이드로 이동하십시오. Telegram To MT5 수신기는 전략 테스터에서 작동하지 않습니다! Telegram To MT4 특징 한 번에 여러 채널에서 신호를 복사합니다. 비공개 및 제한된 채널에서 신호를 복사합니다. Bot 토큰이나 채팅 ID가 필요하지 않습니다(필요한 경우 계속 사용할 수 있음). 위험 % 또는 고정된 로트를 사용하여 거래합니다. 특정 심볼을 제외합니다. 모든 신호를 복사할지 복사할 신호를 사용자 정의할지 선택합니다. 모든 신호를 인식하
TradePanel MT4
Alfiya Fazylova
4.91 (88)
Trade Panel은 다기능 거래 보조원입니다. 이 애플리케이션에는 수동 거래를 위한 50개 이상의 기능이 포함되어 있으며 대부분의 거래 작업을 자동화할 수 있습니다. 구매하기 전에 데모 계정에서 데모 버전을 테스트할 수 있습니다. 데모는 여기 에서 확인하세요. 전체 지침은 여기 에서 확인하세요. 거래 . 한 번의 클릭으로 기본적인 거래 작업을 수행할 수 있습니다: 보류 주문 및 포지션 열기 보류 주문 및 포지션을 마감합니다. 포지션 전환(매수를 청산하여 매도를 개시하거나 매도를 청산하여 매수를 개시). 포지션 고정(반대 포지션을 열어 SELL과 BUY 포지션의 볼륨을 동일하게 만듭니다). 모든 포지션을 부분 청산합니다. 모든 포지션의 이익실현 및/또는 손절매를 공통 수준으로 설정합니다. 모든 포지션의 손절매를 손익 분기점 수준으로 설정합니다. 주문 및 포지션을 열 때 다음을 수행할 수 있습니다. 설정된 위험에 따라 거래량 자동 계산을 사용합니다. 한 번의 클릭으로 여러 주문을 열
Trade copier MT4
Alfiya Fazylova
4.67 (30)
Trade Copier는 거래 계정 간의 거래를 복사하고 동기화하도록 설계된 전문 유틸리티입니다. 복사는 공급자의 계정/단말기에서 동일한 컴퓨터 또는 vps에 설치된 수신자의 계정/단말기로 발생합니다. 구매하기 전에 데모 계정에서 데모 버전을 테스트할 수 있습니다. 데모 버전 여기 . 전체 지침 여기 . 주요 기능 및 이점: 복사기는 "МТ4> МТ4", "МТ4> МТ5", "МТ5> МТ4" 복사를 지원합니다. 복사기는 데모 계정 > 실 계정, 실 계정 > 데모 계정, 데모 계정 > 데모 계정 및 실제 계정 > 실 계정 복사를 지원합니다. 복사기는 읽기 전용 암호가 적용된 투자자 계정에서 복사를 지원합니다. 하나의 공급자 터미널은 여러 수신 터미널로 트랜잭션을 보낼 수 있고 하나의 수신 터미널은 여러 공급자 터미널에서 트랜잭션을 수신할 수 있습니다. 복사기는 귀하 또는 귀하의 고문이 거래하는 동일한 터미널에서 작동할 수 있습니다. 높은 복사 속도(0.5초 미만). 복사기에는 간편
Averaging Helper
Sergey Batudayev
5 (2)
Averaging Helper - This sort of trading helper instrument will help you average out your previously unprofitable positions using two techniques: standard averaging hedging with the subsequent opening of positions according to the trend The utility has the ability to sort out several open positions in different directions at once, both for buy and for sell. For example, you opened 1 position for a sell and the second for a buy, and they are both unprofit, or one is in the unprofit and one is in
-25% discount ($199 -> $149) Advanced trading tool: One click smart orders that execute under your conditions Developed by trader for trading community:  position size calculator (lot size), open position after price action, strategy builder, set and forget trading, mobile notifications... Risk Management -  Risk percentage position size calculator, gain percentage, target risk reward ratio, spread and commissions are included in calculations 7 Advanced order types   - Set and forget trading
Mentfx Mmanage
Anton Jere Calmes
5 (16)
The added video will show you the full functionality, effectiveness, and simplicity of this trade manager. Drag and Drop Trade Manager. Draw your entry and have the tool calculate the rest. Advanced targeting and close portions of a trade directly available in tool (manage trades while you sleep). Market order or limit order on either side with factored spread. Just draw the entry, the tool does the rest. Hotkey setup to make it simple. Draw where you want to enter, and the stop loss, the tool c
The Best One Scalping Trade Panel functional manual trade panel with risk reward, auto SL by candle ( original solution), lot size calculation, one-click trading, scale in and out of trades (partial close),  Works with all symbols not just currency pairs, perfect works on DAX, NASDAQ, GOLD, ...... I earn every day during live stream on ZakopiecFX - join Me Risk by lot Risk by percent SL by points SL by Candle, Renko, RangeBar ( original solution) TP by point TP by Risk/Reward Auto Trailing b
Exp COPYLOT CLIENT for MT4
Vladislav Andruschenko
4.66 (68)
MetaTrader 4용 트레이드 복사기.       모든 계정의 외환 거래, 포지션, 주문을 복사합니다. 그것은 최고의 무역 복사기 중 하나입니다       MT4 - MT4, MT5 - MT4       위해       카피롯 MT4       버전(또는       MT4 -  MT5   MT5 - MT5       위해       카피롯 MT5       버전). MT5 버전 전체 설명   +DEMO +PDF 구입 방법 설치하는 방법     로그 파일을 얻는 방법     테스트 및 최적화 방법     Expforex의 모든 제품 복사기   버전         MetaTrader 5   터미널 (   МТ5 - МТ5, МТ4 - МТ5   ) -   Copylot Client MT5 고유한 복사 알고리즘은 마스터 계정에서 고객 계정으로 모든 거래를 정확하게 복사합니다. 이 제품은 또한 높은 작동 속도에서 높은 오류 처리로 유명합니다. 강력한 기능 세트. 프로그램
Unlimited Trade Copier Pro is a tool to copy trade remotely between multiple MT4/MT5 accounts at different computers/locations over internet. This is an ideal solution for signal provider, who want to share his trade with the others globally on his own rules. One provider can copy trades to multiple receivers and one receiver can get trade from multiple providers as well. The provider can even set the subscription expiry for each receiver, so that receiver will not be able to receive the signal
The top-selling EAs on the market cost a lot and one day they are suddenly gone. This is because one strategy will not work in the forex market all the time. Our product is unique from all others in the MQL Marketplace because our EA comes with 34+ built-in indicators that allow adding more strategies every time.  You build your strategy and keep updating it. If one strategy does not work, simply build another all using only one EA. This is All-In-One EA in this market place. You can use as trad
The News Filter
Leolouiski Gan
5 (18)
이 제품은 뉴스 시간 동안 모든 전문가 어드바이저 및 수동 차트를 필터링하여 수동 거래 설정이나 다른 전문가 어드바이저가 입력한 거래가 파괴될 수 있는 급격한 가격 상승으로부터 걱정하지 않아도 됩니다. 이 제품은 또한 뉴스 발표 전에 열린 포지션과 대기 주문을 처리할 수 있는 완전한 주문 관리 시스템이 함께 제공됩니다. The News Filter  를 구매하면 더 이상 내장 뉴스 필터에 의존할 필요가 없으며 이제부터 모든 전문가 어드바이저를 여기서 필터링할 수 있습니다. 뉴스 선택 뉴스 소스는 Forex Factory의 경제 캘린더에서 얻어집니다. USD, EUR, GBP, JPY, AUD, CAD, CHF, NZD 및 CNY와 같은 어떤 통화 기준으로 선택할 수 있습니다. Non-Farm (NFP), FOMC, CPI 등과 같은 키워드 식별을 기준으로 선택할 수도 있습니다. 저, 중, 고 영향을 가지는 뉴스를 필터링할 수 있도록 선택할 수 있습니다. 차트와 관련된 뉴스만 선택
DrawDown Limiter MT4
Haidar, Lionel Haj Ali
5 (9)
Drawdown Limiter EA You are in the right place if you were searching for Drawdown control, Drawdown limiter, Balance protection, Equity Protection or Daily Drawdown Limit related to Prop Firm, FTMO, or Funded account trading, or if you want to protect your trading account. Have you suffered from controlling your drawdown when trading funded accounts? This EA is meant for you. Prop firms usually set a rule called “Trader Daily Drawdown”, and if it is not respected, you are disqualified.  I am an
거래 관리자는 위험을 자동으로 계산하는 동시에 거래를 빠르게 시작하고 종료하는 데 도움을 줍니다. 과잉 거래, 복수 거래 및 감정 거래를 방지하는 데 도움이 되는 기능이 포함되어 있습니다. 거래를 자동으로 관리할 수 있으며 계정 성과 지표를 그래프로 시각화할 수 있습니다. 이러한 기능은 이 패널을 모든 수동 거래자에게 이상적으로 만들고 MetaTrader 4 플랫폼을 향상시키는 데 도움이 됩니다. 다중 언어 지원. MT5 버전  |  사용자 가이드 + 데모 트레이드 매니저는 전략 테스터에서 작동하지 않습니다. 데모를 보려면 사용자 가이드로 이동하세요. 위기 관리 % 또는 $를 기준으로 위험 자동 조정 고정 로트 크기 또는 거래량과 핍을 기반으로 한 자동 로트 크기 계산을 사용하는 옵션 RR, Pips 또는 Price를 사용한 손익분기점 손실 설정 추적 중지 손실 설정 목표 달성 시 모든 거래를 자동으로 마감하는 최대 일일 손실률(%)입니다. 과도한 손실로부터 계정을 보호하고 과도한
Trade Assistant Pro 36 in 1
Makarii Gubaydullin
4.95 (20)
다기능 도구: 로트 계산기, 가격 조치, R/R 비율, 무역 관리자, 공급 및 수요 영역을 포함한 65개 이상의 기능 데모 버전   |   사용자 매뉴얼   |   MT5 버전 이 유틸리티는 전략 테스터에서 작동하지 않습니다. 여기에서 데모 버전을 다운로드하여 제품을 테스트할 수 있습니다. Contact me   질문/개선 아이디어가 있는 경우/버그가 발견된 경우 저에게 연락 하십시오. 거래 프로세스를 간소화, 가속화 및 자동화하십시오. 이 대시보드로 표준 터미널 기능을 확장하십시오. 유틸리티는 외환, 주식, 지수, 암호화폐 등 모든 거래 수단에서 작동합니다. 1. 새로운 거래 열기 : 로트/리스크/RR 계산: 1. Lot 계산기 (리스크 규모에 따른 거래량 계산) 2. 리스크 계산기 (로트 규모에 따른 리스크 금액) 3. 위험/보상 비율(RR) 4. 주문에 대한 활성화 트리거 + StopLimit 구매 / StopLimit 판매 5. 가상 SL / TP 레벨 (숨겨진 SL
외환 포트폴리오를 관리하십시오. 당신이 서 있는 위치, 효과가 있는 것과 통증을 유발하는 것을 즉시 확인하십시오! MT5 버전은 여기에서 사용 가능: https://www.mql5.com/en/market/product/58658 Trade Manager 대시보드는 현재 외환 시장에서 각 포지션이 어디에 있는지 한 눈에 보여주고 위험 관리 및 통화 노출을 더 쉽게 이해할 수 있도록 설계되었습니다. 여러 포지션 또는 거래 그리드 및 바스켓 전략을 사용하여 점진적으로 시장으로 확장하는 거래자의 경우 이것이 핵심 정보입니다. 터미널에서 여러 위치를 모니터링하는 것은 종종 관리하기 어렵습니다. 저조한 위험을 과도하게 활용하고 사용하는 것은 신규 거래자와 일부 숙련된 거래자가 직면한 주요 문제입니다. 거래 관리자는 각 통화에 대한 노출을 개별적으로 표시하여 한 번에 양방향 거래를 하지 않도록 합니다. 특징: 공개 거래 - 통화 쌍별로 정렬된 현재 공개 거래를 모두 봅니다. 쌍뿐만
VirtualTradePad mt4 Extra
Vladislav Andruschenko
4.86 (63)
한 번의 클릭으로 거래할 수 있는 거래 패널.   위치 및 주문 작업!   차트 또는 키보드에서 거래. 거래 패널을 사용하면 차트에서 클릭 한 번으로 거래하고 표준 MetaTrader 컨트롤보다 30배 빠르게 거래 작업을 수행할 수 있습니다. 거래자의 삶을 더 쉽게 만들고 거래자가 훨씬 빠르고 편리하게 거래 활동을 수행할 수 있도록 도와주는 매개변수 및 기능의 자동 계산. 차트의 무역 거래에 대한 그래픽 팁 및 전체 정보. MT5 버전 전체 설명   +DEMO +PDF 구입 방법 설치하는 방법     로그 파일을 얻는 방법     테스트 및 최적화 방법     Expforex의 모든 제품 열기 및 닫기, 반전 및 잠금, 부분 닫기/오토로트. 가상/실제 손절매/이익 실현/후행 정지/손익분기점, 주문 그리드 .... MetaТrader 4   의 주요 요청 거래 제어판   : 구매, 판매, 구매 중지, 구매 제한, 판매 중지, 판매 제한, 닫기, 삭제, 수정, 후행 중지,
RedFox Copier Pro
Rui Manh Tien
4.75 (12)
FREE SIGNAL CHANEL:  https://t.me/redfox_daily_forex_signals Time saving and fast execution Whether you’re traveling or sleeping, always know that Telegram To Mt4 performs the trades for you. In other words, Our   Telegram MT4 Signal Trader  will analyze the trading signals you receive on your selected Telegram channels and execute them to your Telegram to MT4 account. Reduce The Risk Telegram To Mt4   defines the whole experience of copying signals from   Telegram signal copier to mt4  p
KT Equity Protector MT4
KEENBASE SOFTWARE SOLUTIONS
3 (2)
KT Equity Protector EA consistently monitors the account equity and closes all the market and pending orders once the account equity reached a fixed equity stop loss or profit target.  After closing all trading positions, the EA can close all open charts to stop other expert advisors from opening more trading positions. Equity Stop-Loss If your current account balance is $5000 and you set an equity stop loss at $500. In this case, the KT Equity Protector will close all the active and pending
MT4 To Notion
DaneTrades Ltd
5 (2)
이 프로그램을 사용하면 매우 친숙한 사용자 인터페이스를 사용하여 MetaTrader 계정에서 모든 거래를 직접 Notion으로 내보낼 수 있습니다.  MT5 버전  |  사용자 가이드 + 데모 시작하려면 사용자 가이드를 사용하고 Notion 템플릿을 다운로드하십시오. 데모를 원하는 경우 사용자 가이드로 이동하십시오. 전략 테스터에서 작동하지 않습니다! 주요 기능 거래 계정의 모든 거래를 Notion으로 내보내기 최근 일부터 거래 내보내기 최근 주부터 거래 내보내기 최근 달부터 거래 내보내기 사용자 정의 시간 범위에서 거래 내보내기 모든 새로운 종료된 거래를 자동으로 Notion으로 보내기 주문 유형, 거래량, 개시 시간, 종료 시간 등을 포함하여 내보내기에 포함할 필드 선택 시작하는 방법 위의 사용자 가이드로 이동하거나 EA를 시작하고 '연결 도움말 받기'를 클릭하십시오. 연결된 후에는 '시작: 모두 내보내기'를 클릭하여 현재 트레이드를 모두 내역에서 Notion으로 보내십
Partial Closure EA MT4
Juvenille Emperor Limited
5 (3)
부분 폐쇄 EA MT4 는 로트 크기 및/또는 거래 티켓의 특정 백분율로 수동으로 또는 초기 로트 크기의 백분율 %에 대해 TP/SL 수준의 백분율로 자동으로 거래 계정의 모든 거래를 부분적으로 닫을 수 있습니다. 10은 이익을 취하고 10은 손실 ​​수준을 중지합니다. 특정 매직 넘버 또는 심볼 거래를 지정하거나 제외하여 계정의 모든 거래 또는 모든 거래를 관리할 수 있습니다. 팁: 부분 폐쇄 EA MT4의 무료 데모 버전을 다운로드하고 데모 계정에서 사용해 보십시오: 여기 다운로드한 무료 데모 파일을 MT4 >> File >> Open Data Folder >> MQL4 >> Experts 폴더에 붙여넣고 터미널을 다시 시작합니다.   무료 데모 버전은 데모 계정에서만 한 번에 4시간 동안 모든 기능을 사용할 수 있습니다. 평가판 기간을 재설정하려면 MT4 >> 도구 >> 전역 변수 >> Control + A >> 삭제로 이동하세요. 이 작업은 중요하지 않은 데모 계정에서만
-25% discount ($149 -> $111) Everything for chart Technical Analysis indicator mt4 in one tool Draw your supply demand zone with rectangle and support resistance with trendline and get alerts to mobile phone or email alert -  Risk reward indicator Video tutorials, manuals, DEMO download   here .  Find contacts on my   profile . 1.   Extended rectangles and trendlines Object will be extended to the right edge of the chart when price will draw new candles on chart. This is rectangle extender or
MT4 to Discord Signal Provider 는 Discord로 직접 거래 신호를 보내는 데에 설계된 사용자 친화적이고 완전히 맞춤화할 수 있는 유틸리티입니다. 이 도구는 귀하의 거래 계좌를 효율적인 신호 제공자로 변환합니다. 귀하의 스타일에 맞게 메시지 형식을 사용자 정의하세요! 사용 편의성을 위해 사전에 디자인된 템플릿을 선택하고 포함하거나 제외할 메시지 요소를 선택할 수 있습니다. [ 데모 ] [ 매뉴얼 ] [ MT5 버전 ] [ Telegram 버전 ] 설정 간편한 설정을 위해 저희의 상세한 사용자 가이드 를 따르세요. Discord API에 대한 사전 지식이 필요 없습니다; 필요한 모든 도구를 제공합니다. 주요 기능 구독자 업데이트를 위한 주문 세부 정보를 사용자 정의합니다. 각 계층이 다른 수준의 신호 접근을 제공하는 브론즈, 실버, 골드와 같은 계층적 구독 모델을 구현합니다. 주문이 실행된 차트의 스크린샷을 첨부합니다. 더 명확하게 하기 위해 이 스크린
Comprehensive on chart trade panel with the unique ability to be controllable from mobile as well. Plus has a library of downloadable configuration, e.g. exit rules, extra panel buttons, pending order setup and more. Please see our product video. Works with all symbols not just currency pairs. Features On chart panel plus controllable from free app for Windows, iPhone and Android Built-in script engine with library of downloadable configuration, e.g. add 'Close All Trades in Profit' button, exit
MT4 Alert Signal Trader  is an EA that helps you trade MT4 Alert popup. Some indicators can provide signals by showing an alert popup containing signal texts. This EA will read and trade these signal texts. The alert texts should contain at least 2 elements:  (1) a symbol text   (ex: "EURUSD") and  (2) a command type   (ex: "Buy", "Sell", "Close") that trigger EA's trading activities. Some other contents that may have or not are open price, stop loss, take profit values... The EA needs an aweso
제작자의 제품 더 보기
Multi Chart Crosshairs
Robert Gerald Wood
5 (2)
This indicator is designed to make reviews of many charts on different timescales quicker, and easier to do. Track Time and Price across multiple charts Change Symbol on one chart and all other charts of the same symbol will be changed too. Easy to use, quick to master The indicator allows you to identify the price and time where the mouse pointer is on the current chart, across all other charts open on the same Symbol. This allows you to quickly see information on multiple charts whereas normal
Range Exhaustion MT5
Robert Gerald Wood
범위 소진은 가격이 현재 기간의 예상 범위를 충족하거나 초과할 때 발생합니다. 이 수준에서 가격은 기간 초반에 비해 모멘텀을 잃기 시작하므로 새로운 포지션을 취하지 않도록 하는 것이 좋습니다. 이 지표는 일별, 주별 및 월별 기간에 대한 수준을 표시하여 차트에서 이러한 일이 발생할 가능성이 있는 위치를 보여줍니다. 이러한 고갈 수준을 초과하는 가격을 보면 움직임의 모멘텀이 매우 강하고 더 높은 기간 수준으로 향하고 있음을 알 수 있습니다. 지표는 기본 설정에 따라 ATR(Average True Range) 또는 ADR(Average Range) 계산을 사용할 수 있습니다. 기본적으로 우리는 Forex 차트에서 더 잘 작동하는 ATR을 사용하지만 ADR은 주식 기반 지수 및 기호에서 우위를 점합니다. 표시기에는 아래에 설명된 여러 그리기 모드가 있어 필요에 맞게 조정할 수 있습니다. 설정 계산 모드 레벨 계산을 위해 ATR(AverageTrueRange) 또는 ADR(Averag
Active Pivot Levels
Robert Gerald Wood
5 (1)
피벗 수준은 모든 시장에서 인정되는 잘 확립된 기술 수준입니다. 이 표시기는 모든 기호에 대해 현재 분기별, 월별, 주별, 일별 및 4시간별 피벗을 차트에 그립니다. 또한 각 기간에 대한 지원 및 저항 수준을 표시하고 수준 1에서 4까지 표시할 항목을 선택할 수 있습니다.     다음에서 피벗 유형을 선택합니다. 기준 도당 데마크 우디 피보나치 DeMark 피벗에는 원래 사양에 따라 단일 지원 및 저항 수준이 있습니다. 표시기 벽은 선이 가격에 닿은 경우 선이 그려지는 방식을 변경합니다. 이것은 매우 도움이 될 수 있으며 라인 지원 또는 저항의 강도는 일단 만지면 상당히 감소합니다. 각 기간에 대해 예측 피벗 수준을 표시하도록 선택할 수 있습니다. 이것은 일반 피벗과 동일한 계산을 사용하지만 현재 불완전한 기간에서 작동합니다. 따라서 가격이 이미 범위의 대부분을 커버하는 해당 기간이 끝날 무렵에 가장 잘 사용됩니다. 설정 모든 설정에 대한 자세한 내용은 별도의 블로그 게시물에서
Multi Chart Crosshairs MT5
Robert Gerald Wood
5 (7)
이 표시기는 다양한 시간 척도의 많은 차트를 더 빠르고 쉽게 검토할 수 있도록 설계되었습니다. 여러 차트에서 시간 및 가격 추적 한 차트의 심볼 변경 및 동일한 심볼의 다른 모든 차트도 변경됩니다. 사용하기 쉽고 빠르게 마스터하기 표시기를 사용하면 동일한 기호에 열려 있는 다른 모든 차트에서 마우스 포인터가 현재 차트에 있는 가격과 시간을 식별할 수 있습니다. 이렇게 하면 일반적으로 동일한 위치를 식별하는 데 약간의 시간을 소비해야 하는 반면 여러 해도에 대한 정보를 빠르게 볼 수 있습니다. 열려 있는 모든 차트에서 시간만 추적하도록 선택할 수도 있습니다. 이를 통해 다이버전스 헌팅 시 쉽게 탐색할 수 있습니다. 한 차트에서 심볼을 변경하면 동일한 심볼의 다른 모든 차트가 해당 기간 설정을 유지하면서 새 심볼로 전환됩니다. 사용하는 방법 차트를 검토할 때 추세와 거래 수준을 식별하기 위해 여러 기간을 살펴보는 것을 좋아합니다. 나는 그것을 돕기 위해 이 도구를 만들었고 또한 장기간
TheStrat Monitor
Robert Gerald Wood
3 (2)
If you've not already learnt about The Strat trading strategy , go google it now. I promise it won't be a waste of your time, and you will likely learn some new tricks whether you use it or not. OK, so now you know what TheStrat is, you will be able to understand what this indicator can do for you. Key Features In short, the Indicator will: Show Timeframe Continuity for all supported timeframes Supports two timeset views, Day trader and Swing trader Show when Full Timeframe Continuity is in pl
TheStrat Levels
Robert Gerald Wood
This indicator draws the prior Highs and Lows for multiple timeframes, and can display potential Take Profit and Stop Loss levels. In Rob Smith's # The Strat   terms,   these are potential entry points, or alternatively potential targets for open positions. I like to use them in both ways. On a lower timeframe, say 5 minutes to get a good entry on a daily or weekly level, and then as a potential target. Very small stops required giving an excellent risk/reward ratio. Please watch the DEMO video
TheStrat Candles
Robert Gerald Wood
4.5 (2)
이 표시기는 다음을 기준으로 각 캔들 위 또는 아래에 레이블을 그립니다.       롭 스미스       더 스트랫       차트에서 시간이 지남에 따라 발전합니다. 가격이 변화함에 따라 캔들은 세 가지 상태 사이를 전환할 수 있습니다. 캔들이 처음 시가를 형성할 때 이전 캔들의 고저점 내에 완전히 위치하면 유형 1로 시작합니다. 시간이 지남에 따라 이전 캔들의 고점이나 저점을 돌파하면 유형 2, 그리고 가격 움직임이 변동적이고 방향성이 없다면 이전 양초의 반대편을 깨고 유형 3이 될 수 있습니다. 양초 각 양초는 이전 양초와의 관계로 정의됩니다. 유형 1 - 내부 캔들   - 캔들이 완전히 이전 캔들의 고점과 저점 내에 있습니다. 내부 양초는 시장이 우유부단한 지점에 있음을 보여줍니다. 유형 2 - 추세 양초   - 양초가 이전 양초의 고점 또는 저점 위나 아래로 확장되지만 둘 다는 아닙니다. 유형 3 - 외부 캔들   - 캔들이 이전 캔들의 고가와 저가를
TheStrat Levels MT5
Robert Gerald Wood
5 (1)
This indicator draws the prior Highs and Lows for multiple timeframes, and can display potential Take Profit and Stop Loss levels. In Rob Smith's # The Strat  terms, these are potential entry points, or alternatively potential targets for open positions. I like to use them in both ways. On a lower timeframe, say 5 minutes to get a good entry on a daily or weekly level, and then as a potential target. Very small stops required giving an excellent risk/reward ratio. Key Features  - Levels from Ho
TheStrat Patterns
Robert Gerald Wood
This indicator will draw patterns based on Rob Smith's The Strat as they emerge in real time on your chart. As price evolves, TheStrat offers 18 distinct price action patterns that can help you get good entries in the market. Each pattern involves two or three candles, and this indicator will draw a bounding box around the candles and name the pattern. The indicator also shows when a potential setup is forming, known by stratters as an Actionable signal. Candles Each candle is defined by i
TheStrat Candles MT5
Robert Gerald Wood
This indicator will draw a label above or below each candle based on   Rob Smith's   The Strat   as they develop over time on your chart. As price evolves, a candle can switch between three states. When the candle first opens, if it sits completely within the previous candles high and low, then it will start as a Type 1. As time moves on, if it breaks either the high or low of the previous candle, it will be come a type 2, and should the price action be volatile and directionless, it may then
TheStrat TFC Monitor MT5
Robert Gerald Wood
5 (1)
The Strat를   사용하여 거래할 때 여러 시간대를 주시하는 것이 중요합니다. 이 표시기는 각 기간에 대한 현재 캔들의 일일, 주간, 월간 및 분기별 상태를 표시합니다. 원 아이콘은 해당 기간의 캔들이 현재 내부 또는 TheStrat 용어로 유형 1임을 나타냅니다. 인사이드 데이 양초가 가격 움직임을 통합하고 있으며 우리는 범위의 돌파를 찾고 있습니다. 위 또는 아래를 가리키는 삼각형 아이콘은 추세 양초 또는 TheStrat 용어의 유형 2입니다. 추세 양초는 강세 또는 약세일 수 있으며, 이는 이전 양초 범위를 벗어나 현재 한 방향으로 추세를 보이고 있음을 나타냅니다. 사각형 아이콘은 아웃사이드 캔들 또는 Strat 용어로 Type 3입니다. 이것은 두 가지를 나타냅니다. 하나는 가격이 해당 기간에 대한 방향에 대해 결정되지 않았고 상당히 고르지 못할 가능성이 높으며, 두 번째는 더 낮은 기간에 짧은 반전을 거래할 수 있는 좋은 기회가 있을 가능성이 있다는 것입니다. 사각형은
A simple script that can delete all the drawing objects on a chart, or just the objects of a specific type. Settings: DeleteObjectsOfType By default the value will be blank which means ALL drawing objects on the chart will be deleted. If you only wish to delete specific types of drawing object, change this setting to the type of object to delete. For example, Fibonacci Retracement, Text, Label or Trend Line. Please see the demonstration video for more information.
FREE
나는 Rob Smith의 TheStrat에 대해 배우는 동안 이 간단한 표시기를 만들었고 그것이 매우 유용하다고 생각하여 여러분과 공유해야겠다고 생각했습니다. 유용하다고 생각되면 MQL5에 게시한 다른 지표를 살펴보십시오. 이 지표는 차트에서 더 높은 기간에서 선택한 가격 수준을 보여주는 단일 선을 그립니다. 설정을 사용하면 표시되는 기간을 완전히 제어할 수 있지만   기본적으로 한 단계 위로 스케일을 이동하여 더 높은 기간 자체를 계산합니다. 예를 들어 H1 차트를 열면 H4 차트의 데이터가 표시됩니다. 설정 TrackTimeframe 가격 수준을 그릴 기간을 선택합니다. 기본 설정인 현재로 두면 적절한 기간이 선택됩니다. 선이 항상 위쪽으로 조정되므로 차트를 검토하고 기간 사이를 변경하는 경우 매우 유용합니다. 트랙값 아래 표준 가격 값에서 하나를 선택할 수 있습니다. 기본값은 시가입니다. PRICE_CLOSE 종가 PRICE_OPEN 시가 가격_높음 해당 기간의 최대 가격
FREE
This script allows you to toggle the "Show Trade Levels" option, but for the current chart only. Normally, you can only change the setting using the Options -> Chart menu for ALL charts, but this script allows you to do it for a SINGLE chart. I'm using it when I take screenshots, because most of the time I'm not trying to show the trades, just some functionality of one of my other tools. Iif you need that functionality, then this script is very helpful! If the script helps you, please let me
FREE
TheStrat FTFC
Robert Gerald Wood
FTFC는 Rob Smith의   The Strat   에서 정의한 전체 시간 프레임 연속성을 나타냅니다. 이 지표는 분기별, 월별, 주별, 일별 또는 시간별 시가 수준 중 가장 높은 값 중 하나와 해당 값 중 가장 낮은 값 중 두 번째로 차트에 두 개의 선을 그립니다. 이것은 거래가 한 방향으로 매우 강하게 될 가능성이 높은 위 또는 아래의 채널을 제공합니다. 라인 사이에서 가격 조치는 더 고르지 않으며 더 넓은 스톱을 사용할 수 있습니다. 고점과 저점 사이의 중간 지점을 표시하기 위해 세 번째 파선도 그려집니다. 시장이 특정 방향으로 가격을 밀고자 하기 때문에 지지나 저항을 찾기에 좋은 경우가 많습니다. 색상을 NONE으로 설정하여 선택하면 이 선을 끌 수 있습니다. 설정 분기별 수준 포함 일부 사람들이 무시하는 것을 선호하므로 분기별 시가를 계산에 포함하도록 선택할 수 있습니다. IncludeCurrentTimeframeOpen true인 경우 현재 표시된 기간이 H1, D
Round Price Levels
Robert Gerald Wood
시장은 어림수를 정말 좋아하며 시장이 하락할 때 지지선 역할을 하거나 가격이 상승할 때 저항선 역할을 하는 경우가 많습니다. 이 지표는 라운드 값에서 가격 수준을 그리도록 설계되었습니다. 이 작업은 자동으로 수행되지만 이를 재정의하고 보고 싶은 수준을 결정할 수도 있습니다. 라운드 레벨은 10단계만큼 간단할 수 있으므로 10, 20, 30 등 또는 Forex에서 작업하는 경우 0.1 또는 0.01에서 변경 사항을 보고 싶을 수 있습니다. 표시기는 각각 다른 형식을 사용하여 Major 및 Minor라는 두 클래스의 라인을 그립니다. 이를 통해 레벨의 서로 다른 두 가지 변화 사이의 변화를 동시에 볼 수 있습니다. 알림 이 표시기에는 가격이 구성 가능한 거리 내에 있을 때 메이저, 마이너 또는 두 가격 수준에서 경보를 울리는 기능이 포함됩니다. 자동 설정 기본적으로 지표는 메이저 및 마이너 가격 모두에 대해 적절한 수준을 결정합니다. 언제든지 화면에 표시할 줄 수를 제어하는 구
TheStrat TFC Monitor
Robert Gerald Wood
The Strat를   사용하여 거래할 때 여러 시간대를 주시하는 것이 중요합니다. 이 표시기는 각 기간에 대한 현재 캔들의 일일, 주간, 월간 및 분기별 상태를 표시합니다. 원 아이콘은 해당 기간의 캔들이 현재 내부 또는 TheStrat 용어로 유형 1임을 나타냅니다. 인사이드 데이 양초가 가격 움직임을 통합하고 있으며 우리는 범위의 돌파를 찾고 있습니다. 위 또는 아래를 가리키는 삼각형 아이콘은 추세 양초 또는 TheStrat 용어의 유형 2입니다. 추세 양초는 강세 또는 약세일 수 있으며, 이는 이전 양초 범위를 벗어나 현재 한 방향으로 추세를 보이고 있음을 나타냅니다. 사각형 아이콘은 아웃사이드 캔들 또는 Strat 용어로 Type 3입니다. 이것은 두 가지를 나타냅니다. 하나는 가격이 해당 기간에 대한 방향에 대해 결정되지 않았고 상당히 고르지 못할 가능성이 높으며, 두 번째는 더 낮은 기간에 짧은 반전을 거래할 수 있는 좋은 기회가 있을 가능성이 있다는 것입니다. 사각형은
ATR Extremes
Robert Gerald Wood
ATR(Average True Range)은 설정된 기간 동안 가격의 움직임을 측정하는 일반적으로 사용되는 지표입니다. 그러나 그것이 주는 가치는 어떤 종류의 경계에서도 정의되지 않기 때문에 손절매나 이익실현 계산 이외의 다른 용도로 사용하는 것은 거의 불가능합니다. 이 표시기는 표준 ATR 표시기이지만 극한값을 볼 수 있도록 백분위수 구분을 도입했습니다. 백분위수와 중앙값 분할 중에서 선택할 수 있습니다. 백분위수 수준 백분위수 수준은 1%, 5%, 20%, 50%, 80%, 95%, 99%로 표시되며 가격이 다른 모든 값과 관련된 위치를 보여줍니다. 예를 들어, 5% 수준은 선 아래에서 ATR 판독값의 5%만이 그렇게 낮아진다고 말하고 99%는 그 수준보다 높은 ATR 값 중 1%만이 그렇게 높다고 말합니다. 80% 이상에서는 새로운 거래에 대해 포지션 크기를 낮추기 시작할 수 있으며 95% 이상은 모멘텀이 바뀌기 전에 이익을 취하기에 좋은 시기일 수 있습니다
Range Exhaustion
Robert Gerald Wood
범위 소진은 가격이 현재 기간의 예상 범위를 충족하거나 초과할 때 발생합니다. 이 수준에서 가격은 기간 초반에 비해 모멘텀을 잃기 시작하므로 새로운 포지션을 취하지 않도록 하는 것이 좋습니다. 이 지표는 일별, 주별 및 월별 기간에 대한 수준을 표시하여 차트에서 이러한 일이 발생할 가능성이 있는 위치를 보여줍니다. 이러한 고갈 수준을 초과하는 가격을 보면 움직임의 모멘텀이 매우 강하고 더 높은 기간 수준으로 향하고 있음을 알 수 있습니다. 지표는 기본 설정에 따라 ATR(Average True Range) 또는 ADR(Average Range) 계산을 사용할 수 있습니다. 기본적으로 우리는 Forex 차트에서 더 잘 작동하는 ATR을 사용하지만 ADR은 주식 기반 지수 및 기호에서 우위를 점합니다. 표시기에는 아래에 설명된 여러 그리기 모드가 있어 필요에 맞게 조정할 수 있습니다. 설정 계산 모드 레벨 계산을 위해 ATR(AverageTrueRange) 또는 ADR(Averag
TheStrat FTFC MT5
Robert Gerald Wood
FTFC는 Rob Smith의   The Strat   에서 정의한 전체 시간 프레임 연속성을 나타냅니다. 이 지표는 분기별, 월별, 주별, 일별 또는 시간별 시가 수준 중 가장 높은 값 중 하나와 해당 값 중 가장 낮은 값 중 두 번째로 차트에 두 개의 선을 그립니다. 이것은 거래가 한 방향으로 매우 강하게 될 가능성이 높은 위 또는 아래의 채널을 제공합니다. 라인 사이에서 가격 조치는 더 고르지 않으며 더 넓은 스톱을 사용할 수 있습니다. 최고점과 최저점 사이의 중간 지점을 표시하기 위해 세 번째 점선도 그려집니다. 시장이 특정 방향으로 가격을 밀고자 하기 때문에 지지나 저항을 찾기에 좋은 경우가 많습니다. 색상을 NONE으로 설정하여 선택하면 이 선을 끌 수 있습니다. 설정 분기별 수준 포함 일부 사람들이 무시하는 것을 선호하므로 분기별 시가를 계산에 포함하도록 선택할 수 있습니다. IncludeCurrentTimeframeOpen true인 경우 현재 표시된 기간이 H1
TheStrat Patterns MT5
Robert Gerald Wood
This indicator will draw patterns based on   Rob Smith's   The Strat   as they emerge in real time on your chart. As price evolves,   TheStrat   offers 18 distinct price action patterns that can help you get good entries in the market. Each pattern involves two or three candles, and this indicator will draw a bounding box around the candles and name the pattern. The indicator also shows when a potential setup is forming, known by stratters as an Actionable signal. Candles Each candle is de
TheStrat Monitor MT5
Robert Gerald Wood
5 (1)
Strat 거래 전략   에 대해 아직 배우지 않았다면 지금 Google로 이동하십시오. 나는 그것이 당신의 시간 낭비가 아닐 것이라고 약속하며, 당신이 그것을 사용하든 안 하든 몇 가지 새로운 요령을 배우게 될 것입니다. 자, 이제 TheStrat이 무엇인지 알았으니 이 지표가 당신을 위해 무엇을 할 수 있는지 이해할 수 있을 것입니다. 주요 특징들 즉, 지표는 다음을 수행합니다. 지원되는 모든 기간에 대한 기간 연속성 표시 Day trader와 Swing trader의 두 가지 시간 설정 보기를 지원합니다. 연속된 4개의 기간에 대해 전체 기간 연속성이 있는 경우 표시 각 기간에 대한 현재 캔들 상태 표시 모든 시간대에 현재 패턴이 있는 경우 표시 In-force 및 Actionable 패턴을 모두 표시합니다. 5초마다 업데이트(1초부터 설정 가능) 패널을 클릭하여 선택한 종목 및 기간에 대한 차트를 열 수 있습니다. 차트를 여는 데 사용할 차트 템플릿을 선택할 수 있습니다.
피벗 수준은 모든 시장에서 인정되는 잘 확립된 기술 수준입니다. 이 표시기는 모든 기호에 대해 현재 분기별, 월별, 주별, 일별 및 4시간별 피벗을 차트에 그립니다. 또한 각 기간에 대한 지원 및 저항 수준을 표시하고 수준 1에서 4까지 표시할 항목을 선택할 수 있습니다.     다음에서 피벗 유형을 선택합니다. 기준 도당 데마크 우디 피보나치 DeMark 피벗에는 원래 사양에 따라 단일 지원 및 저항 수준이 있습니다. 표시기 벽은 선이 가격에 닿은 경우 선이 그려지는 방식을 변경합니다. 이것은 매우 도움이 될 수 있으며 라인 지원 또는 저항의 강도는 일단 만지면 상당히 감소합니다. 각 기간에 대해 예측 피벗 수준을 표시하도록 선택할 수 있습니다. 이것은 일반 피벗과 동일한 계산을 사용하지만 현재 불완전한 기간에서 작동합니다. 따라서 가격이 이미 범위의 대부분을 커버하는 해당 기간이 끝날 무렵에 가장 잘 사용됩니다. 설정 모든 설정에 대한 자세한 내용은 별도의 블로그 게시물에서
Round Price Levels MT5
Robert Gerald Wood
시장은 어림수를 정말 좋아하며 시장이 하락할 때 지지선 역할을 하거나 가격이 상승할 때 저항선 역할을 하는 경우가 많습니다. 이 지표는 라운드 값에서 가격 수준을 그리도록 설계되었습니다. 이 작업은 자동으로 수행되지만 이를 재정의하고 보고 싶은 수준을 결정할 수도 있습니다. 라운드 레벨은 10단계만큼 간단할 수 있으므로 10, 20, 30 등 또는 Forex에서 작업하는 경우 0.1 또는 0.01에서 변경 사항을 보고 싶을 수 있습니다. 표시기는 각각 다른 형식을 사용하여 Major 및 Minor라는 두 클래스의 라인을 그립니다. 이를 통해 레벨의 서로 다른 두 가지 변화 사이의 변화를 동시에 볼 수 있습니다. 알림 이 표시기에는 가격이 구성 가능한 거리 내에 있을 때 메이저, 마이너 또는 두 가격 수준에서 경보를 울리는 기능이 포함됩니다. 자동 설정 기본적으로 지표는 메이저 및 마이너 가격 모두에 대해 적절한 수준을 결정합니다. 언제든지 화면에 표시할 줄 수를 제어하는 구성 가능
ATR Extremes MT5
Robert Gerald Wood
ATR(Average True Range)은 일정 기간 동안 가격 변동량을 측정하는 데 일반적으로 사용되는 지표입니다. 그러나 그것이 제공하는 가치는 어떤 종류의 경계 내에서 정의되지 않으므로 손절매 또는 이익실현 계산 이외의 용도로 사용하는 것은 거의 불가능합니다. 이 지표는 표준 ATR 지표이지만 극단을 볼 수 있도록 백분위수 경계를 도입했습니다. 백분위수와 분할 중앙값이라고 하는 것 중에서 선택할 수 있습니다. 백분위수 수준 백분위수 수준은 1%, 5%, 20%, 50%, 80%, 95%, 99%로 표시되며 다른 모든 값과 관련하여 가격이 어디에 있는지 보여줍니다. 예를 들어, 5% 수준은 선 아래에서 ATR 판독값의 5%만 그만큼 낮아지고 99%는 해당 수준 위의 ATR 값 중 1%만 그만큼 높아진다는 의미입니다. 80% 이상에서는 새로운 거래를 위해 포지션 크기를 낮추기 시작할 수 있으며 95% 이상에서는 모멘텀이 바뀌기 전에 이익을 얻을 수 있는 좋은 시간일 수 있습니다.
필터:
Christian Astillero
1203
Christian Astillero 2022.03.08 14:52 
 

Perfect

Robert Gerald Wood
4302
개발자의 답변 Robert Gerald Wood 2022.04.01 12:01
Thank You!
CasiousD
794
CasiousD 2021.10.30 19:39 
 

2nd indicator I have from this author. Took some getting used to understanding how it interacts with other indicators already on the chart, but once I figured it out (I can be slow sometimes), works perfectly. As with the other indicator I have from this author (Multi Chart Crosshairs), this is going to make my market analysis so much easier! Thank you again!

Payman
663
Payman 2021.04.16 15:05 
 

its really cool because its the only copier that also copies the objects description i found. i wish i could exclude certain objects like buttons and labels. but anyways its already awesome. thanks

Robert Gerald Wood
4302
개발자의 답변 Robert Gerald Wood 2021.04.16 15:08
Hello again Payman, you're now my biggest fan :)
Being able to exclude object of a type is a good idea, definitely adding that to the to-do list for the next version. Thank you!
tr4ppist
97
tr4ppist 2021.04.15 17:41 
 

BEST cloner ever tried, and i have tried a lot of cloners. This clones ALL, perfectly. Download this and don't waste your time on others

Robert Gerald Wood
4302
개발자의 답변 Robert Gerald Wood 2021.04.15 17:43
Thats really kind of you. Thanks for taking the time to leave a review, I appreciate it :).
리뷰 답변
버전 1.2 2022.11.13
Added option to copy Indicator window objects as well as those in the main chart window. Rely's on the second chart already having the Indicators attached, and in the same order as the source chart.

New Option: CopyIndicatorWindowObjects (true/false)

By default the option is set to false, so it will not affect existing users unless they take action and set the option to true.
버전 1.1 2021.04.15
Fixed bug where the text for the first fibo level was not cloned correctly.