Elliot Waves Analyzer Pro
- 지표
- Viktor Weidenthal
- 버전: 1.2
- 업데이트됨: 2 3월 2021
- 활성화: 5
Elliot Waves Analyzer Pro
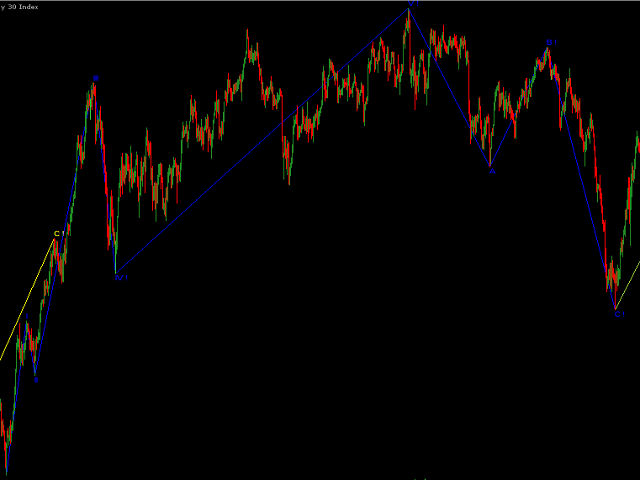
calculates Elliot Waves to Help Identify Trend direction and Entry Levels. Mainly for Swing Trading Strategies.
Usually one would open a Position in trend direction for Wave 3 or a Correction for Wave C .
This Indicator draws Target Levels for the current and next wave. Most important Rules for Elliot Wave Analysis are verified by the Indicator.
The Pro version analyzes Multiple Timeframes and shows the Subwaves and Target-Levels.
For an Overview "Elliot Waves Analyzer" (Non pro) is freely available but shows only One TimePeriod.
If The Analyzer is run first Time on a Chart it can take a long time for first Claculation as it may Require a Download of additional History. In rare cases a Timeout can occur : You need to wait for a new Bar or re-add the Indicator, to get actual Data.
Settings:
Limit MaxBars used for calculation. (default 8000)
Show Wave Data at IndikatorButtons (default: true) shows Buttons at Bottom with Info about current Wave . Hover on the Button to see additional Info about the current Wave. Color changes if TradeZone. Click on Button to Change TimePeriod
RedrawWaves on every Calcevent (default: false) enable only if waves are not shown as expected. May Slowdown the Terminal due to very frequent redrawings.
Additional Feature for Delevopers who want to use this Indicator in a EA:
Custom Event is generated ( ID 100 ) as soon as a Target(Trade)Zone is Entered.
laparm Contains tradeDirection: 1 =Long 2 =Short
dparam Contains WaveNumber (as Integer)
sparam Contains TimeFrame where the Event is generated (as integter)
e.G.: Period_M1 is the Smallest Subwave
Custom Event (ID 101)
if lparam is true this is identified as a NO Trade Zone where Signals in different Timeframes are conflicting.
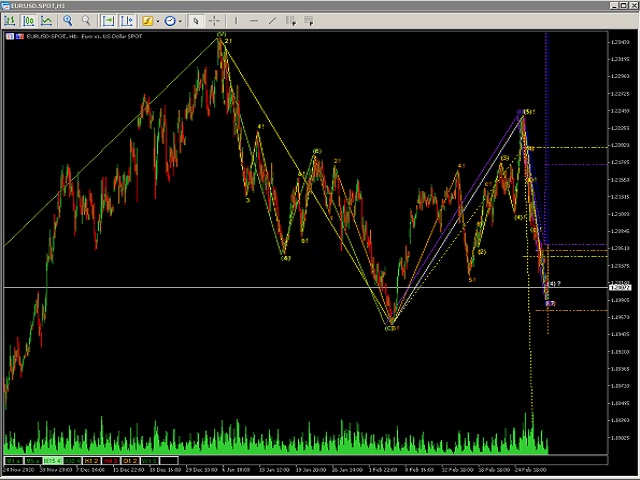


A leading indicator, very accurate for projecting trading zones and trading targets. One needs to focus on the horizontal lines for your preferred timeframe. The author has room to improve on the indicator to colour code minimum and maximum targets and make clear impulsive and corrective price movements.