Winshots ADX Trend
- 지표
- Pawel Michalowski
- 버전: 2.3
- 업데이트됨: 18 3월 2024
- 활성화: 5
Trading in the direction of a strong trend reduces risk and increases profit potential. In general the average directional index (ADX) is used to determine when the price is trending strongly. In many cases, it is the ultimate trend indicator! After all, the trend may be your friend, but it sure helps to know who your friends are.
ADX is used to quantify trend strength. ADX calculations are based on a moving average of price range expansion over a given period of time. The default setting is 14 bars, although other time periods can be used. ADX can be used on any trading instrument such as forex pairs, stocks, mutual funds, exchange-traded funds, futures and crypto.
ADX is plotted as a single line with values ranging from a low of zero to a high of 100. ADX is non-directional; it registers trend strength whether price is trending up or down. The standard ADX indicator is usually plotted in the same window as the two directional movement indicator (DMI) lines, from which ADX is derived.
However when you use the standard ADX indicator it can get a little confusing with all the lines zigzagging and crisscrossing. Not only that, when you switch to different time frames the ADX lines could be crossing in the opposite directions confusing you even more.
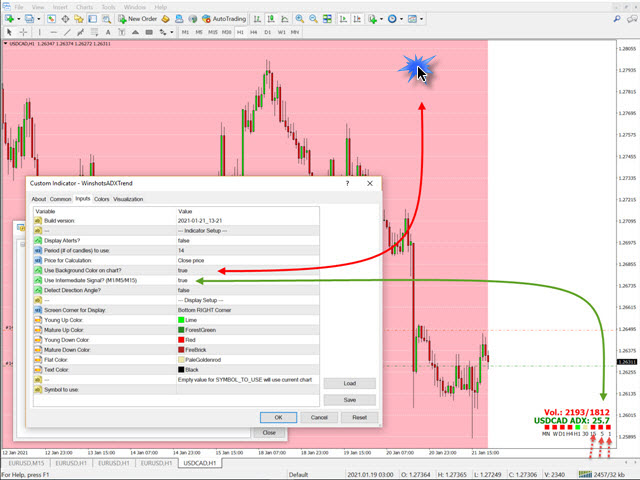
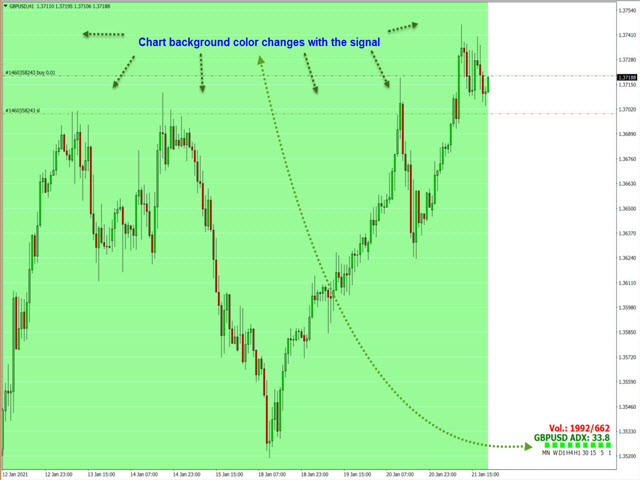
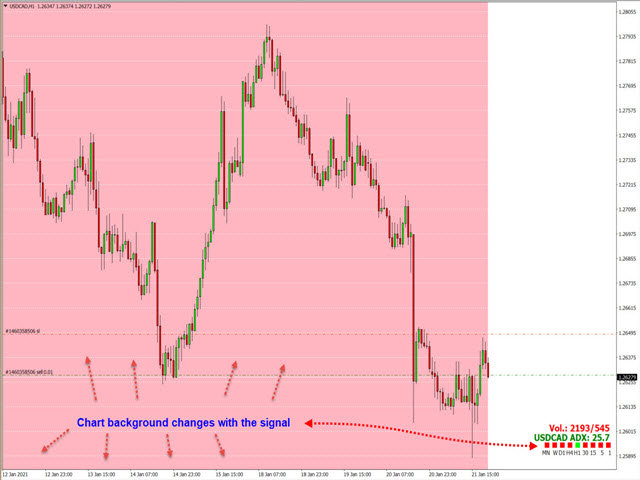
Winshots ADX Trend indicator takes care of this problem. In one simple view you can quickly determine the state of ADX trend on all time frames! Yes you read that correctly. No more clicking through different time frames looking at ADX lines crisscrossing every which way like hot spaghetti. In addition to showing you exactly what the trend is on every time frame the Winshots ADX Trend indicator also shows you current charts volume for the current and previous bar. This additional feature allows you to quickly determine if there is a strong momentum in the market and if it's worth trading during your chosen time.


I would rate 5 stars but it has issues that need to be fixed, such as it spamming a pop alert for the same currency pair 5 or 6 times in less than 1min.it also constantly has repetitive notifications every second, as I close the pop-up notifications and then a few seconds later it appears again.it needs a time delay in minutes between sending each notification.
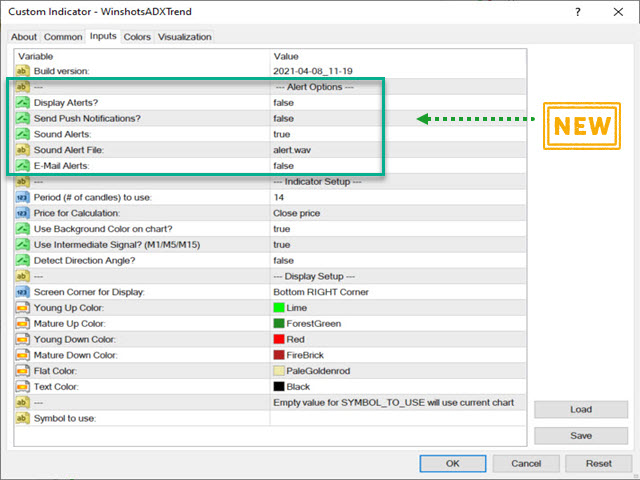
Can you add push notifications?
for the time being, I would not recommend this indicator for $30
4/12/20 Issues where addressed by developer so I update my rating to 5 stars
the only 1 request I have left it to be able to choose which time frames need to all align to get an alert. for example I want to get an alerts when M30 H1 H4 D1 all line up
I will update my review if he fixes these issues