• 미리보기
  • 리뷰 (1)
  • 코멘트 (2)
  • 새 소식

Three Candles Pattern

5

The patterns of 3 (three) Candles:

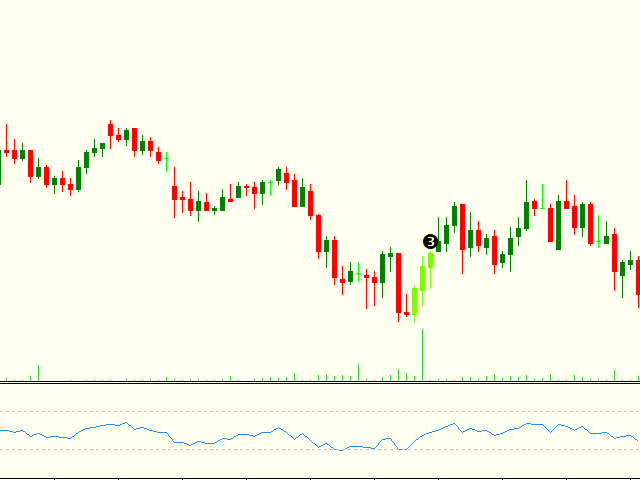
  1. Three White Soldiers;
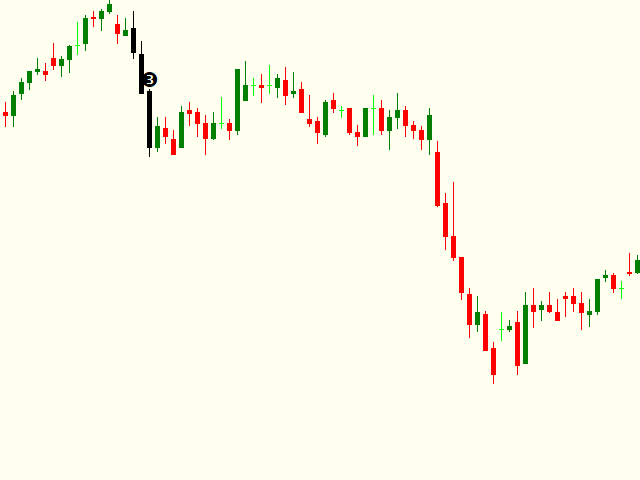
  2. Three Black Crows;

These are reversal patterns widely used by traders, as they have a high probability of showing the inversion of the current market movement.

For example, if in a bullish trend there are three black crows, there is a high probability of reversing the current bullish movement.

The Three White Soldiers have the following characteristics:

  1. There are 3 consecutive candles with a good body, that is, the difference between the closing and opening prices has a value significantly higher than the average;
  2. The closing price of the subsequent candle exceeds the closing price of the previous one;
  3. The opening price of the subsequent candlestick exceeds the opening price of the previous one;
  4. The beginning of the formation of the pattern occurs in a bearish movement.

The Three Black Crows have the following characteristics:

  1. There are 3 consecutive candles with a good body, that is, the difference between the opening and closing prices has a value significantly higher than the average;
  2. The closing price of the subsequent candle is less than the closing price of the previous one;
  3. The opening price of the posterior candle is less than the opening price of the previous one;
  4. The pattern formation begins in an upward movement.
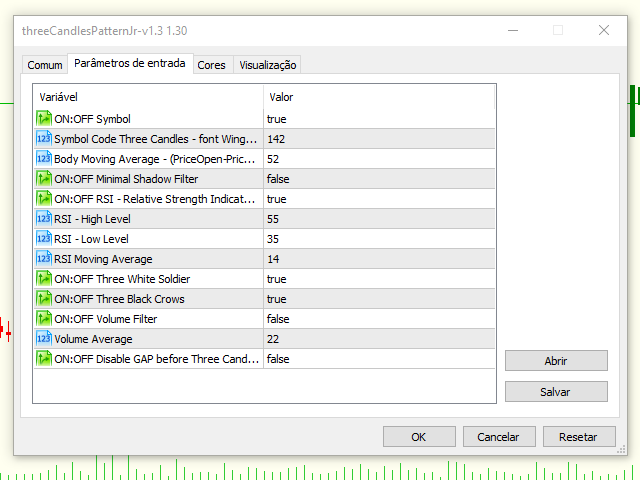
Parameters:

  • Active Symbol ON: OFF: turns the symbol on or off over the standard (Default value: true);
  • 3 Candles symbol code: Wingdings font ASCII code (Default value: 142);
  • Arithmetic Average of the absolute value of the Opening Price - Closing Price (Default Value: 52);
  • Minimum shadows (Default value: false);
  • Active RSI ON: OFF: if enabled, the levels of the relative strength index will be considered for certification of the standard (Default Value: true);
  • Upper RSI indicator level (Default value: 55); 
  • Lower RSI indicator level (Default value: 35);
  • RSI Arithmetic Average (Default Value: 14); 
  • Three White Soldiers active ON: OFF: enables or does not search for the pattern (Default value: true); 
  • Three Black Crows active ON: OFF: enables or does not search for the pattern (Default value: true);
  • Volume Filter ON: OFF: if enabled, the average volume will be considered for standard certification (Default Value: false);
  • Average Volume Period: calculates the average volume of candles prior to the standard. (Default value: 22);
  • Disable Gaps before the Three Candles ON: OFF: if true does not allow gaps before the Three Candles pattern;


Hugs,


Edson Cavalca Junior

System Analyst


리뷰 1
Roman Zakurdaiev
85
Roman Zakurdaiev 2022.03.19 18:42 
 

Great!

추천 제품
Keltner Channels (ou   Canais de Keltner ) é mais um indicador de   volatilidade   utilizado pela   análise técnica. Também chamado de   envelope , esse canal foi criado por Chester Keltner para monitorar os seus investimentos no mercado futuro de café na década de 1960. Porém, com o passar do tempo, passou também a ser utilizado para outros ativos e, atualmente, é uma das ferramentas mais utilizadas pelos traders. Nesta versão customizada foram adicionados novas opções de método de média movel
My PVSR
Ashok Kumar Singha
My PVSR   is based on All Type of Pivot Points. Use this Indicator to get proper Support / Resistance Zone and Trade accordingly.. Recommendation: Use this Indicator along with my another Indicator --->>> Dr. Trend   <<<--- Click Here ; To get the best output result feel free to contact me ; Best of Luck It can be used for: All Pairs: Forex, Cryptocurrencies, Metals, Stocks, Indices etc. All Timeframe All Brokers All type of Trading Style like Scalping, Swing, Intraday, Short-Term, Lon
Fibonacci and RSI Demo version MQL5
Carlos Daniel Vazquez Rosas
4 (1)
Fibonacci and RSI. Demo versión only works with GBPUSD. For full version, please, visit visit https://www.mql5.com/en/market/product/52101 The indicator is a combination of the Fibonacci and RSI indicators. Every time the price touches one of the fibonacci levels and the rsi condition is met, an audible alert and a text alert are generated. Parameters number_of_candles : It is the number of candles that will be calculated. If you put 100, the indicator will give you the maximum and min
FREE
Limitless MT5
Dmitriy Kashevich
Limitless MT5 is a universal indicator suitable for every beginner and experienced trader. works on all currency pairs, cryptocurrencies, raw stocks Limitless MT5 - already configured and does not require additional configuration And now the main thing Why Limitless MT5? 1 complete lack of redrawing 2 two years of testing by the best specialists in trading 3 the accuracy of correct signals exceeds 80% 4 performed well in trading during news releases Trading rules 1 buy signa
VVWAP Bandas
Edipaulo Zanella
Daily VWAP, continues for a period of hours (eg, 10 hours of history), with color to indicate change of direction and bands to map good entry and exit points. The indicator was created to map the center of the market, and find good buying moments, trend analysis or market correction points are easily detected, allowing you to understand moments of exhaustion and buying and selling points Copyright (c) <year> <copyright holders> Permission is hereby granted, free of charge, to any person obtain
Strong Candle2
Roberto Tavares
Strong Candle Indicates the size of each candlestick with the text value above it and indicates which candlestick has a body larger than the one specified in the parameters in percentage, that is, a strong candlestick (between Size_Min and Size_Max) with at least x% of body. The candlestick size is placed in the buffer and that is the buy or sell indication, where: value > 0 = bullish candle or value < 0 bearish candle, value = 0 means no indication (the candle did not match the desired pattern
Fractal Channel Breakout MT5
KEENBASE SOFTWARE SOLUTIONS
KT Fractal Channel Breakout draws a continuous channel by connecting the successive Up and Down fractals. It provides alerts and also plots the Up and Down arrows representing the bullish and bearish breakout of the fractal channel. Features If you use Bill Williams fractals in your technical analysis, you must also include it in your trading arsenal. It can be very effective and useful for stop-loss trailing. A new market trend often emerges after a fractal channel breakout in a new directi
This Indicator adding power to traditional zigzag indicator. With High-Low numbers in vision it will be easier to estimate change of trend by knowing the depth of each wave. Information including points, pips, percentage%, and #bars can be displayed based on configuration. All information is real-time update. This indicator is especially useful in sideway market to buy low sell high.
KT Price Border MT5
KEENBASE SOFTWARE SOLUTIONS
KT Price Border creates a three-band price envelope that identifies potential swing high and low areas in the market. These levels can also be used as dynamic market support and resistance. The mid-band can also be used to identify the trend direction. As a result, it also functions as a trend-following indicator. In addition, its ease of use and more straightforward conveyance of trade signals significantly benefit new traders. Features It works well on most of the Forex currency pairs. It
KT Inside Bar MT5
KEENBASE SOFTWARE SOLUTIONS
KT Inside Bar plots the famous inside bar pattern in which the bar carries a lower high and higher low compared to the previous bar. The last bar is also known as the mother bar. On smaller time-frames, the inside bar sometimes appears similar to a triangle pattern. Features Also plots entry, stop-loss, and take-profit levels with the inside bar pattern. No complex inputs and settings. Erase unwanted levels when the price reaches the entry line in either direction. All Metatrader alerts incl
A useful scanner/dashboard that shows the RSI values for multiple symbols and Time-frames. It can be easily hidden/displayed with a simple click on the scanner man top left of the dashboard. You can input upper and lower RSI values and the colours can be set to show when above/below these values. The default values are 70 and 30. There are also input colours for when the RSI is above or below 50 (but not exceeding the upper/lower levels Symbols and time-frames are input separated by commas.
KT Pin Bar MT5
KEENBASE SOFTWARE SOLUTIONS
KT Pin Bar identifies the pin bar formation which is a type of price action pattern which depicts a sign of reversal or rejection of the trend. When combined with support and resistance, BRN and other significant levels, Pin Bar pattern proved to be a very strong sign of reversal. Basically, a pin bar is characterized by a small body relative to the bar length which is closed either in upper or lower 50% part of its length. They have very large wicks and small candle body. A pin bar candlest
Santo Oscilator
Gustavo Goncalves
5 (1)
Oscilador bem próximo que o indicador SANTO mostrado pelo Bo Williams em sua metodologia PhiCube, para mim este indicador ainda é melhor que o próprio SANTO original. Ótimo para entender a força e tendência de movimentos e possíveis divergências. Preço fazendo topo e o SANTO não renovando máxima, tudo indica que teremos uma reversão ou no mínimo um drawback.
KT Asian Breakout Indicator MT5
KEENBASE SOFTWARE SOLUTIONS
KT Asian Breakout indicator scans and analyzes a critical part of the Asian session to generate bi-directional buy and sell signals with the direction of a price breakout. A buy signal occurs when the price breaks above the session high, and a sell signal occurs when the price breaks below the session low. MT4 Version is available here  https://www.mql5.com/en/market/product/41656 Things to remember If the session box is vertically too wide, a new trade should be avoided as most of the price
KT 4 Timeframe Trend MT5
KEENBASE SOFTWARE SOLUTIONS
The KT 4 Time Frame Trend is an invaluable forex indicator for traders seeking to identify the trend direction across 4-time frames accurately. This innovative indicator allows users to simultaneously observe and analyze price trends across four different timeframes. Whether you're a beginner or an experienced trader, this tool offers an enhanced understanding of trend dynamics, leading to improved trading strategies on your trading platform. The capability to concurrently monitor multiple timef
View Trade Status
Jose Pablo Estrella Mejia
This indicator will help you have a better visualization of the status of your open trades. You can see profits or losses in USD or %, as well as a total of all trades and the percentage of profit or loss according to your account size. You can change the font size and color. I hope you find it useful and it makes monitoring your trades easier.  This indicator adjusts to the size of your screen and will be positioned in the bottom right corner of your screen for better convenience.
AI Binary Sniper
Angelo Capoferri
바이너리 옵션에 대한 가능한 호출 및 입력 항목을 생성하는 인공 지능을 기반으로 하는 표시기입니다. 이 지표는 3가지 다른 전략으로 작동합니다. 1) 거래량을 읽어 가격이 반전되어야 할 때 신호를 보냅니다. 2) 가격과 거래량의 차이를 통해 추세가 지속되거나 반전되어야 할 때 신호를 보냅니다. 3) 가격과 거래량의 수렴을 통해 추세가 계속되어야 할 시점에 신호를 보냅니다. 이 지표는 모든 시간 범위에서 작동하지만 3분 또는 5분 마감일에 가장 좋은 결과를 얻습니다(제도적 공격이 낮은 시간 범위에서 나타나기 때문입니다). 가장 좋은 시간은 유동성이 더 큰 시간, 즉 7 GMT부터 18 GMT까지입니다. 지표는 70% 이상의 정확한 신호를 생성하지만 가격을 조작하거나 서로를 거부하는 기관 간의 싸움에 부딪혀 일련의 잘못된 신호가 생성될 수 있으므로 적절한 자금 관리를 사용하는 것이 좋습니다(예: Masaniello )
대칭 삼각형, 비대칭 삼각형 또는 직각 삼각형과 같은 삼각형 패턴, 상승 쐐기 또는 하강 쐐기와 같은 쐐기 패턴, 확장 패턴 및 추세 채널에 대한 패턴 탐색기 이 지표는 과거의 패턴과 현재의 패턴을 탐색하며, 수동으로 추세선이나 삼각형을 그려 시간을 절약하고 차트에 가장 좋은 패턴을 그리는 자동 분석에 사용하려는 사람들에게 가장 적합한 지표입니다. 특징 : - 최적의 패턴을 조정하고 찾기 위해 즉시 ZigZag 확장 깊이를 변경하는 패널 - 패턴을 지그재그의 이전 막대로 다시 이동하여 과거에 발생한 일을 탐색하고 추세선이 존중되는지 여부를 탐색하고 가격 동작을 이해할 수 있습니다. 이 지표를 사용하여 이전의 과거 패턴을 탐색하고 분석하고 학습하여 마스터 전략을 도출합니다. - 전환 버튼에서 추세 채널 또는 추세선에서 쐐기 또는 삼각형 모드로 즉시 전환 - 패턴이 변경되지 않도록 일시 중지하고 경고에 대한 가격 터치를 계속 확인합니다. - 레벨 터치에 대
Make Sure to Read the Description! UT Bot Plus contains free EA! The EA can be downloaded from telegram channel:  https://t.me/ +NSOJTvH39fNhZmU0 Unlock the Power of Automated Trading with UT BOT Indicator, Integrated with a FREE EA! ( Limited time offer ) This version has been expanded to include multiple additional filtering options. These options are fully configurable and can be switched on and off. This versatile UT BOT indicator is crafted and optimized to work seamlessly with the
This product is designed for the MT5 platform and offers two key features: VWAP (Volume Weighted Average Price) calculation and Volume Profile analysis. Advantages: VWAP Calculation: The product calculates the VWAP, which is a popular indicator used by traders to determine the average price of a security based on its trading volume. It helps identify potential buying or selling opportunities by comparing the current price to the average price weighted by volume. Volume Profile Analysis: The prod
WT Vwap Bands
Ricardo Almeida Branco
The WT Vwap Bands indicator is an indicator that combines price and volume, helping to show whether the price is within the "fair price", overbought or oversold. The indicator code was designed for performance and has already been tested in a real trading account. In addition to the visual inputs (color, thickness and line style), the user can define a% value that depends on the price. The default values work with the most distant band at 1% of the price and then dividing this distan
BB Squeeze MT5
KEENBASE SOFTWARE SOLUTIONS
KT BB Squeeze measures the contraction and expansion of market volatility with a momentum oscillator, which can be used to decide a trading direction. It measures the squeeze in volatility by deducing the relationship between the Bollinger Bands and Keltner channels. Buy Trade: A white dot after the series of gray dots + Rising momentum above the zero line. Sell Trade: A white dot after the series of gray dots + Rising momentum below the zero line.  Markets tend to move from a period of low vol
Rocket Trend
Andriy Sydoruk
The Rocket Trend indicator is trending. The indicator draws two-color points connected by lines along the chart. This is a trend indicator, it is an algorithmic indicator. It is easy to work and understand when a blue circle appears, you need to buy, when a red one appears, sell. The indicator is used for scalping and pipsing, and has proven itself well. Rocket Trend is available for analyzing the direction of the trend for a specific period of time. Ideal for novice traders learning the laws o
ACB Breakout Arrows Scanner MT5
KEENBASE SOFTWARE SOLUTIONS
It's a multi-symbol and multi-timeframe scanner for our indicator - ACB Breakout Arrows . With default settings, it scans for the buy/sell signals on 28 currency pairs and 9 time-frames concurrently.   Features It can scan 252* combinations of symbols and time-frames from a single chart. Open the signal's chart loaded with a predefined template with a single click.  Easy drag n drop anywhere on the chart. Real-time alerts with popup, sound, push-notifications and email alerts.  Input Para
This multi time frame and multi symbol indicator identifies high-probability breakout patterns. It does this by identifying strong, symmetrical pennants and triangles. This pattern  DOES NOT  appear very often on higher timeframes. But when it does, it is a very high-probability setup. The indicator also includes an Inside bars scanner. It can for example be used to detect a special type of Inside bars formation which is formed by a Master candle (MC) followed by 4 inside candles (please see the
Hello There, i introduce about Swing Premium Forex Mt5 Indicator it work all currency pair it work all time frame, 100% non repaint, no delay Swing trading is a method in which traders attempt to take advantage of market fluctuations. They buy a security when they believe the market will rise and sell if they feel the market will fall, which, as you can imagine, is common in most trading strategies, irrespective of trading style. The four most frequently occurring patterns in the swing t
The indicator determines the state of the market: trend or flat. The state of the market is determined by taking into account volatility. The flat (trading corridor)is displayed in yellow. The green color shows the upward trend. The red color shows the downward trend. The height of the label corresponds to the volatility in the market. The indicator does not redraw . Settings History_Size   - the amount of history for calculation. Period_Candles  - the number of candles to calculate the
--- StudentK RVI --- 1. Advanced strategy based on RVI 2. EA adapted (especially for StudentK's EA) --- Context --- StudentK is not indicated as a master or K Sir for knowledgeable person who claims for winning all the time. (But lots of traders should know the fact that it is rarely truth, especially in fluctuated period of time) StudentK is a group of years-experienced traders who want to share amazing tools in Free and Paid versions. Aiming helping people getting out of "The Rat Race" by
Welcome to advanced trading with the ADX Multicurrency Scanner for MT5! Elevate your trading experience with our powerful MT5 indicator, meticulously designed to offer seamless currency scanning and real-time insights. Key Features: Effortless Multicurrency Scanning: Unlock the full potential of the ADX Multicurrency Scanner for MT5 by effortlessly scanning multiple currencies. Receive instant alerts when specific conditions are met, ensuring you stay ahead of the market and capitalize on every
Extremum levels
VLADISLAV AKINDINOV
이 지표는 전일, 주, 월의 최고 및 최저 가격을 보여줍니다. 극한 지점의 돌파를 식별하고 거래 진입 방향을 결정하도록 설계되었습니다. 반전 수준을 보다 정확하게 결정하기 위해 피보나치 수준을 표시할 수 있습니다. 또한 이전 청구 기간 동안의 가격 변동을 보다 명확하게 보여주기 위해 최고 가격과 최저 가격 사이의 공간에 표시할 수도 있습니다. 현재 캔들(바)이 닫힐 때까지의 시간을 나타냅니다. 버전 2.0에는 3가지 새로운 지그재그 반전 신호 레벨이 추가되었으며 각 레벨에 대한 경보를 제공합니다. This indicator shows the maximum and minimum prices of the previous day, week and month. Designed to identify breakouts of extreme points and determine the direction of entry into a trade. To more accurately determin
이 제품의 구매자들이 또한 구매함
우선 이 거래 시스템이 리페인팅, 리드로잉 및 레이그 인디케이터가 아니라는 점을 강조하는 것이 중요합니다. 이는 수동 및 로봇 거래 모두에 이상적인 것으로 만듭니다. "스마트 트렌드 트레이딩 시스템 MT5"은 새로운 및 경험이 풍부한 트레이더를 위해 맞춤형으로 제작된 종합적인 거래 솔루션입니다. 10개 이상의 프리미엄 인디케이터를 결합하고 7개 이상의 견고한 거래 전략을 특징으로 하여 다양한 시장 조건에 대한 다목적 선택이 가능합니다. 트렌드 추종 전략: 효과적인 트렌드 추이를 타기 위한 정확한 진입 및 손절 관리를 제공합니다. 반전 전략: 잠재적인 트렌드 반전을 식별하여 트레이더가 범위 시장을 활용할 수 있게 합니다. 스캘핑 전략: 빠르고 정확한 데이 트레이딩 및 단기 거래를 위해 설계되었습니다. 안정성: 모든 인디케이터가 리페인팅, 리드로잉 및 레이그가 아니므로 신뢰할 수 있는 신호를 보장합니다. 맞춤화: 개별 거래 선호도를 고려한 맞춤형 전략을 지원합니다. 최상의 전략을 찾는
Atomic Analyst MT5
Issam Kassas
3.64 (11)
우선적으로 언급할 점은이 거래 지표가 다시 그리지 않고 지연되지 않으며 이를 통해 수동 및 로봇 거래 모두에 이상적이라는 점입니다. Atomic Analyst는 가격의 강도와 모멘텀을 활용하여 시장에서 더 나은 이점을 찾는 PA Price Action Indicator입니다. 고급 필터를 장착하여 잡음과 거짓 신호를 제거하고 거래 잠재력을 높이는 데 도움이 됩니다. 복잡한 지표의 다중 레이어를 사용하여 Atomic Analyst는 차트를 스캔하고 복잡한 수학적 계산을 간단한 신호와 색상으로 변환하여 초보 트레이더가 이해하고 일관된 거래 결정을 내릴 수 있도록합니다. "Atomic Analyst"는 새로운 및 경험이 풍부한 트레이더를위한 종합적인 거래 솔루션입니다. 프리미엄 지표와 최고 수준의 기능을 하나의 거래 전략에 결합하여 모든 종류의 트레이더에 대한 다재다능한 선택지가되었습니다. 인트라데이 거래 및 스캘핑 전략 : 빠르고 정확한 일일 거래 및 단기 거래를 위해 설계
Quantum Trend Sniper
Bogdan Ion Puscasu
5 (37)
소개       Quantum Trend Sniper Indicator는   추세 반전을 식별하고 거래하는 방식을 변화시키는 획기적인 MQL5 지표입니다! 13년 이상의 거래 경험을 가진 숙련된 트레이더 팀이 개발한       Quantum Trend Sniper 표시기       매우 높은 정확도로 추세 반전을 식별하는 혁신적인 방법으로 거래 여정을 새로운 차원으로 끌어올리도록 설계되었습니다. ***Quantum Trend Sniper Indicator를 구입하면 Quantum Breakout Indicator를 무료로 받을 수 있습니다!*** Quantum Trend Sniper Indicator는 추세 반전을 식별하고 세 가지 이익실현 수준을 제안할 때 경고, 신호 화살표를 제공합니다. 초보자 거래자와 전문 거래자 모두에게 적합합니다. Quantum EA 채널:       여기를 클릭하세요 MT4 버전:       여기를 클릭하세요
FX Volume MT5
Daniel Stein
4.94 (17)
모닝 브리핑을 통해 세부 정보와 스크린샷으로 매일 시장 업데이트를 받으세요 여기 mql5 및 텔레그램에서 FX 거래량은 브로커의 관점에서 시장 심리에 대한 실제 통찰력을 제공하는 최초이자 유일한 거래량 지표입니다. 브로커와 같은 기관 시장 참여자가 외환 시장에서 어떤 포지션을 취하고 있는지에 대한 훌륭한 통찰력을 COT 보고서보다 훨씬 빠르게 제공합니다. 차트에서 이 정보를 직접 확인하는 것은 트레이딩의 진정한 판도를 바꾸고 획기적인 솔루션입니다. 다음과 같은 고유한 시장 데이터 인사이트의 이점 비율 는 통화의 매수/매도 포지션 비율을 백분율로 표시 비율 변화 는 선택한 기간 내 매수 비율과 비율 변화를 표시 총 거래량 는 해당 통화의 총 거래량(롱 및 숏)을 로트 단위로 보여줍니다 Volumes Long 는 해당 통화의 모든 롱 포지션의 거래량을 보여줍니다 Volumes Short 는 해당 통화의 모든 숏 포지션의 거래량을 보여줍니다 Net Long 는 순 롱 포지션의 거래량
Trend Screener Pro MT5
STE S.S.COMPANY
4.89 (61)
트렌드 표시기, 트렌드 트레이딩 및 필터링을 위한 획기적인 고유 솔루션, 하나의 도구 안에 내장된 모든 중요한 트렌드 기능! Forex, 상품, 암호 화폐, 지수 및 주식과 같은 모든 기호/도구에 사용할 수 있는 100% 다시 칠하지 않는 다중 시간 프레임 및 다중 통화 표시기입니다. Trend Screener는 차트에 점이 있는 화살표 추세 신호를 제공하는 효율적인 지표 추세 추종 지표입니다. 추세 분석기 표시기에서 사용할 수 있는 기능: 1. 트렌드 스캐너. 2. 최대 이익 분석이 있는 추세선. 3. 추세 통화 강도 측정기. 4. 경고가 있는 추세 반전 점. 5. 경고가 있는 강력한 추세 점. 6. 추세 화살표 Trend Screener Indicator가 있는 일일 분석 예, 일일 신호 성능...등은 여기에서 찾을 수 있습니다. 여기를 클릭하십시오. LIMITED TIME OFFER : Trend Screener Indicator는 50$ 및 평생 동안만 사용할 수 있습니다
우선적으로, 이 거래 도구는 전문적인 거래에 이상적인 비-다시 그리기 및 지연되지 않는 지표입니다.  스마트 가격 액션 컨셉트 인디케이터는 신규 및 경험 많은 트레이더 모두에게 매우 강력한 도구입니다. Inner Circle Trader Analysis 및 Smart Money Concepts Trading Strategies와 같은 고급 거래 아이디어를 결합하여 20가지 이상의 유용한 지표를 하나로 결합합니다. 이 인디케이터는 스마트 머니 컨셉트에 중점을 두어 대형 기관의 거래 방식을 제공하고 이동을 예측하는 데 도움을 줍니다.  특히 유동성 분석에 뛰어나 기관이 어떻게 거래하는지 이해하는 데 도움을 줍니다. 시장 트렌드를 예측하고 가격 변동을 신중하게 분석하는 데 탁월합니다. 귀하의 거래를 기관 전략에 맞추어 시장의 동향에 대해 더 정확한 예측을 할 수 있습니다. 이 인디케이터는 시장 구조를 분석하고 중요한 주문 블록을 식별하고 다양한 패턴을 인식하는 데 뛰어납니다. 
FX Power MT5 NG
Daniel Stein
5 (4)
모닝 브리핑 여기 mql5 와 텔레그램에서 FX Power MT5 NG 는 오랫동안 인기 있는 통화 강도 측정기인 FX Power의 차세대 버전입니다. 이 차세대 강도 측정기는 무엇을 제공합니까? 기존 FX Power에서 좋아했던 모든 것 PLUS GOLD/XAU 강도 분석 더욱 정밀한 계산 결과 개별 구성 가능한 분석 기간 더 나은 성능을 위한 사용자 정의 가능한 계산 한도 특별 멀티더 많은 것을보고 싶은 사람들을위한 특별한 다중 인스턴스 설정 모든 차트에서 좋아하는 색상을위한 끝없는 그래픽 설정 수많은 알림 옵션, 중요한 것을 다시는 놓치지 않도록 Windows 11 및 macOS 스타일의 둥근 모서리가 있는 새로운 디자인 마법처럼 움직이는 인디케이터 패널 FX 파워 키 특징 모든 주요 통화의 완전한 강세 이력 모든 시간대에 걸친 통화 강세 이력 모든 브로커 및 차트에서 고유 계산 결과 100% 신뢰할 수있는 실시간100 % 신뢰할 수있는 실시간 계산-> 다시 칠하지 않음
Advanced Supply Demand MT5
Bernhard Schweigert
4.53 (15)
현재 33% 할인! 초보자나 전문 트레이더를 위한 최고의 솔루션! 이 보조지표는 우리가 다수의 독창적 기능과 새로운 공식을 통합한 독특하고 고품질이며 저렴한 거래 도구입니다. 이 업데이트를 통해 이중 시간대를 표시할 수 있습니다. 더 높은 TF를 표시할 수 있을 뿐만 아니라 차트 TF와 더 높은 TF 모두를 표시할 수 있습니다: 중첩 영역 표시. 모든 Supply Demand 트레이더들이 좋아할 것입니다. :) 중요한 정보 공개 Advanced Supply Demand의 잠재력을 극대화하려면 다음을 방문하십시오. https://www.mql5.com/ko/blogs/post/720245   진입 또는 목표의 명확한 트리거 포인트를 정확히 찾아냄으로 해서 거래가 어떻게 개선될지 상상해 보십시오. 새로운 알고리즘을 기반으로 매수자와 매도자 간의 잠재적인 불균형을 훨씬 더 쉽게 분간할 수 있습니다. 왜냐하면 가장 강한 공급영역과 가장 강한 수요 영역과 과거에 어떻게 진행 되었는지를(이
RelicusRoad Pro MT5
Relicus LLC
4.82 (22)
이제 $ 147 (몇 가지 업데이트 후 $ 499 증가) - 무제한 계정 (PCS 또는 MACS) RelicusRoad 사용 설명서 + 교육 비디오 + 비공개 Discord 그룹 액세스 + VIP 상태 시장을 보는 새로운 방법 RelicusRoad는 외환, 선물, 암호화폐, 주식 및 지수에 대한 세계에서 가장 강력한 거래 지표로서 거래자에게 수익성을 유지하는 데 필요한 모든 정보와 도구를 제공합니다. 우리는 초보자부터 고급까지 모든 거래자가 성공할 수 있도록 기술적 분석 및 거래 계획을 제공합니다. 미래 시장을 예측할 수 있는 충분한 정보를 제공하는 핵심 거래 지표입니다. 우리는 차트에서 말이 안 되는 여러 지표 대신 완전한 솔루션을 믿습니다. 타의 추종을 불허하는 매우 정확한 신호, 화살표 + 가격 조치 정보를 표시하는 올인원 표시기입니다. 강력한 AI를 기반으로 하는 RelicusRoad는 누락된 정보와 도구를 제공하여 교육하고 성공적인 트레이더인 트레이딩 전문
XQ Indicator MetaTrader 5
Marzena Maria Szmit
5 (1)
Step into the realm of Forex trading with confidence and precision using XQ, a cutting-edge Forex indicator designed to elevate your trading game to unprecedented heights. Whether you're a seasoned trader or just stepping into the world of currency exchange, XQ Forex Indicator empowers you with the insights and signals needed to make informed trading decisions. The signal conditions are a combination of three indicators, and XQ Forex Indicator only display  medium and long-term trends . The ind
Volume by Price MT5
Brian Collard
5 (3)
The Volume by Price Indicator for MetaTrader 5 features Volume Profile and Market Profile TPO (Time Price Opportunity). Get valuable insights out of currencies, equities and commodities data. Gain an edge trading financial markets. Volume and TPO histogram bar and line charts. Volume Footprint charts. TPO letter and block marker charts including split structures. Versatile segmentation and compositing methods. Static, dynamic and flexible ranges with relative and/or absolute visualizations. Lay
Auto Order Block with break of structure based on ICT and Smart Money Concepts Futures Break of Structure ( BoS )             Order block ( OB )            Higher time frame Order block / Point of Interest ( POI )    shown on current chart           Fair value Gap ( FVG ) / Imbalance   ,  MTF      ( Multi Time Frame )    Volume Imbalance     ,  MTF          vIMB Gap’s Equal High / Low’s     ,  MTF             EQH / EQL Liquidity               Current Day High / Low           HOD /
Entry Points Pro for MT5
Yury Orlov
4.54 (157)
다시 색을 칠하지 않고 거래에 진입할 수 있는 정확한 신호를 제공하는 MT5용 지표입니다. 외환, 암호화폐, 금속, 주식, 지수 등 모든 금융 자산에 적용할 수 있습니다. 매우 정확한 추정값을 제공하고 매수와 매도의 가장 좋은 시점을 알려줍니다. 하나의 시그널로 수익을 내는 지표의 예와 함께 비디오 (6:22)시청하십시오! 대부분의 거래자는 Entry Points Pro 지표의 도움으로 첫 거래 주 동안 트레이딩 결과를 개선합니다. 저희의   Telegram Group 을 구독하세요! Entry Points Pro 지표의 좋은점. 재도색이 없는 진입 신호 신호가 나타나고 확인되면(시그널 캔들이 완성된 경우) 신호는 더 이상 사라지지 않습니다. 여타 보조지표의 경우 신호를 표시한 다음 제거되기 때문에 큰 재정적 손실로 이어집니다. 오류 없는 거래 게시 알고리즘을 통해 트레이드(진입 또는 청산)를 할 이상적인 순간을 찾을 수 있으며, 이를 통해 이를 사용하는 모든 거래자의
ICT, SMC, SMART MONEY CONCEPTS, SMART MONEY, Smart Money Concept, Support and Resistance, Trend Analysis, Price Action, Market Structure, Order Blocks, BOS/CHoCH,   Breaker Blocks ,  Momentum Shift,   Supply&Demand Zone/Order Blocks , Strong Imbalance,   HH/LL/HL/LH,    Fair Value Gap, FVG,  Premium  &   Discount   Zones, Fibonacci Retracement, OTE, Buy Side Liquidity, Sell Side Liquidity, BSL/SSL Taken, Equal Highs & Lows, MTF Dashboard, Multiple Time Frame, BigBar, HTF OB, HTF Market Structure
가격이 역전되고 후퇴함에 따라 시장 구조가 변경됩니다. 시장 구조 반전 경고 표시기는 추세 또는 가격 움직임이 고갈에 가까워지고 반전할 준비가 되었음을 식별합니다. 일반적으로 반전이나 큰 하락이 일어나려고 할 때 발생하는 시장 구조의 변화를 알려줍니다. 지표는 가능한 고갈 지점 근처에서 새로운 고점 또는 저점이 형성될 때마다 초기에 돌파와 가격 모멘텀을 식별합니다. 표시기는 반대쪽에 있는 마지막 촛불에 직사각형을 그립니다. 그런 다음 현재의 단기 추세에서 계속 움직이기 때문에 가격과 함께 직사각형을 따라갈 것입니다. 가격이 사각형 위나 아래로 다시 닫힐 정도로 약해지면 시장 구조에 잠재적인 변화가 일어나고 있음을 나타냅니다. 그런 다음 표시기는 방향의 잠재적인 이동과 추세 또는 주요 하락의 가능한 반전 시작에 대해 경고합니다. 작동 방식을 보려면 아래의 작동 표시기를 참조하십시오! 모든 쌍 및 주요 기간을 모니터링하는 대시보드: https://www.mql5.com/
Blahtech Supply Demand MT5
Blahtech Limited
4.57 (14)
Was: $299  Now: $99   Supply Demand uses previous price action to identify potential imbalances between buyers and sellers. The key is to identify the better odds zones, not just the untouched ones. Blahtech Supply Demand indicator delivers functionality previously unavailable on any trading platform. This 4-in-1 indicator not only highlights the higher probability zones using a multi-criteria strength engine, but also combines it with multi-timeframe trend analysis, previously confirmed swings
ON Trade Gann Squares MT5
Abdullah Alrai
5 (1)
간 스퀘어 지표는 W.D. 간이 쓴 "시장 예측을 위한 수학적 공식" 기사에 기반한 강력한 시장 분석 도구입니다. 이 도구는 수학적 개념과 간 이론을 사용하여 정확한 시장 분석을 수행합니다. 144, 90, 52의 제곱과 9의 제곱을 사용합니다. 또한 의 9의 제곱근 및 해당 제곱의 채널 및 스타 패턴과의 관련성을 통합합니다. 사용자 메뉴얼 및 적용: 이 지표를 사용하기 전에 사용자 메뉴얼을 읽고 질문이 있을 경우 문의하시기 바랍니다. 전체 메뉴얼은 웹사이트에서 제공됩니다. MT5의 전체 버전을 구매하거나 MT4의 무료 버전을 테스트할 수 있습니다. 두 버전 모두 링크에서 확인하실 수 있습니다. 주요 기능 및 기능: 간 스퀘어 지표는 정확한 결정을 위해 기하학적 개념과 간 이론을 활용하는 시장 분석을 위한 포괄적인 도구 집합을 제공합니다. 주요 기능은 다음과 같습니다. 9의 제곱 분석:   이 지표는 9의 제곱에 대한 수평 선, 스타 패턴, 그리드 및 간 팬을 그릴 수 있습니다. 간
Trend Line Map Pro MT5
STE S.S.COMPANY
4.67 (9)
트렌드 라인 맵 표시기는 트렌드 스크리너 표시기의 애드온입니다. Trend screener(Trend Line Signals)에 의해 생성된 모든 신호에 대한 스캐너로 작동합니다. Trend Screener Indicator 기반의 Trend Line Scanner입니다. Trend Screener Pro 표시기가 없으면 Trend Line Map Pro가 작동하지 않습니다. It's a Trend Line Scanner based on Trend Screener Indicator. If you don't have Trend Screener Pro Indicator,     the Trend Line Map Pro will not work . MQL5 블로그에 액세스하여 추세선 지도 표시기의 무료 버전을 다운로드할 수 있습니다. Metatrader Tester 제한 없이 구매하기 전에 사용해 보십시오. : 여기를 클릭하세요 1. 쉽게 얻을 수 있는 이점 통화 및
TrendLine PRO MT5
Evgenii Aksenov
4.78 (49)
The Trend Line PRO indicator is an independent trading strategy. It shows the trend change, the entry point to the transaction, as well as automatically calculates three levels of Take Profit and Stop Loss protection Trend Line PRO is perfect for all Meta Trader symbols: currencies, metals, cryptocurrencies, stocks and indices Advantages of Trend Line PRO Never redraws its signals The possibility of using it as an independent strategy It has three automatic levels Take Profit and Stop Loss lev
소개       Quantum Breakout PRO   , 브레이크아웃 존 거래 방식을 변화시키는 획기적인 MQL5 지표! 13년 이상의 거래 경험을 가진 숙련된 트레이더 팀이 개발한       퀀텀 브레이크아웃 PRO       혁신적이고 역동적인 브레이크아웃 존 전략으로 거래 여정을 새로운 차원으로 끌어올리도록 설계되었습니다. Quantum Breakout Indicator는 5개의 이익 목표 영역이 있는 브레이크아웃 영역의 신호 화살표와 브레이크아웃 상자를 기반으로 한 손절 제안을 제공합니다. 초보자 거래자와 전문 거래자 모두에게 적합합니다. Quantum EA 채널:       여기를 클릭하세요 중요한! 구매 후 설치 매뉴얼을 받으려면 개인 메시지를 보내주십시오. 추천: 기간: M15 통화쌍: GBPJPY, EURJPY, USDJPY,NZDUSD, XAUUSD 계정 유형: 스프레드가 매우 낮은 ECN, Raw 또는 Razor 브로커 시간: GM
Owl Smart Levels MT5
Sergey Ermolov
4.47 (36)
MT4 버전  |  FAQ Owl Smart Levels Indicator 는 Bill Williams 의 고급 프랙탈, 시장의 올바른 파동 구조를 구축하는 Valable ZigZag, 정확한 진입 수준을 표시하는 피보나치 수준과 같은 인기 있는 시장 분석 도구를 포함하는 하나의 지표 내에서 완전한 거래 시스템입니다. 시장과 이익을 취하는 장소로. 전략에 대한 자세한 설명 표시기 작업에 대한 지침 고문-거래 올빼미 도우미의 조수 개인 사용자 채팅 ->구입 후 나에게 쓰기,나는 개인 채팅에 당신을 추가하고 거기에 모든 보너스를 다운로드 할 수 있습니다 힘은 단순함에 있습니다! Owl Smart Levels 거래 시스템은 사용하기 매우 쉽기 때문에 전문가와 이제 막 시장을 연구하고 스스로 거래 전략을 선택하기 시작한 사람들 모두에게 적합합니다. 전략 및 지표에는 눈에 보이지 않는 비밀 공식 및 계산 방법이 없으며 모든 전략 지표는 공개되어 있습니다. Owl Smart Levels를
AW Trend Predictor MT5
AW Trading Software Limited
4.76 (54)
하나의 시스템에서 추세와 고장 수준의 조합입니다. 고급 지표 알고리즘은 시장 노이즈를 필터링하고 추세, 진입점 및 가능한 출구 수준을 결정합니다. 표시기 신호는 통계 모듈에 기록되어 가장 적합한 도구를 선택하여 신호 기록의 효율성을 보여줍니다. 이 표시기는 이익 실현 및 손절매 표시를 계산합니다. 매뉴얼 및 지침 ->   HERE   / MT4 버전 ->   HERE 지표로 거래하는 방법: Trend Predictor로 거래하는 것은 3단계로 간단합니다. 1단계 - 포지션 열기 70% 이상의 성공률로 매수 신호를 받았습니다. 2단계 - StopLoss 결정 반대 신호로 트렁크 선택 3단계 - 이익 실현 전략 정의 전략 1: TP1 도달 시 전체 포지션 청산 전략 2: TP1 도달 시 포지션의 50% 청산 및 TP2 도달 시 나머지 50% 청산 전략 3: 추세 반전 시 전체 포지션 청산 이익: 결과를 다시 그리지 않음, 신호는 엄격하게 양초가 닫힐 때 어드바이저에서 사용할 수 있습니
Gartley Hunter Multi
Siarhei Vashchylka
5 (5)
Gartley Hunter Multi - An indicator for searching for harmonic patterns simultaneously on dozens of trading instruments and on all classic timeframes: (m1, m5, m15, m30, H1, H4, D1, Wk, Mn). Manual (Be sure to read before purchasing) | Version for MT4 Advantages 1. Patterns: Gartley, Butterfly, Shark, Crab. Bat, Alternate Bat, Deep Crab, Cypher 2. Simultaneous search for patterns on dozens of trading instruments and on all classic timeframes 3. Search for patterns of all possible sizes. Fr
Blahtech Market Profile MT5
Blahtech Limited
5 (8)
Was: $249  Now: $99   Market Profile defines a number of day types that can help the trader to determine market behaviour. A key feature is the Value Area, representing the range of price action where 70% of trading took place. Understanding the Value Area can give traders valuable insight into market direction and establish the higher odds trade. It is an excellent addition to any system you may be using. Inspired by Jim Dalton’s book “Mind Over Markets”, this indicator is designed to suit the
TPSproTREND PrO MT5
Roman Podpora
5 (5)
TPSpro TRENDPRO  - is a trend indicator that automatically analyzes the market and provides information about the trend and each of its changes, as well as giving signals for entering trades without redrawing! The indicator uses each candle, analyzing them separately. referring to different impulses - up or down impulse. Exact entry points into transactions for currencies, crypto, metals, stocks, indices!  -  Version MT4                  DETAILED DESCRIPTION        /       TRADING SETUPS       
Golden Spikes Detector
Batsirayi L Marango
5 (1)
Golden Spikes Detector This indicator is based on an advanced strategy primarily for trading spikes on Boom and Crash Indices. Complex algorithms were implemented to detect high probability entries only. It alerts on potential Buy and Sell entries. To trade spikes on the Deriv or Binary broker, only take Buy Boom and Sell Cash alerts. It was optimised to be loaded on 5-minute timeframe although multiple timeframe analysis is done in the background. Features ·             Desktop pop up and sound
Matrix Arrow Indicator MT5
Juvenille Emperor Limited
5 (14)
매트릭스 화살표 표시기 MT5 는 외환, 상품, 암호 화폐, 지수, 주식과 같은 모든 기호/도구에 사용할 수 있는 100% 다시 칠하지 않는 다중 기간 표시기를 따르는 고유한 10 in 1 추세입니다.  Matrix Arrow Indicator MT5 는 다음과 같은 최대 10개의 표준 지표에서 정보와 데이터를 수집하여 초기 단계에서 현재 추세를 결정합니다. 평균 방향 이동 지수(ADX) 상품 채널 지수(CCI) 클래식 하이켄 아시 캔들 이동 평균 이동 평균 수렴 발산(MACD) 상대 활력 지수(RVI) 상대 강도 지수(RSI) 포물선 SAR 스토캐스틱 오실레이터 윌리엄스의 백분율 범위 모든 지표가 유효한 매수 또는 매도 신호를 제공하면 강력한 상승/하락 추세를 나타내는 다음 캔들/막대가 시작될 때 해당 화살표가 차트에 인쇄됩니다. 사용자는 사용할 표시기를 선택하고 각 표시기의 매개변수를 개별적으로 조정할 수 있습니다. 매트릭스 화살표 표시기 MT5는 선택한 표시기에서만 정보를 수
IX Power MT5
Daniel Stein
5 (2)
IX Power는   마침내 FX Power의 탁월한 정밀도를 외환이 아닌 기호에도 적용했습니다. 좋아하는 지수, 주식, 원자재, ETF, 심지어 암호화폐까지 단기, 중기, 장기 추세의 강도를 정확하게 파악할 수 있습니다. 단말기가 제공하는   모든 것을 분석할   수 있습니다. 사용해 보고 트레이딩   타이밍이 크게 향상되는   것을 경험해 보세요. IX Power 주요 특징 단말기에서 사용 가능한 모든 거래 심볼에 대해 100% 정확한 비재도장 계산 결과 제공 사전 구성 및 추가적으로 개별 구성 가능한 강도 분석 기간의 드롭다운 선택 가능 이메일, 메시지, 모바일 알림을 통한 다양한 알림 옵션 제공 EA 요청을 위한 액세스 가능한 버퍼 더 나은 성능을 위한 사용자 지정 가능한 계산 한도 더 많은 것을 보고 싶은 사용자를 위한 특별 다중 인스턴스 설정 모든 차트에서 좋아하는 색상을 위한 무한한 그래픽 설정 가능 Windows 11 및 macOS 스타일의 둥
Account Graph MT5
Kyra Nickaline Watson-gordon
5 (1)
An indicator to draw a graph of account current and historical state such as Balance, Equity, Margin, Free Margin, Margin Level, Drawdown, Account Profit, Deposit and Withdrawals. Indicator Inputs : Draw Balance Graph Draw Equity Graph Draw Margin Graph Draw Free Margin Graph Draw Margin Level Graph Draw Drawdown Graph Draw Account Profit Graph Hide Data on Chart and Buffers Connect Gaps by Lines Sign of DDs on Profit Sign of DDs on Loss Tips : The Indicator will draw historical balance gra
Smart Peak Bottom
Xiaoyu Huang
5 (2)
이것은 고점과 저점을 판단하기 위한 명확한 지표이며 진동 시장에 적합합니다. 프로모션 가격 49$ → 59$ 특징 상의와 하의를 잘 판단한다 다시 그리기 없음, 드리프트 없음 빠른 계산, 지연 없음 풍부한 알림 모드 여러 매개 변수 및 색상을 조정할 수 있습니다. 매개변수 "======== 메인 ========" HighLowPeriod1 = 9 HighLowPeriod2 = 60 HighLowPeriod3 = 34 HighLowEMAPeriod = 4 MASignalPeriod = 5 "======== 알림 ========" UseAlertNotify = 참; UseMetaQuotesIDNotify = 참; UseMailNotify = 참; NotifySignalMode = 색상 변경 및 레벨 확인; 하이레벨 = 80; 저수준 = 20; NofityPreMessage = "스마트 피크 바닥"; EA 통화의 경우 0. 높은 버퍼 1.낮은 버퍼 2. 방향 버퍼 1 up
제작자의 제품 더 보기
Aggression Volume Profile
Edson Cavalca Junior
4.4 (5)
This indicator plots the volume profile by Price on the chart There are 5 ways to view it: By Total Volume Traded; Volume Ticks(Forex) Separated by Buyers and Sellers; Buyers Only; Sellers Only and; Business balance (Buyers - Sellers). It is possible to select how many days the profiles will be calculated. On the current day it recalculates the histogram data for each new candlestick. Another feature is to select the highest trading range by entering the desired percentage. Th
FREE
Forca Relativa
Edson Cavalca Junior
5 (6)
The robot issues buy/sell signals based on the setting of the RELATIVE STRENGTH INDICATOR Know our products    Review and get a month's rental on any of our paid robots.  This Expert Advisor (EA) works on HEDGE (Forex, etc.) and NETTING (Bovespa, etc.) accounts, but manages only one position at a time. The  filters  are used to increase the accuracy  and if activated and not met your criteria, the order is not sent. 5 FILTERS available: ADX indicator; ADX + (DM +) and - (DM-) direction
FREE
This indicator plots in the candles the divergence found in the selected indicator and can also send a notification by email and / or to the cell phone. Works on all TIMEFRAMES. Meet Our Products   He identifies the divergences in the indicators: Relative Strength Index (RSI); Moving Average Convergence and Divergence (MACD); Volume Balance (OBV) and;. iStochastic Stochastic Oscillator  (STOCHASTIC). It is possible to choose the amplitude for checking the divergence and the indicator has
FREE
Market Thermometer Jr
Edson Cavalca Junior
5 (1)
The Market Thermometer can be used to help traders identify sleepy or turbulent periods. It helps beginners to check when is the ideal time to enter operations, that is, when the value of the thermometer is below its average for several periods, identifying a peaceful market. When the market is heated, that is, the thermometer is above three times its average, it is time to make profits. The Thermometer measures the extent to which the end of a period, maximum or minimum price, projects outsi
FREE
The indicator plots the buying and selling volume on the chart. Two lines are generated corresponding to the average purchase and sale volumes. The crossing of averages, the increase in their distance are good indicators of market movement. Know our products    NOTES : It is recommended to use the default configuration and VPS values.  You need trading information (Time and Sales).   Parameters : Aggression Numbers of days prior to the current one for calculation; Volume Divider e
The Market Thermometer can be used to help traders identify sleepy or turbulent periods.  It helps beginners to check when is the ideal time to enter operations, that is, when the value of the thermometer is below its average for several periods, identifying a peaceful market.   When the market is heated, that is, the thermometer is above three times its average, it is time to make profits.  The Thermometer measures the extent to which the end of a period, maximum or minimum price, projects out
FREE
This indicator is based on the system of three moving averages where: First is the fast average (MA1); Second is the intermediate average (MA2) and; T hird is the slow average (MA3). The theory covered in the technical analysis books informs us that when the first average exceeds the second average it is an alert for the trader, however the movement occurs when the second average exceeds the third. The indicator will insert the check s Parameters : Averages : Period Fast Moving Average(FMA); Smo
Accumulated Aggression
Edson Cavalca Junior
The indicator measures the accumulated balance of aggression. The formula is as follows:  Accumulated   = Previous Candle Accumulated + Purchase Volume - Sales Volume. Know our products    *** Did you like the product? Then, help us doing review in the " Reviews " tab. The indicator sends information to your email or cell phone when the accumulated balance changes direction. Example : Accumulated seller becomes a buyer. Note : It is recommended to use the default configuration and VPS
Balance Aggression
Edson Cavalca Junior
The indicator measures the balance of aggression. The formula is as follows:   Aggression  = Purchase Volume - Sales Volume. Note : It is rec ommended to use the default configuration and VPS values. It does not work in Forex. Meet Our Products     Parameters : Numbers of days prior to the current one for calculation; Volume Divider e; Enables calculation of the current candle; Histogram Line style and; Size; Line Line style and; Size;  Follow us on our website to check the next new
Divergence Notification
Edson Cavalca Junior
This indicator plots in the candles the divergence found in the selected indicator and can also send a notification by email and / or to the cell phone. Works on all TIMEFRAMES. Meet Our Products   He identifies the divergences in the indicators: Relative Strength Index (RSI); Moving Average Convergence and Divergence (MACD); Volume Balance (OBV) and;. iStochastic Stochastic Oscillator  (STOCHASTIC). It is possible to choose the amplitude for checking the divergence and the indicator has
ACDO Brasil
Edson Cavalca Junior
The robo t opens a buy or sell position using the signs. Know our products   Position openings are based on the parameters identified as signals, if you activate all the robot will issue a trading order only if the number of signals is greater than the minimum stipulated by the user. The  filters  are used to increase the accuracy of the signals and if activated and not met your criteria, the order is not sent. EA also offers MOBILE STOP with the Parabolic SAR indicator and also by dis
Busque Trade
Edson Cavalca Junior
This indicator looks for SIGNS of Buy and Sell 14 SIGNS: Crossover of 2 moving averages; Crossover of 3 moving averages; RSI Indicator; Stochastic Indicator; Crossing line 0 MACD; Divergence of the RSI indicator; Divergence of the MACD indicator; Divergence of the OBV indicator; Divergence of the STOCHASTIC indicator; Three white soldiers candle pattern; Three black crows candle pattern; Hanging man    candle pattern; Hammer    candle pattern; Rupture Bands Bollinger. The indicator plot
Topos Fundos
Edson Cavalca Junior
The robot opens positions from Tops and Bottoms Perform trend reversal operations. It has 3 levels of top and bottom measurement. Trader can open and close position on 3 strength signals. The expert also allows you to configure the maximum loss to move along with the price (moving stop). Know our products    Edson Cavalca Junior Systems Analyst WARNINGS The buyer declares himself capable of: We do not provide any trading or risk management advice, ideal configurat
Inversao Infinita
Edson Cavalca Junior
This robot operates through triggers above and below the previous candlestick with STOP orders. When reaching the trigger (Stop Order) it opens the order and we have three situations: If it reaches TAKE PROFIT (Maximum Profit) and the Breakeven Point is activated, it moves the STOP LOSS and the reverse STOP ORDER to Breakeven and cancels the reverse STOP order when reaching the TP. If you go to STOP LOSS after reaching breakeven, the trigger of the reverse order will be reached be
Robo Nuvem
Edson Cavalca Junior
The robot uses one of the most used indicators in Asia: * ICHIMOKU CLOUD * There are two trading strategies: Crossing of Tenkan and Kijun lines and; Kumo lines crossing. Know our products    Position openings are based on the parameters identified as signals, if you activate all the robot will issue a trading order only if the number of signals is greater than the minimum stipulated by the user. This Expert Advisor (EA) works on HEDGE (Forex, etc.) and NETTING (Bovespa, etc.) accou
Robo Bandas
Edson Cavalca Junior
The robot uses one of the most known and used indicators in the world BOLLINGER BANDS There are two trading strategies: Upper or Lower Band Break and; Bollinger Band Entry. Know our products    Position openings are based on the parameters identified as signals. This Expert Advisor (EA) works on HEDGE (Forex, etc.) and NETTING (Bovespa, etc.) accounts, but manages only one position at a time. The  filters  are used to increase the accuracy of the signals and if activated and not met
Zona de Trade
Edson Cavalca Junior
The robot operates within pre-configured channels at the beginning of the operation. Use a Demo account or the Strategy Tester to find the best setup for the asset you want to trade. If you have any doubts about handling the robot, send a comment in the "Comments" tab and we will respond and insert you in our private group. Follow the steps below to configure it. After dragging the robot onto the chart, go to "input parameters and configure the following data: Enter th
Robo Sinal Telegram
Edson Cavalca Junior
Send your trades on the Metatrader 5 platform to your Telegram Group! Simple to use, just follow the steps below: Create a group in Telegram and enter the name in the robot parameters; Create a Bot in Telegram with the user BotFather: Send the following message-> /newbot; BotFather will ask for a name for your Bot; Send a message with the desired name; BotFather will ask for a username for your Bot; Send a message with the desired username; BotFather will send the Token; Insert the
Arbitragem B3
Edson Cavalca Junior
1 (1)
Arbitrage Robot IND/WIN or DOL/WDO This arbitrage robot works with WIN and WDO assets from the Brazilian Stock Exchange. The EA compares the best bid and ask (BID and ASK) of the "full" Index (IND) and compares it with the mini-index (WIN) and, if there is a gap between them, the difference in Ticks stipulated in the robot parameters, it opens a trade. It does the same analysis with DOL and WDO. It is necessary to insert the robot in the WIN or WDO chart and it will automa
Arbitragem B3 Acoes
Edson Cavalca Junior
Stock Arbitrage Robot This arbitration robot trades fractional lots of B3 shares. The EA compares the best bid and ask (BID and ASK) of the Share with a standard lot and compares it with that of the share with a fractional lot and if there is a gap between them, in the difference in Ticks stipulated in the robot's parameters, the even open a trade. Example: Insert robot into Petr3F for Gap based trading with Petr3. It is necessary to insert the robot in the Ticker chart wi
Tunel Vegas Sinal
Edson Cavalca Junior
Trader! Don't you want to spend all day on your computer screen looking at quotes? And do you want to receive stock buying/selling tips based on one of the most used indicators in FOREX on your cell phone? Then discover the Vegas Tunnel Support and product questions at the link below: Support This indicator searches for Buy and Sell SIGNALS in Stock Exchange Assets. It works on any asset on the market. Select in the parameters which Fibonacci line the signal will be sent a
Robo Vegas
Edson Cavalca Junior
Robo Vegas The robot's trading signal is given by touching the channels created by a moving average and distanced lines based on the Fibonacci Theory. See the Vegas Tunnel Signal indicator. Parameter configuration can be obtained from Support. Support and product questions at the link below: Support Select in the parameters which Fibonacci line will be used to open positions. You will receive all updates and insertions of new trading signals. Discover our o
필터:
Roman Zakurdaiev
85
Roman Zakurdaiev 2022.03.19 18:42 
 

Great!

Edson Cavalca Junior
18456
개발자의 답변 Edson Cavalca Junior 2022.03.22 11:02
Thank you for your rating. This week we will have a new update.
리뷰 답변
버전 1.50 2022.03.25
Inserted the option to send signal to email and cell phone.
버전 1.40 2021.01.25
Inserting description and icon in the parameter configuration screen
버전 1.30 2021.01.19
Insert option to disable GAPs before the default of 3 Candles
버전 1.20 2021.01.18
Volume filter inserted;
Possibility of searching by default: Three White Soldiers or Three Black Crows;
버전 1.10 2021.01.18
Created parameter: RSI Moving Average.