Top Bottom Scalper
- 지표
- Shiffolika Kapila
- 버전: 2.0
- 활성화: 10
Top and Bottom Scalper
BINARY AND FOREX
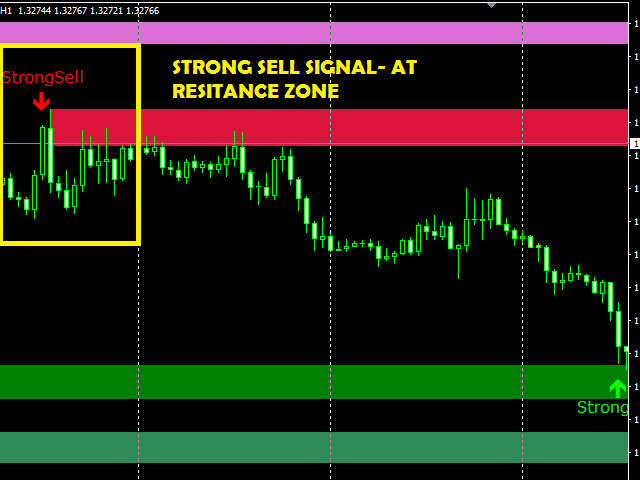
The signals indicate strong reversal points (Tops/bottoms)-
The indicator gives accurate signals on any currency pairs and instruments.
It also has a setting for adjusting the frequency of the signals.
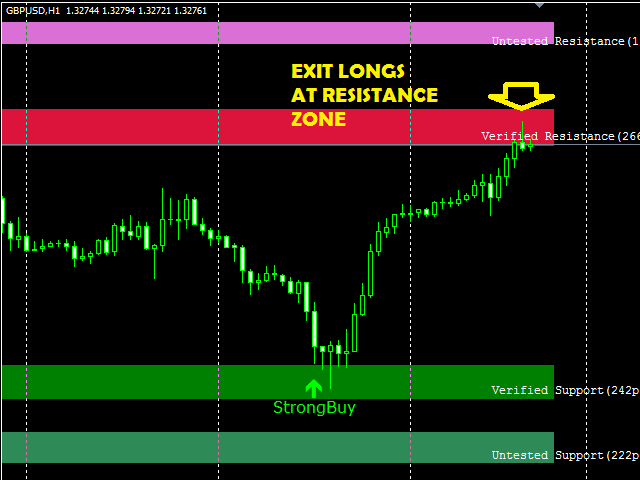
It is further strengthened and made robust by the support and resistance zones.
There are different qualities of zones as per robustness.
Inputs
ZONE SETTINGS;
BackLimit - default is 10 000. Check the past bars for formations.
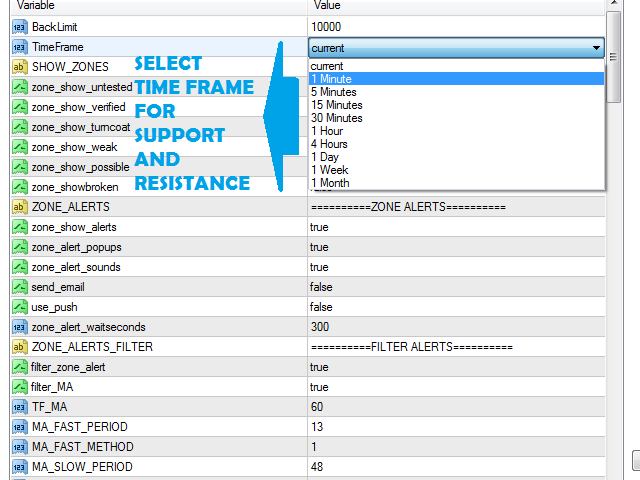
First Time Frame - M15 (default is 15 min). Input the timeframe for the zone.
M1 to Month
SHOW_ZONES;
zone_show_untested - false.
zone_show_verified - true.
zone_show_turncoat - true.
zone_show_weak - false.
zone_show_possible - true.
zone_showbroken - false.
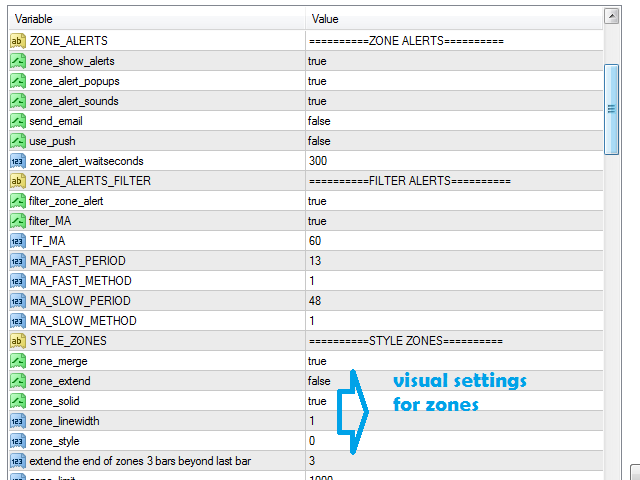
ZONE_ALERTS;
zone_show_alerts - true.
zone_alert_popups - true.
zone_alert_sounds - true.
send_email - false.
use_push - false.
zone_alert_waitseconds - 300. Delay set between alerts repeats.
ZONE_ALERTS_FILTER;
filter_zone_alert - true. apply the filters to the alerts.
filter_MA - true. apply the filter.
TF_MA - 60. timeframe for filtering the alerts.
MA_FAST_PERIOD - 13. Period used for the filter.
MA_FAST_METHOD - 1. like SMA, EMA, WMA.
MA_SLOW_PERIOD - 48. filter Period.
MA_SLOW_METHOD - 1.
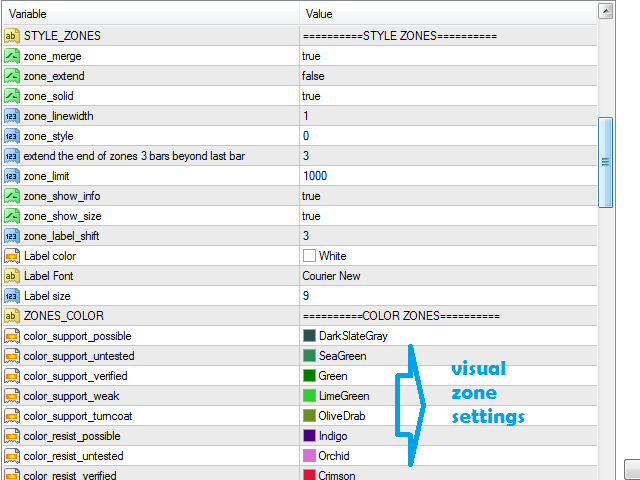
STYLE_ZONES;
zone_merge - true. The zones get merged.
zone_extend - false. The zones will extend to the latest bars.
zone_solid - true. Fills the color.
zone_linewidth - 1. Zone thick.
zone_style - 0. zone areas.
extend the end of zones 3 bars beyond last bar - 3.
zone_limit - 1000. the zone extended limit.
zone_show_info - true. Zone statistics.
zone_show_size - true. Zone Size.
zone_label_shift - 3. text info labels.
color_label - White. Label color.
font_label - Courier New. Label font.
size_label - 9. Label size.
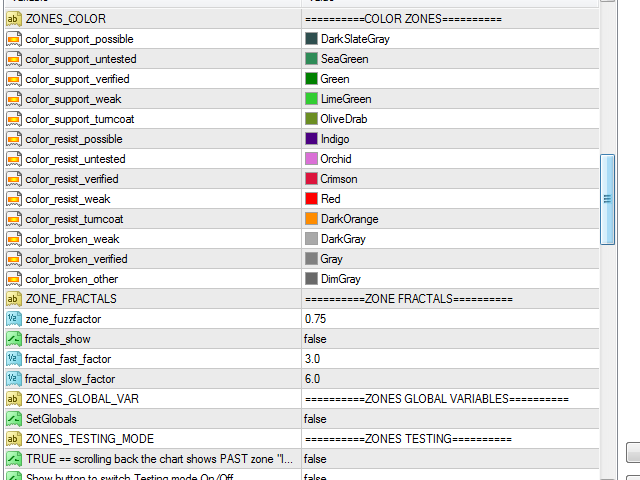
ZONES_COLOR;
color_support_possible - DarkSlateGray.
color_support_untested - SeaGreen.
color_support_verified - Green.
color_support_weak - LimeGreen.
ZONE_FRACTALS;
zone_fuzzfactor - default is 0.75.
fractals_show - default is false. True
fractal_fast_factor - default is 3.0.
fractal_slow_factor - default is 6.0.
ZONES_GLOBAL_VAR;
SetGlobals - false.
ZONES_TESTING_MODE = "==========ZONES TESTING==========";
TRUE == scrolling the chart back Displays PAST zones= false.
Show button to switch Testing mode On/Off = false -
Position of this button = 10.
TestingBtnY = 120.
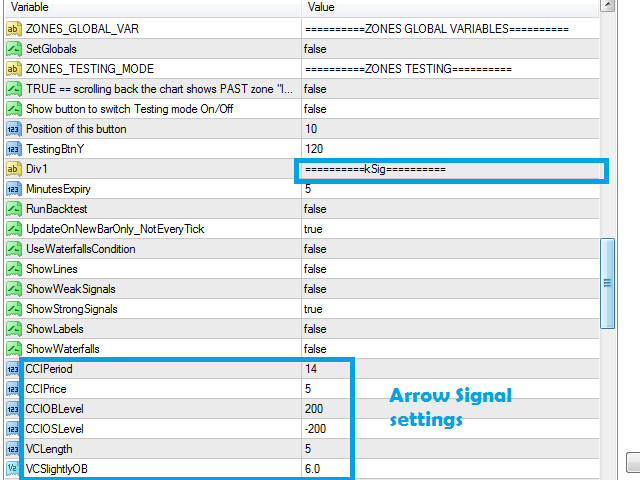
SETTINGS OF ARROW SIGNALS;( K-SIG)
MinutesExpiry = 5; -for binary
RunBacktest = False;-shows tester statistics
UpdateOnNewBarOnly_NotEveryTick = True;
UseWaterfallsCondition = False;
ShowLines = False;
ShowWeakSignals = False;
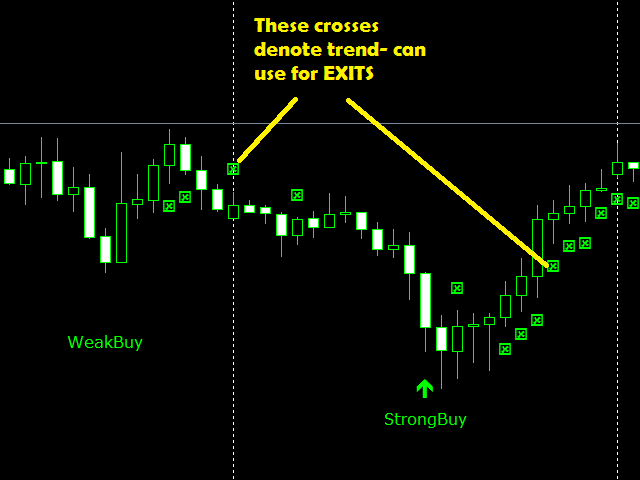
ShowStrongSignals = True;( display strong )
ShowLabels = False;
ShowWaterfalls = False;(CROSS For Exits/trend)
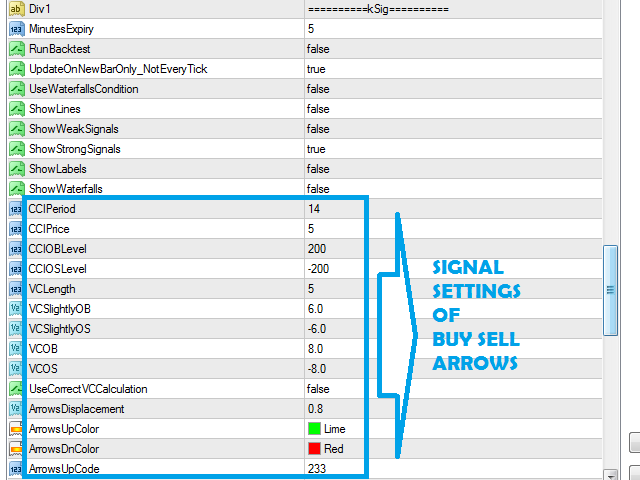
CCIPeriod = 14;(make higher -less signals)
CCIPrice = PRICE_TYPICAL;
CCIOBLevel = 200;
CCIOSLevel = -200;
VCLength = 5;
VCSlightlyOB = 6;
VCSlightlyOS = -6;
VCOB = 8;
VCOS = -8;
UseCorrectVCCalculation=False;
ArrowsDisplacement = 0.8;
ArrowsUpColor = Lime;
ArrowsDnColor = Red;
ArrowsUpCode = 233;
ArrowsDnCode = 234;
ArrowsWidth = 2;
WaterfallsArrowsDisplacement = 0.5;
WaterfallsArrowsUpColor = Lime;
WaterfallsArrowsDnColor = Red;
WaterfallsArrowsCode = 253;
WaterfallsArrowsWidth = 1;
AlertsOn = True;
AlertsOnCurrent = False;
AlertsMessage = True;
AlertsEmail = False;
AlertsPush = False;
AlertsSound = False;
LabelBuyColor = Lime;
LabelSellColor = Red;
LabelFontWidth = 14;
LabelCorner = 1;
LabelYDistance = 0;
LabelXDistance = 0;
LinesStyle = 2;
LinesWidth = 1;
UniqueID = "DEE_K_SIG";
==========Zone for arrow==========";(display only Signals at zone selected)
select_zone_possible = 1;
select_zone_untested = 0;
select_zone_verified = 1; (Signal Touching This zone)
select_zone_weak = 0;
select_zone_turncoat = 0;
KSigDefault = 1; ( Display all signals )
TextFontSize=12;
Font="Verdana";
ArrUpTextColor=clrLime;
ArrDnTextColor=clrRed;
TP1LineColor=clrRed;


As bad as it gets 👎👎