• 미리보기
  • 리뷰 (2)
  • 코멘트 (9)
  • 새 소식

Koala Engulf Pattern

3


    Koala Engulf Pattern Introduction
    • Professional MT5 indicator to detect engulf price action pattern.
    • Useful in forex , cryptocurrency , CFD, Oil market.
    • Some adjustable methods to separate qualified engulf patterns.
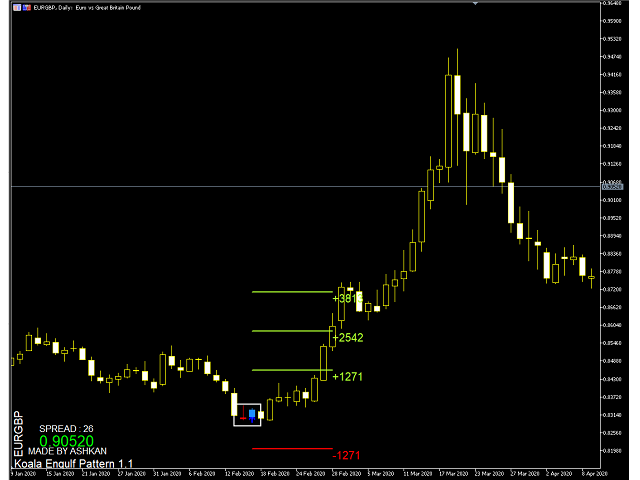
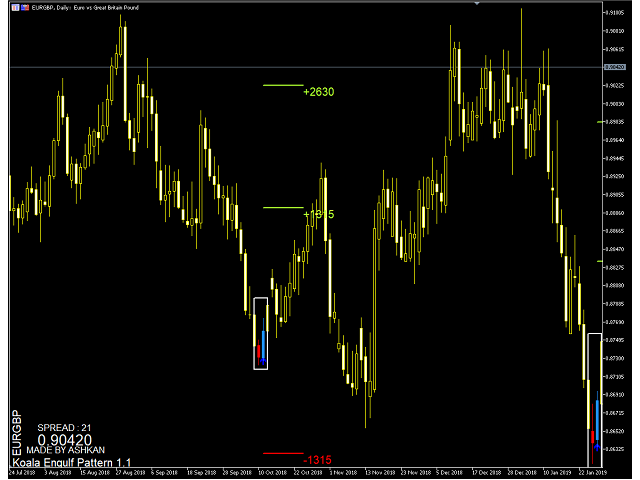
    • Nice drawing on chart by fill engulf candles and draw stop loss and 3 different take profits on chart.
    • Alert system contain pop up, mobile notification, email alert.
    Koala Engulf Pattern Advantages

    • Pure Price Action pattern, engulf is one of amazing price action patterns and very pure strategy
    • Push you to respect risk and reward rule, this indicator show stop loss , and 3 different take profits by different RR factor
    • There is some qualification method like body percent, last continues candle that allow you to reach best qualified price action pattern according.


    #forex #metatrader5 #priceaction #engulf #pattern #free

      #forex #forexindicator #forextrader #bitcoin #trading #forextrading #money #forexsignals #trader #cryptocurrency #forexlifestyle #investment #business #entrepreneur #investing #crypto #binaryoptions #invest #blockchain #forexmarket #forexlife #bitcoinmining #binary #success #fx #stocks #investor #daytrader #btc #forexsignal #bhfyp #expertadvisor #bestexpertadvisor


      추천 제품
      Surf Board
      Mohammadal Alizadehmadani
      Benefits of the Surfboard indicator : Entry signals without repainting If a signal appears and is confirmed, it does NOT disappear anymore, unlike indicators with repainting, which lead to major financial losses because they can show a signal and then remove it. perfect opening of trades The indicator algorithms allow you to find the Peak and floor position to enter a deal (buy or sell an asset), which increases the success rate for each and every trader using it. Surfboard works with any asse
      Scissors Pattern
      Kambiz Shahriarynasab
      Configure scaffolding charts and signals based on the scissor pattern, which works great at low times. Buy and sell signs based on 2 previous candle patterns It works on the active time form, and when detecting the pattern in 4 time frames, 5 minutes, 15 minutes, 30 minutes and one hour, the alert can be set to notify us of the formation of this pattern. MetaTrader version 4 click here How to use: When there is an opportunity to buy or sell, the marker places a scissors mark on
      The rubdfx divergence indicator is a technical analysis tool that compares a security's price movement. It is used to identify potential changes in the price trend of a security. The indicator can be applied to any type of chart, including bar charts and candlestick charts. The algorithm is based on MACD, which has been modified to detect multiple positive and negative divergences. Settings  ___settings___ * fastEMA * slowEMA * signalSMA *Alerts:   True/False     #Indicator Usage B
      Market Session Visual
      Kambiz Shahriarynasab
      The  Market Sessions Indicator for MT5 helps you  predict market turnarounds  by detecting major supply and demand areas. These pivot points tend to occur after a new session has started and the previous one is still open. It is also used to gauge how many points or pips the market moves on average during a session. This helps us to place better our take profits and stop losses. The indicator works on all forex pairs, gold, silver, commodities, stocks, indices and any other instrument that yo
      Rocket Trend
      Andriy Sydoruk
      The Rocket Trend indicator is trending. The indicator draws two-color points connected by lines along the chart. This is a trend indicator, it is an algorithmic indicator. It is easy to work and understand when a blue circle appears, you need to buy, when a red one appears, sell. The indicator is used for scalping and pipsing, and has proven itself well. Rocket Trend is available for analyzing the direction of the trend for a specific period of time. Ideal for novice traders learning the laws o
      Elevate Your Trading Experience with Wamek Trend Consult!   Unlock the power of precise market entry with our advanced trading tool designed to identify early and continuation trends. Wamek Trend Consult empowers traders to enter the market at the perfect moment, utilizing potent filters that reduce fake signals, enhancing trade accuracy, and ultimately increasing profitability.   Key Features: 1. Accurate Trend Identification: The Trend Consult indicator employs advanced algorithms and unparall
      Upgraded - Stars added to indentify Areas you can scale in to compound on your entry  when buying or selling version 2.4 Upgraded Notifications and alerts added version 2.3 *The indicator is suitable for all pairs fromm  Deriv pairs (Vix,jump,boom & crash indices) , Currencies, cryptos , stocks(USA100, USA30 ), and metals like gold etc. How does it work? Increasing the period make it more stable hence will only focus on important entry points However  lowering the period will mean the indica
      Introduction to Harmonic Volatility Indicator Harmonic Volatility Indicator is the first technical analysis applying the Fibonacci analysis to the financial volatility. Harmonic volatility indicator is another level of price action trading tool, which combines robust Fibonacci ratios (0.618, 0.382, etc.) with volatility. Originally, Harmonic Volatility Indicator was developed to overcome the limitation and the weakness of Gann’s Angle, also known as Gann’s Fan. We have demonstrated that Harmonic
      To download MT4 version please click here . This is the exact conversion from TradingView: "WaveTrend [LazyBear]" By "zeusuk3". One of the coolest indicators out there to detect overbought and oversold zones. It can be used as a part of more complicated strategy and for confirming a potential trade setup. There are buffers to use in EAs also. The indicator is loaded light and non-repaint. - You can message in private chat for further changes you need. Thanks for downloading 
      The 123 Pattern is one of the most popular, powerful and flexible chart patterns. The pattern is made up of three price points: a bottom, a peak or valley, and a Fibonacci retracement between 38.2% and 71.8%. A pattern is considered valid when the price breaks beyond the last peak or valley, moment at which the indicator plots an arrow, rises an alert, and the trade can be placed. [ Installation Guide | Update Guide | Troubleshooting | FAQ | All Products ] Clear trading signals Customizable c
      General Description In the simplest terms this is a contrarian intra-day scalping system. Built to try and let correct trades run as far as possible and flip the trade when indicated. The indicator looks at historical daily trading ranges to lay out levels at which it takes long and short positions based on the statistical levels. The indicator is built around index futures, mainly around S&P and the DOW but can be used an any futures contract mainly using AMP Futures to trade. The indicator is
      The new update makes this indicator a complete tool for studying, analyzing and operating probabilistic patterns. It includes: On-chart Multi-asset percentage monitor. Configurable martingales. Twenty-one pre-configured patterns, including Mhi patterns and C3. An advanced pattern editor to store up to 5 custom patterns. Backtest mode to test results with loss reports. Trend filter. Hit operational filter. Martingale Cycles option. Various types of strategies and alerts. Confluence between patter
      Liquidity Oscillator
      Paolo Scopazzo
      5 (1)
      A powerful oscillator that provide Buy and Sell signals by calculating the investor liquidity. The more liquidity the more buy possibilities. The less liquidity the more sell possibilities. Please download the demo and run a backtest! HOW IT WORKS: The oscillator will put buy and sell arrow on the chart in runtime only . Top value is 95 to 100 -> Investors are ready to buy and you should follow. Bottom value is 5 to 0 -> Investors are ready to sell and you should follow. Alert + sound will app
      AW Candle Patterns
      AW Trading Software Limited
      AW 양초 패턴 표시기는 강력한 양초 패턴 스캐너와 결합된 고급 추세 표시기의 조합입니다. 가장 신뢰할 수 있는 30개의 촛대 패턴을 인식하고 강조 표시하는 데 유용한 도구입니다. 또한 색상 막대를 기반으로 하는 현재 추세 분석기입니다.       크기를 조정하고 위치를 지정할 수 있는 플러그인 다중 시간 프레임 추세 패널. 트렌드 필터링에 따라 패턴 표시를 조정하는 고유한 기능. 장점: 캔들 패턴을 쉽게 식별 결과를 다시 그리지 않습니다 내장된 다중 시간 추세 패널 비활성화된 패턴 유형(1, 2, 3 촛불) 패턴 표시 시 트렌드 필터링 조정 MT4 version  표시된 패턴 목록: 망치 패턴 핀 업 / 핀 다운 약세 하라미 / 강세 하라미 Bearish Harami Cross / Bullish Harami Cross 피벗 포인트 반전 업 / 피벗 포인트 반전 다운 더 높은 종가와 함께 낮은 더블 바 / 더 낮은 종가와 함께 낮은 더블 바 종가 반전 업 / 종가 반전 다운 중립 막
      Girassol Sunflower MT5 Indicator
      Saullo De Oliveira Pacheco
      This is the famous Sunflower indicator for Metatrader5. This indicator marks possible tops and bottoms on price charts. The indicator identifies tops and bottoms in the asset's price history, keep in mind that the current sunflower of the last candle repaints, as it is not possible to identify a top until the market reverses and it is also not possible to identify a bottom without the market stop falling and start rising. If you are looking for a professional programmer for Metatrader5, please
      The indicator scans for Dinapoli thrust pattern in multiple timeframes for a specific market. Key Features Indicator can be used for all markets It can scan for thrust pattern on W1, D1, H4, H1, M30, M15 and M5 timeframes Ability to choose number of bars required above/below displaced moving average to define thrust Able to move display label on chart by single click Parameters Minimum Bars: Least amount of bars to account for Thrust DMA Period: Moving average period DMA Shift: Number or bars re
      Forex traders often observe increased market activity near Supply and Demand zones, which are levels formed based on zones where strong price movements have previously occurred. The Supply Demand Strong Weak Confirm Indicator utilizes fractals and the ATR indicator to identify and plot support and resistance zones on the price chart. These zones are categorized as follows: - Weak: significant high and low points in the trend. - Untested: crucial turning points in the price chart that the pr
      Blahtech Market Profile MT5
      Blahtech Limited
      5 (8)
      Was: $249  Now: $99   Market Profile defines a number of day types that can help the trader to determine market behaviour. A key feature is the Value Area, representing the range of price action where 70% of trading took place. Understanding the Value Area can give traders valuable insight into market direction and establish the higher odds trade. It is an excellent addition to any system you may be using. Inspired by Jim Dalton’s book “Mind Over Markets”, this indicator is designed to suit the
      The indicator determines the state of the market: trend or flat. The state of the market is determined by taking into account volatility. The flat (trading corridor)is displayed in yellow. The green color shows the upward trend. The red color shows the downward trend. The height of the label corresponds to the volatility in the market. The indicator does not redraw . Settings History_Size   - the amount of history for calculation. Period_Candles  - the number of candles to calculate the
      ACB Breakout Arrows MT5
      KEENBASE SOFTWARE SOLUTIONS
      5 (1)
      The ACB Breakout Arrows indicator provides a crucial entry signal in the market by detecting a special breakout pattern. The indicator constantly scans the chart for a settling momentum in one direction and provide the accurate entry signal right before the major move. Get multi-symbol and multi-timeframe scanner from here - Scanner for ACB Breakout Arrows MT 5 Key features Stoploss   and Take Profit levels are provided by the indicator. Comes with a MTF Scanner dashboard which tracks the br
      How to use Pair Trading Station Pair Trading Station is recommended for H1 time frame and you can use it for any currency pairs. To generate buy and sell signal, follow few steps below to apply Pair Trading Station to your MetaTrader terminal. When you load Pair Trading Station on your chart, Pair Trading station will assess available historical data in your MetaTrader platforms for each currency pair. On your chart, the amount of historical data available will be displayed for each currency pai
      Gartley Projections D
      Oleksandr Medviediev
      3 (2)
      The indicator identifies the harmonic patterns (XABCD) according to developments of H.M.Gartley ( "Profits in the Stock Market" , 1935г). It projects D-point as a point in the perspective projection (specify ProjectionD_Mode = true in the settings). Does not redraw. When a bar of the working timeframe closes, if the identified pattern point has not moved during Patterns_Fractal_Bars bars, an arrow appears on the chart (in the direction of the expected price movement). From this moment on, the ar
      Harmonic Patterns Osw MT5
      William Oswaldo Mayorga Urduy
      고조파 패턴 OSW MT5 이 표시기는 고조파 패턴을 감지하여 작업할 수 있도록 신호를 제공하여 주문을 받는지 여부에 따라 수동 분석을 추가할 수 있도록 합니다. 표시기가 감지하는 고조파 패턴은 다음과 같습니다. >가틀리 >박쥐 >나비 >게 >상어 찾을 수 있는 기능은 다음과 같습니다. > 메일, 모바일 및 PC에 대한 경고 생성 > 구매 및 판매 모두에서 고조파의 색상을 변경합니다. > "허용된 각도"를 결정합니다. 즉, 고조파가 38.2에 도달해야 하고 "허용된 각도"가 5인 경우 가격이 정확히 38.2에 닿지 않기 때문에 가격이 33.2와 43.2 사이가 되도록 허용합니다. > 1000개의 구성 가능한 양초 후에 고조파를 삭제하여 이전 그래픽 개체로 그래프를 로드하지 않도록 합니다. >지표가 움직임을 읽는 방법을 알기 위해 분석 중인 선 또는 충동 및 좌절을 표시합니다. >지그재그 구성으로 가격 변동을 측정하고 하모닉 패턴을
      KT CCI Alerts MT5
      KEENBASE SOFTWARE SOLUTIONS
      KT CCI Alerts is a personal implementation of the Commodity Channel Index (CCI) oscillator that provide signals and alerts on four custom events: When CCI enter in an overbought zone. When CCI exit from an overbought zone. When CCI enter in an oversold zone. When CCI exit from an oversold zone. Features A perfect choice for traders who speculate the CCI movements within an overbought/oversold zone. Lightly coded without using extensive memory and resources. It implements all Metatrader alerts
      Introduction to the Magic TD Sequential 9 The "Magic TD 9" is a technical analysis tool for stocks. It is based on historical price data and divides prices into nine levels based on a certain magnitude. It then calculates the average price of each level and constructs a sequence of nine data points. This sequence is called the "Magic TD 9," with the first data point representing the stock's lowest price and the ninth data point representing the highest price. Index inputs: 1 Turns: repr
      PZ Megaphone MT5
      PZ TRADING SLU
      The megaphone pattern is another chart pattern used for technical analysis. There is usually a lot of volatility happening when you spot it in the wild….and volatility equals opportunity in the world of trading. This pattern is famous for its “broadening formation” and the price action also warns of the increased risk ahead. The megaphone chart pattern provides unique entries and exits off different sides of its structure. [ Installation Guide | Update Guide | Troubleshooting | FAQ | All Pro
      Awesome Oscillator by Bill Williams with the ability to fine-tune and replace the averaging algorithms of the indicator, which significantly expands the possibilities of using this oscillator in algorithmic trading and brings it closer in its properties to such an indicator as the MACD. To reduce price noise, the final indicator is processed with an additional Smooth averaging. The indicator has the ability to give alerts, send mail messages and push signals when the direction of movement of th
      - This is the exact conversion from TradingView: "Support/Resistance" By "BarsStallone". - This indicator lets you read the buffers for R/S values. - This is a non-repaint and light processing load indicator. - This is not a multi time frame indicator If you want the multi time frame version you should create a personal order and I deliver two files that you need them both to have the multi time frame indicator running on your system. - The MT4 version of the indicator is not light load from pr
      Market Session Pro
      Kambiz Shahriarynasab
      The  Market Sessions Indicator for MT5 helps you  predict market turnarounds  by detecting major supply and demand areas. These pivot points tend to occur after a new session has started and the previous one is still open. It is also used to gauge how many points or pips the market moves on average during a session. This helps us to place better our take profits and stop losses. The indicator works on all forex pairs, gold, silver, commodities, stocks, indices and any other instrument that your
      Description The indicator uses market profile theory to show the most relevant trading zones, on a daily basis. The zones to be shown are LVN (low volume nodes) and POC (point of control). An LVN zone is one which represents price areas with the least time or volume throughout the day. Typically, these areas indicate a supply or demand initiative, and in the future, they can turn into important breakout or retracement zones. A POC zone is one which represents price areas with the most time or vo
      이 제품의 구매자들이 또한 구매함
      우선 이 거래 시스템이 리페인팅, 리드로잉 및 레이그 인디케이터가 아니라는 점을 강조하는 것이 중요합니다. 이는 수동 및 로봇 거래 모두에 이상적인 것으로 만듭니다. "스마트 트렌드 트레이딩 시스템 MT5"은 새로운 및 경험이 풍부한 트레이더를 위해 맞춤형으로 제작된 종합적인 거래 솔루션입니다. 10개 이상의 프리미엄 인디케이터를 결합하고 7개 이상의 견고한 거래 전략을 특징으로 하여 다양한 시장 조건에 대한 다목적 선택이 가능합니다. 트렌드 추종 전략: 효과적인 트렌드 추이를 타기 위한 정확한 진입 및 손절 관리를 제공합니다. 반전 전략: 잠재적인 트렌드 반전을 식별하여 트레이더가 범위 시장을 활용할 수 있게 합니다. 스캘핑 전략: 빠르고 정확한 데이 트레이딩 및 단기 거래를 위해 설계되었습니다. 안정성: 모든 인디케이터가 리페인팅, 리드로잉 및 레이그가 아니므로 신뢰할 수 있는 신호를 보장합니다. 맞춤화: 개별 거래 선호도를 고려한 맞춤형 전략을 지원합니다. 최상의 전략을 찾는
      Atomic Analyst MT5
      Issam Kassas
      4.27 (11)
      우선적으로 언급할 점은이 거래 지표가 다시 그리지 않고 지연되지 않으며 이를 통해 수동 및 로봇 거래 모두에 이상적이라는 점입니다. Atomic Analyst는 가격의 강도와 모멘텀을 활용하여 시장에서 더 나은 이점을 찾는 PA Price Action Indicator입니다. 고급 필터를 장착하여 잡음과 거짓 신호를 제거하고 거래 잠재력을 높이는 데 도움이 됩니다. 복잡한 지표의 다중 레이어를 사용하여 Atomic Analyst는 차트를 스캔하고 복잡한 수학적 계산을 간단한 신호와 색상으로 변환하여 초보 트레이더가 이해하고 일관된 거래 결정을 내릴 수 있도록합니다. "Atomic Analyst"는 새로운 및 경험이 풍부한 트레이더를위한 종합적인 거래 솔루션입니다. 프리미엄 지표와 최고 수준의 기능을 하나의 거래 전략에 결합하여 모든 종류의 트레이더에 대한 다재다능한 선택지가되었습니다. 인트라데이 거래 및 스캘핑 전략 : 빠르고 정확한 일일 거래 및 단기 거래를 위해 설계
      Quantum Trend Sniper
      Bogdan Ion Puscasu
      5 (37)
      소개       Quantum Trend Sniper Indicator는   추세 반전을 식별하고 거래하는 방식을 변화시키는 획기적인 MQL5 지표입니다! 13년 이상의 거래 경험을 가진 숙련된 트레이더 팀이 개발한       Quantum Trend Sniper 표시기       매우 높은 정확도로 추세 반전을 식별하는 혁신적인 방법으로 거래 여정을 새로운 차원으로 끌어올리도록 설계되었습니다. ***Quantum Trend Sniper Indicator를 구입하면 Quantum Breakout Indicator를 무료로 받을 수 있습니다!*** Quantum Trend Sniper Indicator는 추세 반전을 식별하고 세 가지 이익실현 수준을 제안할 때 경고, 신호 화살표를 제공합니다. 초보자 거래자와 전문 거래자 모두에게 적합합니다. Quantum EA 채널:       여기를 클릭하세요 MT4 버전:       여기를 클릭하세요
      FX Volume MT5
      Daniel Stein
      4.94 (17)
      모닝 브리핑을 통해 세부 정보와 스크린샷으로 매일 시장 업데이트를 받으세요 여기 mql5 및 텔레그램에서 FX 거래량은 브로커의 관점에서 시장 심리에 대한 실제 통찰력을 제공하는 최초이자 유일한 거래량 지표입니다. 브로커와 같은 기관 시장 참여자가 외환 시장에서 어떤 포지션을 취하고 있는지에 대한 훌륭한 통찰력을 COT 보고서보다 훨씬 빠르게 제공합니다. 차트에서 이 정보를 직접 확인하는 것은 트레이딩의 진정한 판도를 바꾸고 획기적인 솔루션입니다. 다음과 같은 고유한 시장 데이터 인사이트의 이점 비율 는 통화의 매수/매도 포지션 비율을 백분율로 표시 비율 변화 는 선택한 기간 내 매수 비율과 비율 변화를 표시 총 거래량 는 해당 통화의 총 거래량(롱 및 숏)을 로트 단위로 보여줍니다 Volumes Long 는 해당 통화의 모든 롱 포지션의 거래량을 보여줍니다 Volumes Short 는 해당 통화의 모든 숏 포지션의 거래량을 보여줍니다 Net Long 는 순 롱 포지션의 거래량
      Trend Screener Pro MT5
      STE S.S.COMPANY
      4.89 (61)
      트렌드 표시기, 트렌드 트레이딩 및 필터링을 위한 획기적인 고유 솔루션, 하나의 도구 안에 내장된 모든 중요한 트렌드 기능! Forex, 상품, 암호 화폐, 지수 및 주식과 같은 모든 기호/도구에 사용할 수 있는 100% 다시 칠하지 않는 다중 시간 프레임 및 다중 통화 표시기입니다. Trend Screener는 차트에 점이 있는 화살표 추세 신호를 제공하는 효율적인 지표 추세 추종 지표입니다. 추세 분석기 표시기에서 사용할 수 있는 기능: 1. 트렌드 스캐너. 2. 최대 이익 분석이 있는 추세선. 3. 추세 통화 강도 측정기. 4. 경고가 있는 추세 반전 점. 5. 경고가 있는 강력한 추세 점. 6. 추세 화살표 Trend Screener Indicator가 있는 일일 분석 예, 일일 신호 성능...등은 여기에서 찾을 수 있습니다. 여기를 클릭하십시오. LIMITED TIME OFFER : Trend Screener Indicator는 50$ 및 평생 동안만 사용할 수 있습니다
      우선적으로, 이 거래 도구는 전문적인 거래에 이상적인 비-다시 그리기 및 지연되지 않는 지표입니다.  스마트 가격 액션 컨셉트 인디케이터는 신규 및 경험 많은 트레이더 모두에게 매우 강력한 도구입니다. Inner Circle Trader Analysis 및 Smart Money Concepts Trading Strategies와 같은 고급 거래 아이디어를 결합하여 20가지 이상의 유용한 지표를 하나로 결합합니다. 이 인디케이터는 스마트 머니 컨셉트에 중점을 두어 대형 기관의 거래 방식을 제공하고 이동을 예측하는 데 도움을 줍니다.  특히 유동성 분석에 뛰어나 기관이 어떻게 거래하는지 이해하는 데 도움을 줍니다. 시장 트렌드를 예측하고 가격 변동을 신중하게 분석하는 데 탁월합니다. 귀하의 거래를 기관 전략에 맞추어 시장의 동향에 대해 더 정확한 예측을 할 수 있습니다. 이 인디케이터는 시장 구조를 분석하고 중요한 주문 블록을 식별하고 다양한 패턴을 인식하는 데 뛰어납니다. 
      FX Power MT5 NG
      Daniel Stein
      5 (4)
      모닝 브리핑 여기 mql5 와 텔레그램에서 FX Power MT5 NG 는 오랫동안 인기 있는 통화 강도 측정기인 FX Power의 차세대 버전입니다. 이 차세대 강도 측정기는 무엇을 제공합니까? 기존 FX Power에서 좋아했던 모든 것 PLUS GOLD/XAU 강도 분석 더욱 정밀한 계산 결과 개별 구성 가능한 분석 기간 더 나은 성능을 위한 사용자 정의 가능한 계산 한도 특별 멀티더 많은 것을보고 싶은 사람들을위한 특별한 다중 인스턴스 설정 모든 차트에서 좋아하는 색상을위한 끝없는 그래픽 설정 수많은 알림 옵션, 중요한 것을 다시는 놓치지 않도록 Windows 11 및 macOS 스타일의 둥근 모서리가 있는 새로운 디자인 마법처럼 움직이는 인디케이터 패널 FX 파워 키 특징 모든 주요 통화의 완전한 강세 이력 모든 시간대에 걸친 통화 강세 이력 모든 브로커 및 차트에서 고유 계산 결과 100% 신뢰할 수있는 실시간100 % 신뢰할 수있는 실시간 계산-> 다시 칠하지 않음
      Advanced Supply Demand MT5
      Bernhard Schweigert
      4.53 (15)
      현재 33% 할인! 초보자나 전문 트레이더를 위한 최고의 솔루션! 이 보조지표는 우리가 다수의 독창적 기능과 새로운 공식을 통합한 독특하고 고품질이며 저렴한 거래 도구입니다. 이 업데이트를 통해 이중 시간대를 표시할 수 있습니다. 더 높은 TF를 표시할 수 있을 뿐만 아니라 차트 TF와 더 높은 TF 모두를 표시할 수 있습니다: 중첩 영역 표시. 모든 Supply Demand 트레이더들이 좋아할 것입니다. :) 중요한 정보 공개 Advanced Supply Demand의 잠재력을 극대화하려면 다음을 방문하십시오. https://www.mql5.com/ko/blogs/post/720245   진입 또는 목표의 명확한 트리거 포인트를 정확히 찾아냄으로 해서 거래가 어떻게 개선될지 상상해 보십시오. 새로운 알고리즘을 기반으로 매수자와 매도자 간의 잠재적인 불균형을 훨씬 더 쉽게 분간할 수 있습니다. 왜냐하면 가장 강한 공급영역과 가장 강한 수요 영역과 과거에 어떻게 진행 되었는지를(이
      RelicusRoad Pro MT5
      Relicus LLC
      4.82 (22)
      이제 $ 147 (몇 가지 업데이트 후 $ 499 증가) - 무제한 계정 (PCS 또는 MACS) RelicusRoad 사용 설명서 + 교육 비디오 + 비공개 Discord 그룹 액세스 + VIP 상태 시장을 보는 새로운 방법 RelicusRoad는 외환, 선물, 암호화폐, 주식 및 지수에 대한 세계에서 가장 강력한 거래 지표로서 거래자에게 수익성을 유지하는 데 필요한 모든 정보와 도구를 제공합니다. 우리는 초보자부터 고급까지 모든 거래자가 성공할 수 있도록 기술적 분석 및 거래 계획을 제공합니다. 미래 시장을 예측할 수 있는 충분한 정보를 제공하는 핵심 거래 지표입니다. 우리는 차트에서 말이 안 되는 여러 지표 대신 완전한 솔루션을 믿습니다. 타의 추종을 불허하는 매우 정확한 신호, 화살표 + 가격 조치 정보를 표시하는 올인원 표시기입니다. 강력한 AI를 기반으로 하는 RelicusRoad는 누락된 정보와 도구를 제공하여 교육하고 성공적인 트레이더인 트레이딩 전문
      XQ Indicator MetaTrader 5
      Marzena Maria Szmit
      5 (1)
      Step into the realm of Forex trading with confidence and precision using XQ, a cutting-edge Forex indicator designed to elevate your trading game to unprecedented heights. Whether you're a seasoned trader or just stepping into the world of currency exchange, XQ Forex Indicator empowers you with the insights and signals needed to make informed trading decisions. The signal conditions are a combination of three indicators, and XQ Forex Indicator only display  medium and long-term trends . The ind
      Volume by Price MT5
      Brian Collard
      5 (3)
      The Volume by Price Indicator for MetaTrader 5 features Volume Profile and Market Profile TPO (Time Price Opportunity). Get valuable insights out of currencies, equities and commodities data. Gain an edge trading financial markets. Volume and TPO histogram bar and line charts. Volume Footprint charts. TPO letter and block marker charts including split structures. Versatile segmentation and compositing methods. Static, dynamic and flexible ranges with relative and/or absolute visualizations. Lay
      Auto Order Block with break of structure based on ICT and Smart Money Concepts Futures Break of Structure ( BoS )             Order block ( OB )            Higher time frame Order block / Point of Interest ( POI )    shown on current chart           Fair value Gap ( FVG ) / Imbalance   ,  MTF      ( Multi Time Frame )    Volume Imbalance     ,  MTF          vIMB Gap’s Equal High / Low’s     ,  MTF             EQH / EQL Liquidity               Current Day High / Low           HOD /
      Entry Points Pro for MT5
      Yury Orlov
      4.54 (157)
      다시 색을 칠하지 않고 거래에 진입할 수 있는 정확한 신호를 제공하는 MT5용 지표입니다. 외환, 암호화폐, 금속, 주식, 지수 등 모든 금융 자산에 적용할 수 있습니다. 매우 정확한 추정값을 제공하고 매수와 매도의 가장 좋은 시점을 알려줍니다. 하나의 시그널로 수익을 내는 지표의 예와 함께 비디오 (6:22)시청하십시오! 대부분의 거래자는 Entry Points Pro 지표의 도움으로 첫 거래 주 동안 트레이딩 결과를 개선합니다. 저희의   Telegram Group 을 구독하세요! Entry Points Pro 지표의 좋은점. 재도색이 없는 진입 신호 신호가 나타나고 확인되면(시그널 캔들이 완성된 경우) 신호는 더 이상 사라지지 않습니다. 여타 보조지표의 경우 신호를 표시한 다음 제거되기 때문에 큰 재정적 손실로 이어집니다. 오류 없는 거래 게시 알고리즘을 통해 트레이드(진입 또는 청산)를 할 이상적인 순간을 찾을 수 있으며, 이를 통해 이를 사용하는 모든 거래자의
      ICT, SMC, SMART MONEY CONCEPTS, SMART MONEY, Smart Money Concept, Support and Resistance, Trend Analysis, Price Action, Market Structure, Order Blocks, BOS/CHoCH,   Breaker Blocks ,  Momentum Shift,   Supply&Demand Zone/Order Blocks , Strong Imbalance,   HH/LL/HL/LH,    Fair Value Gap, FVG,  Premium  &   Discount   Zones, Fibonacci Retracement, OTE, Buy Side Liquidity, Sell Side Liquidity, BSL/SSL Taken, Equal Highs & Lows, MTF Dashboard, Multiple Time Frame, BigBar, HTF OB, HTF Market Structure
      가격이 역전되고 후퇴함에 따라 시장 구조가 변경됩니다. 시장 구조 반전 경고 표시기는 추세 또는 가격 움직임이 고갈에 가까워지고 반전할 준비가 되었음을 식별합니다. 일반적으로 반전이나 큰 하락이 일어나려고 할 때 발생하는 시장 구조의 변화를 알려줍니다. 지표는 가능한 고갈 지점 근처에서 새로운 고점 또는 저점이 형성될 때마다 초기에 돌파와 가격 모멘텀을 식별합니다. 표시기는 반대쪽에 있는 마지막 촛불에 직사각형을 그립니다. 그런 다음 현재의 단기 추세에서 계속 움직이기 때문에 가격과 함께 직사각형을 따라갈 것입니다. 가격이 사각형 위나 아래로 다시 닫힐 정도로 약해지면 시장 구조에 잠재적인 변화가 일어나고 있음을 나타냅니다. 그런 다음 표시기는 방향의 잠재적인 이동과 추세 또는 주요 하락의 가능한 반전 시작에 대해 경고합니다. 작동 방식을 보려면 아래의 작동 표시기를 참조하십시오! 모든 쌍 및 주요 기간을 모니터링하는 대시보드: https://www.mql5.com/
      Blahtech Supply Demand MT5
      Blahtech Limited
      4.57 (14)
      Was: $299  Now: $99   Supply Demand uses previous price action to identify potential imbalances between buyers and sellers. The key is to identify the better odds zones, not just the untouched ones. Blahtech Supply Demand indicator delivers functionality previously unavailable on any trading platform. This 4-in-1 indicator not only highlights the higher probability zones using a multi-criteria strength engine, but also combines it with multi-timeframe trend analysis, previously confirmed swings
      ON Trade Gann Squares MT5
      Abdullah Alrai
      5 (1)
      간 스퀘어 지표는 W.D. 간이 쓴 "시장 예측을 위한 수학적 공식" 기사에 기반한 강력한 시장 분석 도구입니다. 이 도구는 수학적 개념과 간 이론을 사용하여 정확한 시장 분석을 수행합니다. 144, 90, 52의 제곱과 9의 제곱을 사용합니다. 또한 의 9의 제곱근 및 해당 제곱의 채널 및 스타 패턴과의 관련성을 통합합니다. 사용자 메뉴얼 및 적용: 이 지표를 사용하기 전에 사용자 메뉴얼을 읽고 질문이 있을 경우 문의하시기 바랍니다. 전체 메뉴얼은 웹사이트에서 제공됩니다. MT5의 전체 버전을 구매하거나 MT4의 무료 버전을 테스트할 수 있습니다. 두 버전 모두 링크에서 확인하실 수 있습니다. 주요 기능 및 기능: 간 스퀘어 지표는 정확한 결정을 위해 기하학적 개념과 간 이론을 활용하는 시장 분석을 위한 포괄적인 도구 집합을 제공합니다. 주요 기능은 다음과 같습니다. 9의 제곱 분석:   이 지표는 9의 제곱에 대한 수평 선, 스타 패턴, 그리드 및 간 팬을 그릴 수 있습니다. 간
      Trend Line Map Pro MT5
      STE S.S.COMPANY
      4.67 (9)
      트렌드 라인 맵 표시기는 트렌드 스크리너 표시기의 애드온입니다. Trend screener(Trend Line Signals)에 의해 생성된 모든 신호에 대한 스캐너로 작동합니다. Trend Screener Indicator 기반의 Trend Line Scanner입니다. Trend Screener Pro 표시기가 없으면 Trend Line Map Pro가 작동하지 않습니다. It's a Trend Line Scanner based on Trend Screener Indicator. If you don't have Trend Screener Pro Indicator,     the Trend Line Map Pro will not work . MQL5 블로그에 액세스하여 추세선 지도 표시기의 무료 버전을 다운로드할 수 있습니다. Metatrader Tester 제한 없이 구매하기 전에 사용해 보십시오. : 여기를 클릭하세요 1. 쉽게 얻을 수 있는 이점 통화 및
      TrendLine PRO MT5
      Evgenii Aksenov
      4.78 (49)
      The Trend Line PRO indicator is an independent trading strategy. It shows the trend change, the entry point to the transaction, as well as automatically calculates three levels of Take Profit and Stop Loss protection Trend Line PRO is perfect for all Meta Trader symbols: currencies, metals, cryptocurrencies, stocks and indices Advantages of Trend Line PRO Never redraws its signals The possibility of using it as an independent strategy It has three automatic levels Take Profit and Stop Loss lev
      소개       Quantum Breakout PRO   , 브레이크아웃 존 거래 방식을 변화시키는 획기적인 MQL5 지표! 13년 이상의 거래 경험을 가진 숙련된 트레이더 팀이 개발한       퀀텀 브레이크아웃 PRO       혁신적이고 역동적인 브레이크아웃 존 전략으로 거래 여정을 새로운 차원으로 끌어올리도록 설계되었습니다. Quantum Breakout Indicator는 5개의 이익 목표 영역이 있는 브레이크아웃 영역의 신호 화살표와 브레이크아웃 상자를 기반으로 한 손절 제안을 제공합니다. 초보자 거래자와 전문 거래자 모두에게 적합합니다. Quantum EA 채널:       여기를 클릭하세요 중요한! 구매 후 설치 매뉴얼을 받으려면 개인 메시지를 보내주십시오. 추천: 기간: M15 통화쌍: GBPJPY, EURJPY, USDJPY,NZDUSD, XAUUSD 계정 유형: 스프레드가 매우 낮은 ECN, Raw 또는 Razor 브로커 시간: GM
      Owl Smart Levels MT5
      Sergey Ermolov
      4.47 (36)
      MT4 버전  |  FAQ Owl Smart Levels Indicator 는 Bill Williams 의 고급 프랙탈, 시장의 올바른 파동 구조를 구축하는 Valable ZigZag, 정확한 진입 수준을 표시하는 피보나치 수준과 같은 인기 있는 시장 분석 도구를 포함하는 하나의 지표 내에서 완전한 거래 시스템입니다. 시장과 이익을 취하는 장소로. 전략에 대한 자세한 설명 표시기 작업에 대한 지침 고문-거래 올빼미 도우미의 조수 개인 사용자 채팅 ->구입 후 나에게 쓰기,나는 개인 채팅에 당신을 추가하고 거기에 모든 보너스를 다운로드 할 수 있습니다 힘은 단순함에 있습니다! Owl Smart Levels 거래 시스템은 사용하기 매우 쉽기 때문에 전문가와 이제 막 시장을 연구하고 스스로 거래 전략을 선택하기 시작한 사람들 모두에게 적합합니다. 전략 및 지표에는 눈에 보이지 않는 비밀 공식 및 계산 방법이 없으며 모든 전략 지표는 공개되어 있습니다. Owl Smart Levels를
      AW Trend Predictor MT5
      AW Trading Software Limited
      4.76 (54)
      하나의 시스템에서 추세와 고장 수준의 조합입니다. 고급 지표 알고리즘은 시장 노이즈를 필터링하고 추세, 진입점 및 가능한 출구 수준을 결정합니다. 표시기 신호는 통계 모듈에 기록되어 가장 적합한 도구를 선택하여 신호 기록의 효율성을 보여줍니다. 이 표시기는 이익 실현 및 손절매 표시를 계산합니다. 매뉴얼 및 지침 ->   HERE   / MT4 버전 ->   HERE 지표로 거래하는 방법: Trend Predictor로 거래하는 것은 3단계로 간단합니다. 1단계 - 포지션 열기 70% 이상의 성공률로 매수 신호를 받았습니다. 2단계 - StopLoss 결정 반대 신호로 트렁크 선택 3단계 - 이익 실현 전략 정의 전략 1: TP1 도달 시 전체 포지션 청산 전략 2: TP1 도달 시 포지션의 50% 청산 및 TP2 도달 시 나머지 50% 청산 전략 3: 추세 반전 시 전체 포지션 청산 이익: 결과를 다시 그리지 않음, 신호는 엄격하게 양초가 닫힐 때 어드바이저에서 사용할 수 있습니
      Gartley Hunter Multi
      Siarhei Vashchylka
      5 (5)
      Gartley Hunter Multi - An indicator for searching for harmonic patterns simultaneously on dozens of trading instruments and on all classic timeframes: (m1, m5, m15, m30, H1, H4, D1, Wk, Mn). Manual (Be sure to read before purchasing) | Version for MT4 Advantages 1. Patterns: Gartley, Butterfly, Shark, Crab. Bat, Alternate Bat, Deep Crab, Cypher 2. Simultaneous search for patterns on dozens of trading instruments and on all classic timeframes 3. Search for patterns of all possible sizes. Fr
      TPSproTREND PrO MT5
      Roman Podpora
      5 (5)
      TPSpro TRENDPRO  - is a trend indicator that automatically analyzes the market and provides information about the trend and each of its changes, as well as giving signals for entering trades without redrawing! The indicator uses each candle, analyzing them separately. referring to different impulses - up or down impulse. Exact entry points into transactions for currencies, crypto, metals, stocks, indices!  -  Version MT4                  DETAILED DESCRIPTION        /       TRADING SETUPS       
      Golden Spikes Detector
      Batsirayi L Marango
      5 (1)
      Golden Spikes Detector This indicator is based on an advanced strategy primarily for trading spikes on Boom and Crash Indices. Complex algorithms were implemented to detect high probability entries only. It alerts on potential Buy and Sell entries. To trade spikes on the Deriv or Binary broker, only take Buy Boom and Sell Cash alerts. It was optimised to be loaded on 5-minute timeframe although multiple timeframe analysis is done in the background. Features ·             Desktop pop up and sound
      Matrix Arrow Indicator MT5
      Juvenille Emperor Limited
      5 (14)
      매트릭스 화살표 표시기 MT5 는 외환, 상품, 암호 화폐, 지수, 주식과 같은 모든 기호/도구에 사용할 수 있는 100% 다시 칠하지 않는 다중 기간 표시기를 따르는 고유한 10 in 1 추세입니다.  Matrix Arrow Indicator MT5 는 다음과 같은 최대 10개의 표준 지표에서 정보와 데이터를 수집하여 초기 단계에서 현재 추세를 결정합니다. 평균 방향 이동 지수(ADX) 상품 채널 지수(CCI) 클래식 하이켄 아시 캔들 이동 평균 이동 평균 수렴 발산(MACD) 상대 활력 지수(RVI) 상대 강도 지수(RSI) 포물선 SAR 스토캐스틱 오실레이터 윌리엄스의 백분율 범위 모든 지표가 유효한 매수 또는 매도 신호를 제공하면 강력한 상승/하락 추세를 나타내는 다음 캔들/막대가 시작될 때 해당 화살표가 차트에 인쇄됩니다. 사용자는 사용할 표시기를 선택하고 각 표시기의 매개변수를 개별적으로 조정할 수 있습니다. 매트릭스 화살표 표시기 MT5는 선택한 표시기에서만 정보를 수
      IX Power MT5
      Daniel Stein
      5 (2)
      IX Power는   마침내 FX Power의 탁월한 정밀도를 외환이 아닌 기호에도 적용했습니다. 좋아하는 지수, 주식, 원자재, ETF, 심지어 암호화폐까지 단기, 중기, 장기 추세의 강도를 정확하게 파악할 수 있습니다. 단말기가 제공하는   모든 것을 분석할   수 있습니다. 사용해 보고 트레이딩   타이밍이 크게 향상되는   것을 경험해 보세요. IX Power 주요 특징 단말기에서 사용 가능한 모든 거래 심볼에 대해 100% 정확한 비재도장 계산 결과 제공 사전 구성 및 추가적으로 개별 구성 가능한 강도 분석 기간의 드롭다운 선택 가능 이메일, 메시지, 모바일 알림을 통한 다양한 알림 옵션 제공 EA 요청을 위한 액세스 가능한 버퍼 더 나은 성능을 위한 사용자 지정 가능한 계산 한도 더 많은 것을 보고 싶은 사용자를 위한 특별 다중 인스턴스 설정 모든 차트에서 좋아하는 색상을 위한 무한한 그래픽 설정 가능 Windows 11 및 macOS 스타일의 둥
      Account Graph MT5
      Kyra Nickaline Watson-gordon
      5 (1)
      An indicator to draw a graph of account current and historical state such as Balance, Equity, Margin, Free Margin, Margin Level, Drawdown, Account Profit, Deposit and Withdrawals. Indicator Inputs : Draw Balance Graph Draw Equity Graph Draw Margin Graph Draw Free Margin Graph Draw Margin Level Graph Draw Drawdown Graph Draw Account Profit Graph Hide Data on Chart and Buffers Connect Gaps by Lines Sign of DDs on Profit Sign of DDs on Loss Tips : The Indicator will draw historical balance gra
      The 1 2 3 Pattern Scanner MT5
      Reza Aghajanpour
      5 (12)
      ** All Symbols x All Timeframes scan just by pressing scanner button ** ***Contact me after purchase to send you instructions and add you in "123 scanner group" for sharing or seeing experiences with other users. After 15 years of experience in the markets and 3 years of programming, Winner indicator is ready. I would like to share with you! Introduction The 123 Pattern Scanner indicator with a special enhanced algorithm is a very repetitive common pattern finder with a high success rate . Inte
      Smart Peak Bottom
      Xiaoyu Huang
      5 (2)
      이것은 고점과 저점을 판단하기 위한 명확한 지표이며 진동 시장에 적합합니다. 프로모션 가격 49$ → 59$ 특징 상의와 하의를 잘 판단한다 다시 그리기 없음, 드리프트 없음 빠른 계산, 지연 없음 풍부한 알림 모드 여러 매개 변수 및 색상을 조정할 수 있습니다. 매개변수 "======== 메인 ========" HighLowPeriod1 = 9 HighLowPeriod2 = 60 HighLowPeriod3 = 34 HighLowEMAPeriod = 4 MASignalPeriod = 5 "======== 알림 ========" UseAlertNotify = 참; UseMetaQuotesIDNotify = 참; UseMailNotify = 참; NotifySignalMode = 색상 변경 및 레벨 확인; 하이레벨 = 80; 저수준 = 20; NofityPreMessage = "스마트 피크 바닥"; EA 통화의 경우 0. 높은 버퍼 1.낮은 버퍼 2. 방향 버퍼 1 up
      제작자의 제품 더 보기
      Koala FVG
      Ashkan Hazegh Nikrou
      4.5 (4)
      MT5용 Koala FVG를 소개합니다 - 귀하의 프로페셔널한 Fair Value Gap (FVG) 패턴 인디케이터입니다. Koala FVG: MT5에서 정밀 트레이딩을 위한 당신의 길 Koala FVG를 사용하여 Fair Value Gap (FVG) 패턴의 힘을 발견하세요. 이것은 MetaTrader 5용으로 설계된 최첨단 인디케이터입니다. 한정된 시간 동안 이 프로페셔널한 도구에 무료로 액세스할 수 있습니다. 이 도구가 프리미엄 인디케이터로 전환되기 전에 무료로 이용해보세요. 주요 특징: FVG 패턴 감지: Koala FVG는 최소 및 최대 크기를 사용자 정의할 수 있는 기준에 따라 자동으로 FVG 패턴을 식별합니다. 시각적 표현: FVG 영역을 나타내는 동적 사각형을 포함한 그래픽 표시로 명확성을 경험해보세요. 세 개의 선이 정밀한 분석을 위해 FVG 레벨을 강조합니다. 화살표 입장 신호: 거래 기회를 놓치지 마세요. Koala FVG는 입장 지점을 나타내는 명확한 화살표
      FREE
      KoalaFVG Scalper
      Ashkan Hazegh Nikrou
      코알라 FVG 스캘퍼 - 정밀 스켈핑을 위한 여러 통화 솔루션 Cutting-edge인 Koala FVG 스캘퍼를 체험하세요. 이는 Qualified FVG (Fair Value Gap) 개념을 활용하기 위해 디자인된 전문가 어드바이저입니다. 무료로 제공되는 Koala FVG Indicator와 완벽하게 통합되어 있는 이 혁신적인 스캘핑 EA는 여기 에서 다운로드할 수 있습니다. 주요 장점: 높은 정확도: 다양한 통화 쌍에 대한 H1 시간 프레임에서 80% 이상의 정확한 예측을 달성합니다. 향상된 안전성: 훨씬 안전한 손절 전략을 통해 안전한 거래 환경을 제공합니다. 최적화된 테이크 프로핏: 각 거래에서 이익을 극대화하기 위해 최적화된 테이크 프로핏 레벨을 활용합니다. 코알라 FVG 스캘퍼에서 페어 밸류 갭은 어떻게 작동하나요? 페어 밸류 갭(FVG) 패턴은 한 방향으로의 강한 움직임 이후에 나타납니다. 주위의 두 개의 캔들로 커버될 수 없는 강렬한 캔들이 일반적으로 나타납니다. 이
      Koala BTC Level
      Ashkan Hazegh Nikrou
      5 (1)
      Koala Trading Solution 채널 에 가입하여 MQL5 커뮤니티에서 최신 신호 및 Koala 제품에 대한 소식을 확인하세요. 가입 링크는 아래에 있습니다: https://www.mql5.com/en/channels/koalatradingsolution BTC 레벨 지표에 오신 것을 환영합니다 코알라 BTC 레벨 지표 이 지표는 BTC를 구매하고 싶어하는 분들을 위해 만들어졌습니다. BTC는 지난 몇 년 동안 최고의 투자 항목 중 하나였고 오늘날에도 마찬가지입니다. 이 지표는 간단히 비트코인의 매수 수준을 표시합니다. 코알라 BTC 레벨 지표는 깊이 매개변수에 따라 가장 낮은 지점을 결정할 수 있으며, 이 값을 입력값으로 조정할 수 있습니다. 그런 다음 가장 낮은 지점에서 현재 시간까지 선을 확장하고 또한 화살표와 가격 수준을 그려서 어디에서 BTC를 매수해야 하는지를 보여줍니다. 이 지원 수준은 BITCOIN을 구매하기에 가장 좋고 안전한 수준입니다. 그러니 Bit
      FREE
      QualifiedEngulfing
      Ashkan Hazegh Nikrou
      QualifiedEngulfing - ProEngulfing 지표의 무료 버전입니다. ProEngulfing - Advance Engulf 지표의 유료 버전으로, 여기에서 다운로드할 수 있습니다. ProEngulfing 의 무료 버전과 유료 버전의 차이점은 무엇인가요? 무료 버전은 하루에 하나의 신호로 제한되어 있습니다. QualifiedEngulfing을 소개합니다 - MT4용 전문 Engulf 패턴 지표 QualifiedEngulfing을 사용하여 외환 시장에서 자격을 갖춘 Engulf 패턴을 식별하고 강조하는 혁신적인 지표로 정밀력의 힘을 발휘하세요. MetaTrader 4용으로 개발된 QualifiedEngulfing은 Engulf 패턴을 정확하게 인식하고 강조하기 위한 첨단 접근법을 제공하여 거래 결정에 대해 가장 신뢰할 수 있는 신호만을 제공합니다. QualifiedEngulfing 작동 방식: QualifiedEngulfing은 Engulf 패턴을 분석하기 위한 정교한
      FREE
      Koala Trend Line
      Ashkan Hazegh Nikrou
      4.13 (8)
      Koala Trend Line Upgraded To Version 1.2 Last Upgrade Improvement : New Parameter Added that allow user to connect trend line to 2nd or 3th or Xth highest or lowest point. My Request : **Dear Customers Please Release Your Review On Koala Trend Line, And Let Me Improve By Your Feed Backs. Join Koala Trading Solution Channel in mql5 community to find out the latest news about all koala products, join link is below : https://www.mql5.com/en/channels/koalatradingsolution WHAT ABOUT OTHER
      FREE
      Koala Supply Demand
      Ashkan Hazegh Nikrou
      MetaTrader 4용 코알라 공급 및 수요 지표 소개: 코알라 공급 및 수요 지표에 오신 것을 환영합니다. 이 지표는 끊임없는 공급 및 수요 지역을 식별하기 위해 설계되었습니다. 이 지표는 트레이더가 시장을 지역 영역으로 볼 수 있도록 도와주며 가격이 어떻게 강력한 지역을 존중하는지 확인할 수 있습니다. 또한 이 지표는 지역 내에서 형성된 가격 행동 신호를 보여줄 수도 있습니다.  코알라 트레이딩 솔루션 채널 에 가입하여 모든 코알라 제품에 대한 최신 소식을 확인하십시오. 가입 링크는 다음과 같습니다: https://www.mql5.com/en/channels/koalatradingsolution https://www.mql5.com/en/blogs/post/755700 !중요 : 이 제품에는 무료 전문가 고문 (EA)가 포함되어 있습니다. 구매 후에는 MQL5 메신저에서 저에게 연락하여 지표와 연결된 무료 EA를 받아주세요. 중요: 1.2 버전부터 이 인디케이터는 다
      ProEngulfing
      Ashkan Hazegh Nikrou
      4.5 (2)
      ProEngulfing 소개 - MT4용 전문 Engulf 패턴 인디케이터 정밀도의 힘을 발휘하세요. ProEngulfing은 외환 시장에서 자격이 있는 Engulf 패턴을 식별하고 강조하기 위해 설계된 첨단 인디케이터로, MetaTrader 4용으로 개발되었습니다. ProEngulfing은 Engulf 패턴을 정확하게 식별하고 강조하기 위한 철저한 접근 방식을 제공하여 거래 결정에 대한 가장 신뢰할 수 있는 신호만을 제공합니다. ProEngulfing이 작동하는 방식: ProEngulfing은 Engulf 패턴을 분석하기 위해 정교한 알고리즘을 사용하여 패턴 인식 이상의 기능을 제공하여 이러한 패턴이 실제로 자격이 있는지 확인합니다. 다음은 그 작동 방식입니다. 자격 기준: 이 인디케이터는 몸통의 백분율을 전체 양초 크기와 비교하고 그림자의 백분율을 양초 크기와 비교합니다. 이 세심한 평가를 통해 고확률 Engulf 패턴만이 주목받도록 보장됩니다. 연속성 확인: ProEngulf
      Best SAR MT5
      Ashkan Hazegh Nikrou
      5 (1)
      설명 :  우리는 외환 시장(PSAR)에서 전문적이고 인기 있는 지표 중 하나를 기반으로 하는 새로운 무료 지표를 도입하게 된 것을 기쁘게 생각합니다. 이 지표는 원래 포물선 SAR 지표에 대한 새로운 수정이며, 프로 SAR 지표에서 점과 가격 차트 사이의 교차를 볼 수 있습니다. 교차는 신호가 아니지만 이동 가능성의 끝을 말하는 것입니다. 새로운 파란색 점으로 매수를 시작하고 첫 번째 파란색 점 앞에 손절매를 1 attr 배치하고 마지막으로 점이 가격 차트를 교차하는 즉시 종료할 수 있습니다. 매수 또는 매도 신호를 여는 방법은 무엇입니까? 첫 번째 파란색 점으로 공개 매수 거래 및 첫 번째 빨간색 점으로 공개 매도 거래 정확한 손절매는 어디에 있습니까? 안전한 정지 손실은 첫 번째 점에 있을 수 있습니다(구매의 경우 첫 번째 파란색 점, 매도의 경우 첫 번째 빨간색 점) 올바른 이익실현은 어디에 있습니까? 이익실현은 손절매 거리와 RR에 따라 조정할 수 있으므
      FREE
      Accuracy Meter
      Ashkan Hazegh Nikrou
      5 (1)
      Is This tools use able for free in Forex market ? Accuracy Meter is useful and also free product, i made this product for free because i believe that any seller must have some good products for free not just release bad products as free tools. What does Green koala logo mean : Means Free Products , i ll release my free products by green koala logo, so when you see green koala, it means new free products is access able for you. Accuracy Meter Introduction : Accuracy Meter is powerful
      FREE
      Best SAR
      Ashkan Hazegh Nikrou
      5 (3)
      Koala Trading Solution 채널 에 가입하여 MQL5 커뮤니티에서 최신 신호 및 Koala 제품에 대한 소식을 확인하세요. 가입 링크는 아래에 있습니다: https://www.mql5.com/en/channels/koalatradingsolution 설명 :  우리는 외환 시장(PSAR)에서 전문적이고 인기 있는 지표 중 하나를 기반으로 하는 새로운 무료 지표를 도입하게 된 것을 기쁘게 생각합니다. 이 지표는 원래 포물선 SAR 지표에 대한 새로운 수정이며, 프로 SAR 지표에서 점과 가격 차트 사이의 교차를 볼 수 있습니다. 교차는 신호가 아니지만 이동 가능성의 끝을 말하는 것입니다. 새로운 파란색 점으로 매수를 시작하고 첫 번째 파란색 점 앞에 손절매를 1 attr 배치하고 마지막으로 점이 가격 차트를 교차하는 즉시 종료할 수 있습니다. 매수 또는 매도 신호를 여는 방법은 무엇입니까? 첫 번째 파란색 점으로 공개 매수 거래 및 첫 번째 빨간색 점으로 공
      FREE
      Koala Fibo Base Time
      Ashkan Hazegh Nikrou
      3 (1)
      Welcome to Koala Fibo Base Time Welcome to Koala Fibo Time Zone Welcome to Koala Fibo Time Extention Welcome to Missed Tool For Meta Trade! Simple Introduction : Fibonacci Time Zones are vertical lines based on the Fibonacci Sequence. These lines extend along the X axis (date axis) as a mechanism to forecast reversals based on elapsed time. A major low or high is often chosen as the starting point. Distances start relatively small and grow as the Fibonacci Sequence extends. Chartists can exten
      FREE
      Currency Meter Pro
      Ashkan Hazegh Nikrou
      5 (1)
      Simple introduction to currency meter indicator : Currency Meter Is Indicator to determine power of each currency and show them in very simple design This indicator can help you to see power of each currency separately. As you know when GBPUSD goes up, it means GBP going to more power or USD goes more weak, but you cant understand what is the reason of this movement, it was about GBP ? or it was about USD ? To determine GBP power , This indicator, will check all pairs contain GBP and determ
      Koala MT4
      Ashkan Hazegh Nikrou
      Abstract : Welcome to our latest in a profitable yet safe Expert advisor, Koala, which uses stop loss for every open position and does not use a martingale or Grid strategy, thereby reducing the chance of account blow outs.  Koala is the first of its kind to use a built in auto backward optimization engine to pick the best variable values based on a mathematical and statistical analysis of the past 2 weeks data a any point in time.  This novel method of autooptinmization helps this EA adapt itse
      Koala Trend Pro MT4
      Ashkan Hazegh Nikrou
      Koala Trend Line Introduction : I made this indicator to help traders find trend better, this indicator can show you current trend line. As you know trend line must draw between 2 highest or lowest points. So the main logic is to find highest and lowest points. Indicator find all highest and lowest points in history and show them by red and blue dots. These highest and lowest points calculated according to depth value. depth value is adjustable , and user can change it. What does depth mea
      Koala Trade Panel
      Ashkan Hazegh Nikrou
      Welcome to koala MT4 Trading Panel This is professional tool can make trading easy , much faster for you, if you are one of forex manual trader. This tool has nice user interface and easy method to adjust entry, stop loss, take profit by just drag and drop lines. Ability to adjust fix lot size, risk dollars, Magic Number, Equity DD Protector, Trailing stop, Break Even. and also Trailing based on Moving average are more advantages of this tool. What is this panel properties : 1. Open Buy Trade
      Koala Pro Divergence
      Ashkan Hazegh Nikrou
      Description : Koala Pro divergence is not just simple divergence, it's qualified strategy can detect nice divergence signals based on distance from moving line, we know moving average work like gravity, price respect moving line and refer to moving average always, this indicator determine price distance by moving line continuesly and try to choose one of divergance arrows that has enough potential. In this strategy always our target is moving average.
      Market Structure Break Out for MT4를 소개합니다 – 귀하의 전문적인 MSB 및 무결한 존 인디케이터  mql5 커뮤니티의  Koala Trading Solution 채널  에 가입하여 Koala 제품에 관한 최신 뉴스를 확인하세요. 가입 링크는 아래에 있습니다: https://www.mql5.com/en/channels/koalatradingsolution Market Structure Break Out: 시장 파동에 대한 순수한 분석을 위한 당신의 길 이 지표는 시장 구조 및 움직임 파동을 그리고 최적의 MSB 또는 시장 구조 브레이크 아웃을 찾기 위해 설계되었습니다. 시장이 움직이고 최근 구조를 파괴할 때, 이 브레이크 아웃이 얼마나 중요한 요인이었는지를 판단하고, 특정 요인보다 크면 이 브레이크 아웃이 확인된 것으로 간주됩니다. 따라서 이 도구에서는 4가지 중요한 케이스가 있습니다:  시장 구조 파동  확인된 구조 브레이크 아웃 및  파괴되지
      코알라 가격 행동 스캐너 - 가격 행동의 힘을 발휘하다 소개: 새로운 코알라 가격 행동 스캐너를 발견하세요 - 핵심 가격 행동 패턴을 감지하고 직관적인 스캐너 테이블로 표시할 수 있는 다재다능하고 다화폐, 다시간대 도구입니다. 요약: 이 지표는 보통을 넘어 사용자에게 여러 통화 및 시간대에서 주요 가격 행동 패턴을 식별할 수 있는 기능을 제공합니다. 특징: 흡수 패턴 핀바 패턴 도지 패턴 사용자 설정 가능한 설정: 흡수 패턴: 봉 2의 최소 바디 크기: 사용자는 2번째 닫힌 봉의 최소 바디 크기가 얼마나 되어야 하는지 조절할 수 있습니다. 봉 1의 최소 바디 크기: 사용자는 최신으로 닫힌 봉의 최소 바디 크기를 조절할 수 있습니다. 핀바 패턴: 최대 바디 %: 이 매개변수를 사용하여 핀바의 최대 바디 %를 그림 크기와 비교하여 조절할 수 있습니다. 도지 패턴: 최대 작은 바디 크기: 이 매개변수를 사용하여 사용자는 순수한 도지 패턴에서 바디 크기가 0이어야 한다는 것을 알고 있지만
      Smart Engulfing MT5
      Ashkan Hazegh Nikrou
      Smart Engulfing MT5 소개: 정교한 거래의 세계로 들어가 Smart Engulfing MT5로 최상위 Engulf 패턴을 식별하세요. 정밀성과 사용 편의성을 고려하여 디자인된 이 도구는 MetaTrader 5 사용자를 위해 독점적으로 제작되었습니다. Smart Engulfing MT5가 알림, 화살표 및 세 가지 서로 다른 이익 수준으로 안내함으로써 수익성 높은 거래 기회를 쉽게 발견할 수 있으며, 이는 단순함과 효과성을 추구하는 트레이더에게 최고의 동반자입니다. 부분 2: 순수 Engulf 패턴의 힘 발휘 순수 Engulf 패턴 분석기로 시장 움직임의 복잡성에 빠져들어보세요. 전통적인 도구와는 달리 세련된 방식으로 작동하여 관련 없는 패턴을 걸러내고 가장 수익성 있는 기회에만 초점을 맞춥니다. 해당 독특한 알고리즘은 70% 이상의 주목할만한 성공률을 자랑하며 모든 거래가 지적 의사 결정에 기반하도록 보장합니다. 부분 3: 적응형 신호 보기 모드 Smart E
      필터:
      MAKARIOS YACOUBIAN
      2891
      MAKARIOS YACOUBIAN 2022.01.12 08:30 
       

      high quality coded , great tool for price action . thank you Ashkan .

      the seller support for the update was not as promise , there many graphic need to be improved . i will drop my rate from 5 to 3 // 11 march 2022

      Cleverson Santos
      734
      Cleverson Santos 2020.11.08 04:37 
       

      사용자가 평가에 대한 코멘트를 남기지 않았습니다

      리뷰 답변
      버전 1.2 2020.11.05
      New parameter added for adjust percent of body candles in pattern recognition