Sideways Market Statistical Analyzer MT4
- 지표
- Young Ho Seo
- 버전: 8.9
- 업데이트됨: 19 11월 2021
- 활성화: 5
Introduction to Sideways Market Analyzer
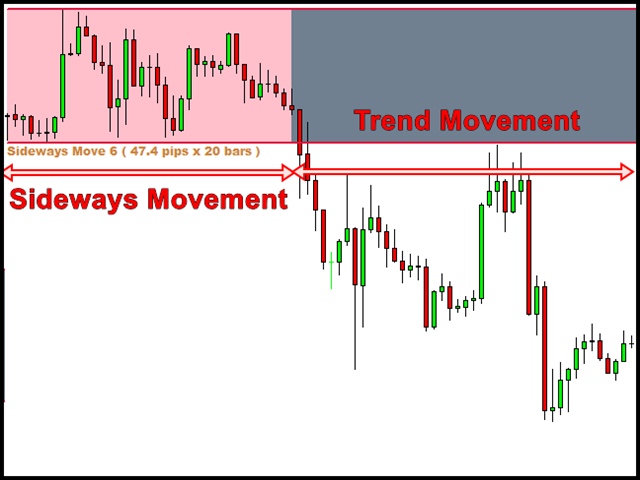
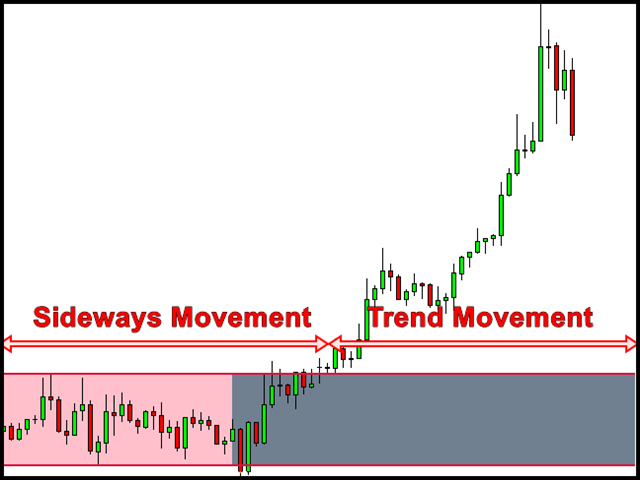
Notable period of Low volatility and non-trending movements in the financial market is considered as Sideways Market. Sooner or later, the low volatility will increase and the price will pick up a trend after Sideways Market. In terms of trading point of view, Sideways Market can serve as the very good entry timing for traders. Sideways Market is also quite often the representation of accumulation of large orders from big investors. Therefore, knowing the presence of Sideways Market can help you to decide good entry and exit timing.
Traditionally, the Average Directional Index (ADX) indicator or moving average of standard deviation indicators was used to roughly determine the presence of Sideways Market. However, both of the indicators are lagging with very low correlation with future price movement. They will not provide you clear idea on when the Sideways Market started and when it ends. Missing all these important information leaves traders with a very uncertain picture on the current market situation.
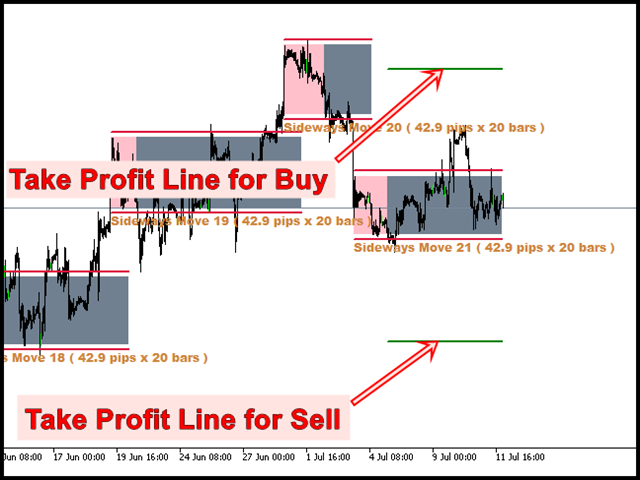
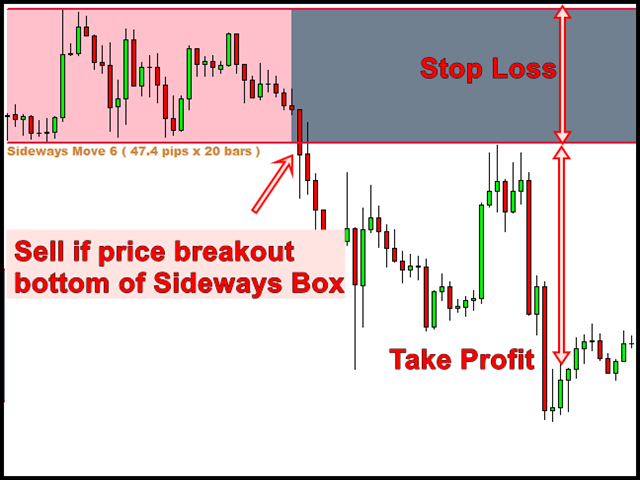
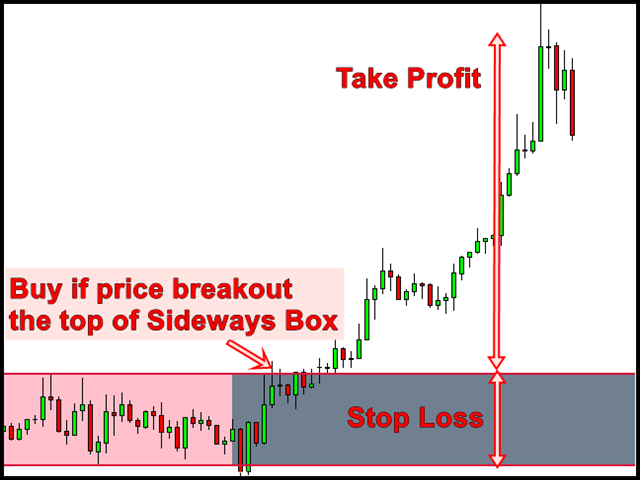
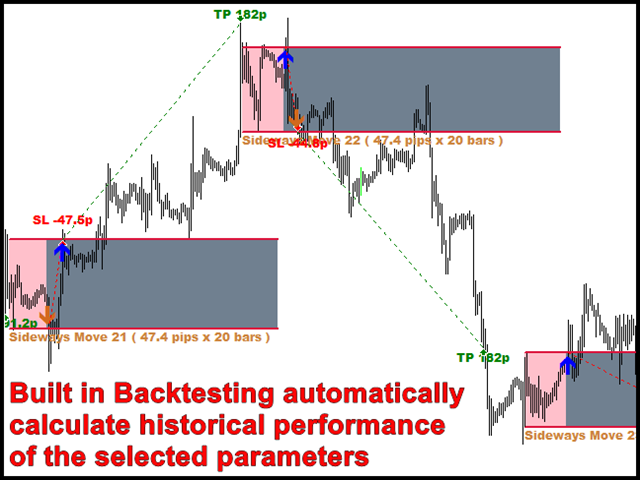
Here we have very accurate Sideways Market Analyzer inspired by the statistical theory. Indeed, this Sideways Market Statistical Analyzer can detect Sideways Market just like human eyes can do. In terms of trading signal, you open a buy order when the price hits the top of the Sideways and you open a sell order when the price hits the bottom of the detected Sideways Box. Sideway Market Analyzer provides you with a fixed stop loss and take profit levels. Sideways Market Statistical Analyzer works well for most of the currency pairs.
| Symbol | Cut Probability | Box Buffer Pips | Take Profit | Lot Multiplier | Total Net Pip gains (9 month) | Monthly Pip Gains |
|---|---|---|---|---|---|---|
| AUDCAD | 0.26 | 2 | 3.2 | 1.6 | 1 519.00 | 159.89 |
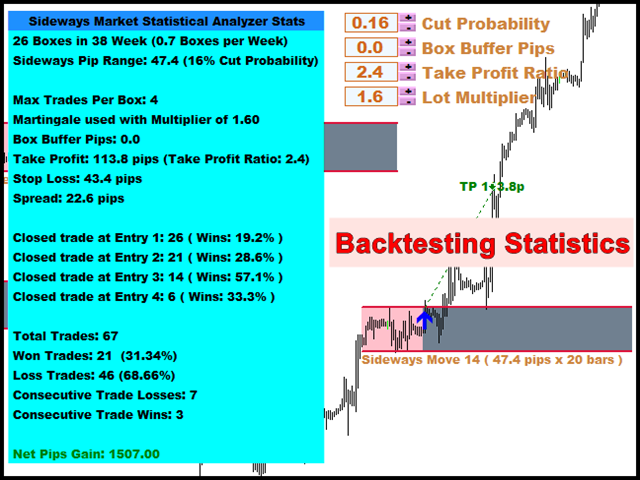
| GBPUSD | 0.16 | 0 | 2.4 | 1.6 | 1 607.60 | 169.22 |
| ERUUSD | 0.34 | 0 | 1.4 | 1.6 | 1 684.00 | 177.26 |
| EURJPY | 0.43 | 0 | 2.6 | 1.6 | 1 550.30 | 163.19 |
| EURAUD | 0.30 | 7 | 2.4 | 1.6 | 3 316.20 | 349.07 |
| Sum | 9 677.10 | 1 018.64 |
For XAUUSD (Gold), Cut Probability = 0.15, Box Buffer Pips =0, Take Profit = 1.3, Lot Multiplier = 1.6 return the total Net Pip gains of 27 265 pips during 9 month period and Monthly pip gains is 2 870 pips. So, it works very well for Gold, too.
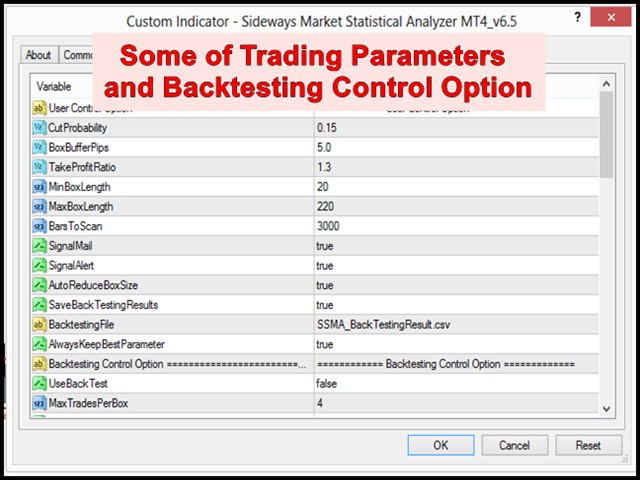
Important Trading Parameters
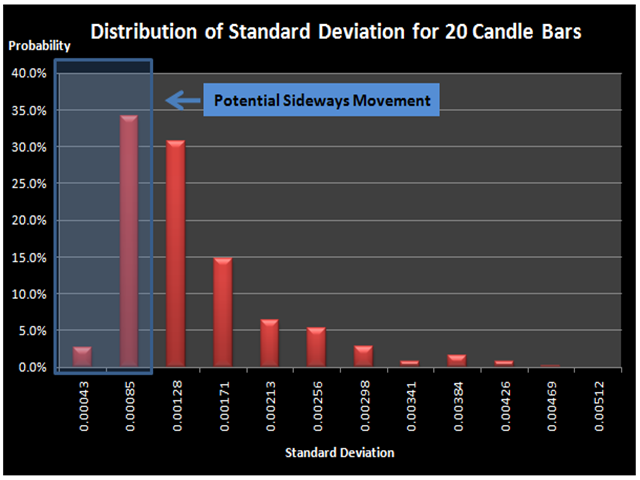
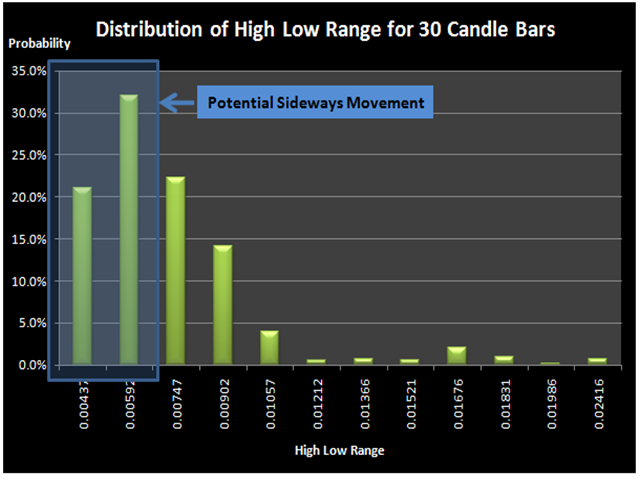
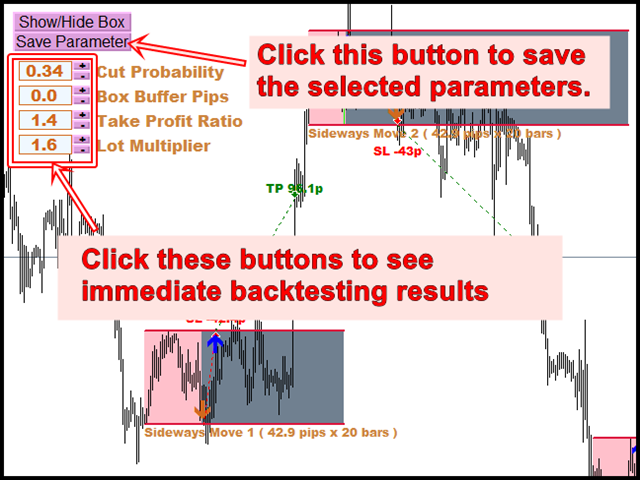
- Cut Probability – you can enter from 0.01 to 0.99. The value will mostly stay between 0.05 and 0.5. This cut probability is the criteria to qualify the Sideways Movement of the current group of candle bars based on the probability distribution.
- Box Buffer Pips – you can enter from 0 to 100. The value will mostly stay between 0 and 10. The pip value is the offset distance from the detected Sideways Market. This will be represented by the long horizontal line above and below the detected Sideways Market on your chart. This line can be used as the trigger point for your buy and sell orders.
- Take Profit Ratio – the Ratio of your take profit pips/box height. The value will mostly stay between 1 and 3. 1 indicates that your take profit's pips are equal to the height of the box.
- Lot Multiplier – Lot Multiplier is used when your previous trading hits stop loss. The value will mostly stay between 1.5 and 2.0. It is recommended to use the value less than 1.7.
Trading Strategy Guide
You can use Sideways Market Analzyer together with any of following technical analysis. In general, combining one or two price action analysis can improve the trading accuracy. This is the known fact confirmed by many experienced trader.
Guide for Volume Spread Analysis
Guide for Harmonic Pattern Detection Indicator
Guide for Supply Demand Indicator
Guide for Triangle Pattern, Falling Wedge Pattern, Rising Wedge Pattern and Channel
Guide for Elliott Wave Indicator
Important Note
This is the off the shelf product. Therefore, we do not accept any modification or customization request on this product. In addition, we do not provide any code library or any support for your coding for this product.


Sideway Market very unique product it really detect sideway and giving signal when to enter and wait, well worth purchase for 2023!