Key Volumes MT5
- 지표
- Pavel Verveyko
- 버전: 1.2
- 업데이트됨: 27 11월 2020
- 활성화: 5
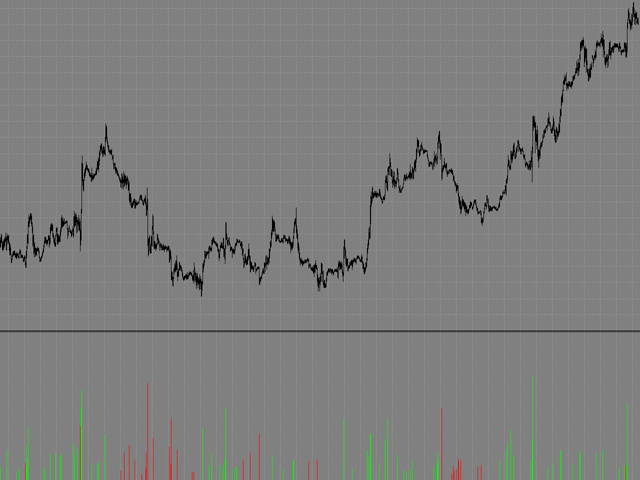
The indicator shows key volumes confirmed by the price movement.
The indicator allows you to analyze volumes in the direction, frequency of occurrence, and their value.
There are 2 modes of operation: taking into account the trend and not taking into account the trend (if the parameter Period_Trend = 0, then the trend is not taken into account; if the parameter Period_Trend is greater than zero, then the trend is taken into account in volumes).
The indicator does not redraw.
Settings
- History_Size - the amount of history for calculation.
- Period_Candle - volatility period.
- Mult_RS - volatility ratio.
- Period_Trend - trend period. (if Period_Trend = 0, the trend is ignored)
- Send_Sound - sound alert.
- Send_Mail - send an email notification.
- Send_Notification - send a mobile notification.
- Send_Alert - standard terminal alert.