• 미리보기
  • 리뷰 (4)
  • 코멘트
  • 새 소식

Boundaries Weekly

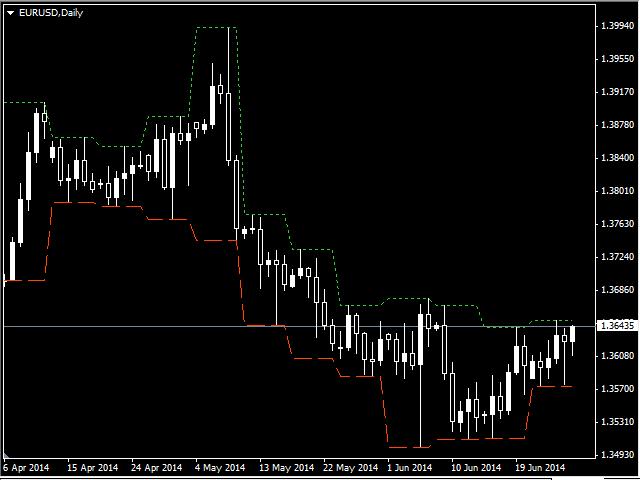
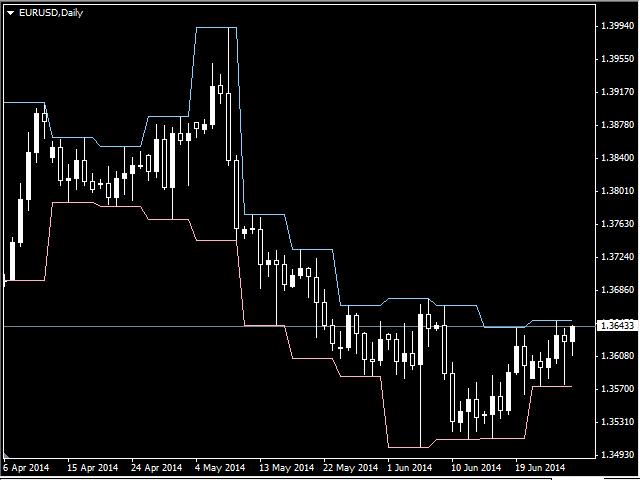
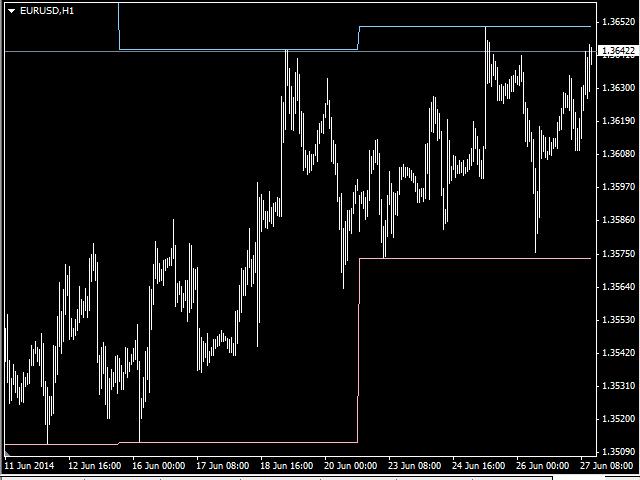
This indicator works exactly the same as the Boundaries indicator, but here as a free demo that only shows the high and low of the week.

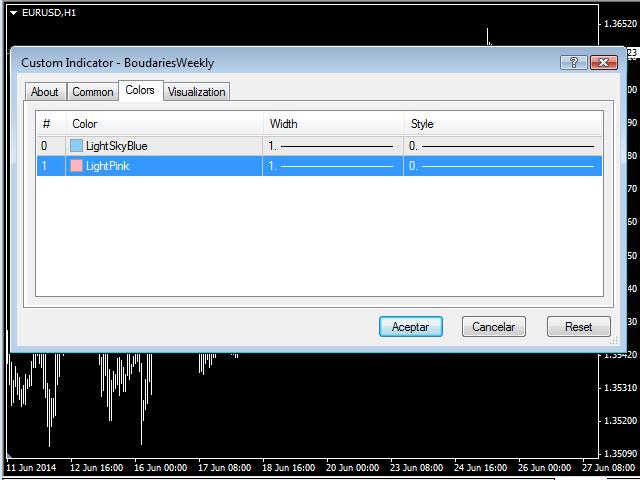
As the Boundaries indicator does, this indicator can work with any symbol. In the Colors tab you can set the color for the Upper and Lower boundaries.

Please review the pics or watch the Boundaries indicator video to better understand how it works.

추천 제품
Trend Flasher
Amarnath K M
Trend Flasher Trend is your friend is the age old saying quote in trading arena, there are though many ways to gauge the trend and its direction, more scientific measure and logically meaningful will be an ATR break outs to identify and spot the trend and its acceleration, so we created this easy to use trend identification panel and optimized super trend based multi time frame panel entry system to aid and help the traders to make their trading decision. Unique Features of Trend Flasher 1
Trend PA
Mikhail Nazarenko
5 (3)
The Trend PA indicator uses   Price Action   and its own filtering algorithm to determine the trend. This approach helps to accurately determine entry points and the current trend on any timeframe. The indicator uses its own algorithm for analyzing price changes and Price Action. Which gives you the advantage of recognizing, without delay, a new nascent trend with fewer false positives. Trend filtering conditions can be selected in the settings individually for your trading style. The indicator
AndInvest Impulse
Bruno Ravardiere De Oliveira Goncalves
Em uma negociação no Mercado Financeiro nada é mais importante que saber o momento certo de entrar em uma negociação. O AndInvest Impulse auxilia traders a capturar o momento exato de abrir uma negociação, para isto ele desenha topos e fundos facilitando a leitura do Price Action e após um breve momento de realização do mercado ele identifica o retorno da ponta compradora ou vendedora de força antecipada e sem repintura. Comprovação de Resultados: https://youtu.be/CA1_ZtZY0vk Funciona em qualque
Limitless MT4
Dmitriy Kashevich
Limitless MT4 is a universal indicator suitable for every beginner and experienced trader. works on all currency pairs, cryptocurrencies, raw stocks Limitless MT4 - already configured and does not require additional configuration And now the main thing Why Limitless MT4? 1 complete lack of redrawing 2 two years of testing by the best specialists in trading 3 the accuracy of correct signals exceeds 80% 4 performed well in trading during news releases Trading rules 1 buy signa
Oscillator The Trend Signal indicator is an indicator designed to generate trend signals. It uses its own set of algorithms and the moving average indicator to find signals. It has the feature of filtering the signals with the channel system. In this way, it tries to improve the quality of the signals. Features and Trade strategy There are two channels in the indicator. These channels are 70 and -70 channels. You will reach the signals without losing time thanks to the alarm features found on
Mk R
Can Pei Pu
MK_R It is based on contrary patterns for EURUSD.  Basically, it will entry using the condition of 1 buy wave and 6 sell wave of Granville's law. The EA does not use indicators, grid, martingale, arbitrage.  The EA has been proven to be profitable in the six months of 2020 and is particularly suitable for the current EURUSD market since mid-December 2020. Monitoring: https://www.mql5.com/en/signals/789229 Timeframe is M5. EA needs M1 chart,M5 chart,M15 Chart,H1 chart,H4 chart. Maxium Sp
AMAN Signals
Niravkumar Maganbhai Patel
Introducing AMAN Signals. An MT4 Indicator that predicts the trend where the prices are heading! Indicator parameters Period 1 : the number of bars used for the indicator calculations. Proper values - Above 21. Multiplier 1 : Proper values - from: 5. Period 2 : the number of bars used for the indicator calculations. Proper values - Above 21. Multiplier 1 : Proper values - from: 5. Using the AMAN Signals FAST Indicator: Green: Buy or Bullish Candle Red: Sell or Bearish Candle Strength Percent
Five Candles Pattern
Miguel Antonio Rojas Martinez
The "Five Candle Pattern" indicator is a novel way to see the market, because with it we can compare and/or seek training or the pattern of the past 4 or 5 Candles, and identify them in the same graph, to view your behavior at an earlier time. The indicator creates a pattern of those 4 or 5 candles and searches backward, identifies, and marks the same formation or pattern. With that information you adjust the strategy that is operating, or create a new one, because you can compare the past devel
VR Cub
Vladimir Pastushak
VR Cub 은 고품질 진입점을 얻는 지표입니다. 이 지표는 수학적 계산을 용이하게 하고 포지션 진입점 검색을 단순화하기 위해 개발되었습니다. 지표가 작성된 거래 전략은 수년 동안 그 효율성을 입증해 왔습니다. 거래 전략의 단순성은 초보 거래자라도 성공적으로 거래할 수 있다는 큰 장점입니다. VR Cub은 포지션 개시 지점과 이익 실현 및 손절매 목표 수준을 계산하여 효율성과 사용 편의성을 크게 높입니다. 간단한 거래 규칙을 이해하려면 아래 전략을 사용한 거래 스크린샷을 살펴보세요. 설정, 세트 파일, 데모 버전, 지침, 문제 해결 등은 다음에서 얻을 수 있습니다. [블로그] 다음에서 리뷰를 읽거나 작성할 수 있습니다. [링크] 버전 [MetaTrader 5] 진입점 계산 규칙 포지션 개설 진입점을 계산하려면 VR Cub 도구를 마지막 최고점에서 마지막 최저점까지 늘려야 합니다. 첫 번째 지점이 두 번째 지점보다 빠른 경우, 거래자는 막대가 중간선 위에서 마감될 때까지 기다립
Signal From Level
Yaroslav Varankin
Binary Options Support Resistance Indicator This indicator is designed for binary options trading and effectively shows retracements from support and resistance levels. Signals appear on the current candle. A red arrow pointing downwards indicates a potential selling opportunity, while a blue arrow pointing upwards suggests buying opportunities. All that needs adjustment is the color of the signal arrows. It is recommended to use it on the M1-M5 timeframes as signals are frequent on these timef
ADR Scalping Indicator MT4
Robert Mathias Bernt Larsson
이것은 가격 행동에 대한 대부분의 통찰력을 제공하는 가장 간과되기 쉬운 지표입니다. 그것은 내가 나 자신을 사용하는 유일한 지표입니다. 이 지표는 오늘 가격이 얼마나 움직일 것이며 어떤 방향으로 움직일 것인지에 대한 통찰력을 제공합니다. ADR은 평균 일일 범위를 나타냅니다. 인트라데이나 스캘핑을 한다면 가격이 얼마나 움직일지 범위를 알아야 합니다. 가격이 하루 정상치의 절반으로 움직였다고 가정하고 가격 행동의 바닥에 있다고 가정해 보겠습니다. 가격이 일일 평균 범위에 도달하기 위해 완전히 다시 오르기보다는 계속해서 하락할 가능성이 더 큽니다. 가격은 항상 평균 일일 범위에서 움직이려고 합니다. 당신은 또한 역동적인 지원과 저항을 받게 될 것입니다. 가격이 평균 범위만큼 이동하면 중간으로 거래 할 수 있습니다. 이 표시기는 가격이 추세선에서 반등할 가능성이 있는지 여부도 알려줍니다. 따라서 추세선을 사용하여 거래하고 싶다면 이것이 지표입니다! 3가지 종류의 범
Crosskalp1
Mikhail Bilan
Добрый День уважаемые трейдеры!  Вашему вниманию индикатор созданный и работающий на базе трендовика ADX,  для торговли на смене направления движения который учитывает коррекцию и даёт возможность на ней заработать.  Применяю этот индикатор для скальпинга. Рекомендую таймфреймы от 15 ти минутного(М15) до часового (Н1) периодов.  Красный кружок сигнал на продажу- Sell) Зелёный кружок  сигнал на покупку Buy) Чем меньше ваш таймфрейм тем меньше пунктов вы зарабатываете.   Важно выставлять стопы! !В
Srcci
Jorge Alejandro Agudelo Alvarez
SRCCI An indicator based on RCCI , is a combination of the RSI and CCI indicators, adapted into three levels categorized into A, B and C. Taking advantage of their combination to maintain a controlled filter and applicable to different strategies. The RSI (Relative Strength Index) is one of the most popular and used oscillators to operate in the markets. It is a valuable tool to measure both the speed of price changes and the possible levels of overbought or overbought. The CCI (Commodity Channe
TLM Map AM
Andriy Matviyevs'kyy
TLM Map AM (Trend Line Momentum Map) is an indicator developed based on a set of digital technical analysis indicators described in the article by Vladimir Kravchuk: " Digital indicators in the technical analysis of financial markets ". The indicator displays in a separate window a complex of digital technical analysis indicators such as FTLM and STLM. Recommended for use in conjunction with the RTL Map AM (Reference Trend Line Map) indicator. The indicator has no customizable parameters.
FREE
Big Trend Signal   indicator is designed for trend and signal trading. This indicator generates trend signals.  It uses many algorithms and indicators to generate this signal. It tries to generate a signal from the points with the highest trend potential. This indicator is a complete trading product. This indicator does not need any additional indicators.  You can only trade with this indicator. The generated signals are displayed on the graphical screen.  Thanks to the alert features you can ge
Trend Direction ADX indicator for MT4
Renaud Herve Francois Candel
Trend Direction ADX indicator for MT4 Trend Direction ADX is part of a series of indicators used to characterize market conditions. Almost any strategy only work under certain market conditions. Therefore it is important to be able to characterize market conditions at any time: trend direction, trend strength, volatility, etc.. Trend Direction ADX is an indicator to be used to characterize trend direction: trending up trending down ranging Trend Direction ADX is based on ADX standard indi
이 표시기는 거래자의 요구 사항에 따라 차트를 더 깔끔하게 만들기 위해 활성화/비활성화할 수 있는 최대 6개 레벨을 표시합니다. 이 6단계는 높음과 낮음의 2세트로 구성되어 있습니다. 각 세트에 대해 다른 시간대를 선택할 수 있습니다. 가격이 일일, 주간 또는 월간 고가에 도달할 때 일반적으로 5분과 같은 더 작은 시간 프레임에서 거부를 나타내는 것으로 간주되므로 이전 고가 반전 전략을 기반으로 합니다. 특징 : - 단일 차트에서 최대 6개의 시간대 고저를 추적합니다. - 이 수준, 메일, 푸시 또는 터미널 알림에 대한 알림을 설정합니다. 가격이 이러한 수준에 도달하면 즉시 알림을 받게 됩니다. - 선 스타일, 너비, 색상 등을 포함한 레벨 스타일 사용자 정의 - Shift : 2일차 또는 3일차의 High Low를 추적하거나 조사하고 싶으십니까? 두 번째 막대의 높음 낮음에 대해 2로, 세 번째 막대의 높음 낮음에 대해 3으로 이동을 설정할 수 있습니
The Polarized Fractal Efficiency (PFE) was introduced by Hans Hannula in 1994. The indicator was intended to quantify the efficiency of price movement and  how trendy or choppy  the recent past price action has been. This is calculated by contrasting the price traveled in the window of study  against the total accumulation of movements during the same period of time. For example: If in 10 days, an active raised from 50 to 100, by increasing it's value 5 points or dollars each session, the effici
PABT Pattern Indicator - it's classical system one of the signal patterns. Indicator logic - the Hi & Lo of the bar is fully within the range of the preceding bar, look to trade them as pullback in trend. In the way if indicator found PABT pattern it's drawing two lines and arrow what showing trend way.  - First line - it's entry point and drawing at: 1. On the high of signal bar or on middle of the signal bar (depending from indicator mode) for buy; 2. On the low of signal bar or on middle of t
Heat Candle
Rodolfo Leonardo De Morais
The volume is a graphical indicator that shows the number of shares traded in a specified period (for example, minutes / hours / days / weeks / months, etc.) for a particular asset. Volume analysis is a basic, yet very important, element of technical analysis. It provides clues as to the intensity of price movements. In addition, the volume can confirm the strength of a trend. Standard candles do not provide a visual way of looking at buying power and selling power. With that in mind, I crea
This Indicator is use the ZigZag to calculate the Upper and  Lower Bound and the uptrend and the downtrned. Red for downtrend, Green for uptrend and Yellow is for the horizontal trend this horizontal trend also bookmarked the upper limited and the lower limited the the price swings.  Or in simple the Support and the Resistance level. However, You may use the Heikin Ashi to confirm the trend of the buy sell signal above. I cannot guarantee the win rate, Nevertheless, you must study well the timef
Infinity Trend Pro
Yaroslav Varankin
1 (1)
This is a trend indicator without redrawing Developed instead of the binary options strategy (by the color of the Martingale candlestick) Also works well in forex trading When to open trades (binary options) A signal will appear in the place with a candle signaling the current candle It is recommended to open a deal for one candle of the current timeframe M1 and M5 When a blue dot appears, open a deal up When a red dot appears, open a trade down. How to open trades on Forex. When a signal is rec
Owl smart levels
Sergey Ermolov
4.63 (54)
MT5 버전  |   FAQ Owl Smart Levels Indicator 는   Bill Williams 의 고급 프랙탈, 시장의 올바른 파동 구조를 구축하는 Valable ZigZag, 정확한 진입 수준을 표시하는 피보나치 수준과 같은 인기 있는 시장 분석 도구를 포함하는 하나의 지표 내에서 완전한 거래 시스템입니다. 시장과 이익을 취하는 장소로. 전략에 대한 자세한 설명 표시기 작업에 대한 지침 고문-거래 올빼미 도우미의 조수 개인 사용자 채팅 ->구입 후 나에게 쓰기,나는 개인 채팅에 당신을 추가하고 거기에 모든 보너스를 다운로드 할 수 있습니다 힘은 단순함에 있습니다! Owl Smart Levels   거래 시스템은 사용하기 매우 쉽기 때문에 전문가와 이제 막 시장을 연구하고 스스로 거래 전략을 선택하기 시작한 사람들 모두에게 적합합니다. 전략 및 지표에는 눈에 보이지 않는 비밀 공식 및 계산 방법이 없으며 모든 전략 지표는 공개되어 있습니다. Owl Smart Lev
GMMA Trade X is an EA based on GMMA. GMMA parameters such as MovingAveragePeriod1-24, MovingAverageMAShift1-24, MovingAverageShift1-24 and CandlestickShift1-24 can be adjusted. GMMA Trade X applies BTN TECHNOLOGY's state-of-the-art intelligent technology to help you create optimal results for your trades. May your dreams come true through GMMA Trade X. Good luck. = == == Inquiries = == == E-Mail:support@btntechfx.com
BSA Indicator
Ahmet Metin Yilmaz
BSA indicator is a ZigZag based indicator. This indicator is used to find the reversal level of the price. You can use the existing risk ratio and calculation timeframe in the entries by optimizing them according to your usage preference.  In lower time frames, the indicator can repaint. For healthier results, you can detect the least repainting by observing for a while according to the graphic you will apply.
True Magic Oscillator
Muhammed Emin Ugur
The   True Magic Oscillator   indicator is designed for signal trading. This indicator generates trend signals. It uses many algorithms and indicators to generate this signal. It tries to generate signals from the points with the highest trend potential. This indicator is a complete trading product. This indicator does not need any additional indicators. The indicator is never repainted. The point at which the signal is given does not change.         Features and Recommendations Wor
CRAZY SALE! Was 250, NOW 50 USD till the end of MAY!!! --->  Check all the other products  <--- The WTR Dynamic Range Indicator is a powerful and deeply customizable range indicator that takes in account the average upward and downward movement of the price in the past trading days.  This fully customizable indicator can be setted for a lot of uses and cases:  • Trend trading on level breakouts  • Spotting high probability targets for Take Profits • Setting a multiple targets for position
Trend Sniper Super Indicator is one of the best indicator which can provide you will perfect signals for short term and long term trades. This indicator is suitable for both scalping and swing trading strategies. The indicator is over 85% accurate. It uses terminal Message Alerts, Emails and Push notifications to your mobile device to inform you about the new trading opportunities and it will calculate the take profit and stop loss level for you. All you will need to do is to place a trade. Subs
Klinger Volume Oscillator
Demetrios Kostopoulos
Or (KVO) determines the long-term trend of money flow while remaining sensitive enough to detect short-term fluctuations.It u ses the key price compared to the prior bar's key price to assign volume as positive or negative value. Volume is a measure of how many units of a pair are trading per unit of time.You can choose between a KVO line, histogram, or both combined with this Klinger Volme Oscillator.The Klinger Volume Oscillator is a trend reversal indicator. It relies on the concept of a vol
Day Trades Resistance and Support (daytradesSR) is an indicator composed of 1.  The main line (support/resistance line),  which shows i.    either UP or DOWN trend ii.  levels of dynamic support or resistance    2.     A specific range  defined by a line for range high and another line for range low.   These lines serve as weak secondary support or resistance .    3.   When the main line (support/resistance line) is first hit by the price after a detected trend reversal , either an UP ARROW (sup
이 제품의 구매자들이 또한 구매함
Gann Made Easy
Oleg Rodin
4.96 (47)
Gann Made Easy 는 mr.의 이론을 사용하여 최고의 거래 원칙을 기반으로 하는 전문적이고 사용하기 쉬운 Forex 거래 시스템입니다. W.D. 간. 이 표시기는 Stop Loss 및 Take Profit Levels를 포함하여 정확한 BUY 및 SELL 신호를 제공합니다. PUSH 알림을 사용하여 이동 중에도 거래할 수 있습니다. 구매 후 연락주세요! 내 거래 팁과 훌륭한 보너스 지표를 무료로 공유하겠습니다! 아마도 Gann 거래 방법에 대해 이미 여러 번 들었을 것입니다. 일반적으로 Gann의 이론은 초보자 거래자뿐만 아니라 이미 거래 경험이 있는 사람들에게도 매우 복잡한 것입니다. Gann의 거래 방식은 이론적으로 적용하기 쉽지 않기 때문입니다. 나는 그 지식을 연마하고 Forex 지표에 최고의 원칙을 적용하기 위해 몇 년을 보냈습니다. 표시기는 적용하기가 매우 쉽습니다. 차트에 첨부하고 간단한 거래 권장 사항을 따르기만 하면 됩니다. 지표는 지속적으로 시장 분석 작업
Atomic Analyst
Issam Kassas
5 (2)
우선적으로 언급할 점은이 거래 지표가 다시 그리지 않고 지연되지 않으며 이를 통해 수동 및 로봇 거래 모두에 이상적이라는 점입니다. Atomic Analyst는 가격의 강도와 모멘텀을 활용하여 시장에서 더 나은 이점을 찾는 PA Price Action Indicator입니다. 고급 필터를 장착하여 잡음과 거짓 신호를 제거하고 거래 잠재력을 높이는 데 도움이 됩니다. 복잡한 지표의 다중 레이어를 사용하여 Atomic Analyst는 차트를 스캔하고 복잡한 수학적 계산을 간단한 신호와 색상으로 변환하여 초보 트레이더가 이해하고 일관된 거래 결정을 내릴 수 있도록합니다. "Atomic Analyst"는 새로운 및 경험이 풍부한 트레이더를위한 종합적인 거래 솔루션입니다. 프리미엄 지표와 최고 수준의 기능을 하나의 거래 전략에 결합하여 모든 종류의 트레이더에 대한 다재다능한 선택지가되었습니다. 인트라데이 거래 및 스캘핑 전략 : 빠르고 정확한 일일 거래 및 단기 거래를 위해 설계
TPSproTREND PrO
Roman Podpora
5 (15)
TPSpro TRENDPRO  - is a trend indicator that automatically analyzes the market and provides information about the trend and each of its changes, as well as giving signals for entering trades without redrawing! The indicator uses each candle, analyzing them separately. referring to different impulses - up or down impulse. Exact entry points into transactions for currencies, crypto, metals, stocks, indices!  -  Version MT5               DETAILED DESCRIPTION        /       TRADING SETUPS           
Advanced Currency Strength28 Indicator
Bernhard Schweigert
4.9 (663)
현재 26% 할인 초보자 또는 전문가 트레이더를 위한 최고의 솔루션! 이 지표는 우리가 독점 기능과 새로운 공식을 통합했기 때문에 독특하고 고품질이며 저렴한 거래 도구입니다. 단 하나의 차트로 28 Forex 쌍의 통화 강도를 읽을 수 있습니다! 새로운 추세 또는 스캘핑 기회의 정확한 트리거 포인트를 정확히 찾아낼 수 있기 때문에 거래가 어떻게 개선될지 상상해 보십시오. 사용 설명서: 여기를 클릭  https://www.mql5.com/en/blogs/post/697384 그것이 첫 번째, 원본입니다! 쓸모없는 지망생 클론을 사지 마십시오. 더 스페셜  강력한 통화 모멘텀을 보여주는 하위 창의 화살표 GAP가 거래를 안내합니다! 기본 또는 호가 통화가 과매도/과매도 영역(외부 시장 피보나치 수준)에 있을 때 개별 차트의 기본 창에 경고 표시가 나타납니다. 통화 강도가 외부 범위에서 떨어질 때 풀백/반전 경고. 교차 패턴의 특별 경고 추세를 빠르게 볼 수 있는
Scalper Vault
Oleg Rodin
5 (27)
Scalper Vault 는 성공적인 스캘핑에 필요한 모든 것을 제공하는 전문 스캘핑 시스템입니다. 이 표시기는 외환 및 바이너리 옵션 거래자가 사용할 수 있는 완전한 거래 시스템입니다. 권장 시간 프레임은 M5입니다. 시스템은 추세 방향으로 정확한 화살표 신호를 제공합니다. 또한 상단 및 하단 신호와 Gann 시장 수준을 제공합니다.  이 시스템은 사용하기가 매우 쉽습니다. 원하는 시장 지역의 화살표만 따라가면 됩니다. 엑시트는 가격이 적정 수준에 도달하거나 시장의 고점 또는 저점 신호가 나타날 때 수행됩니다.  표시기는 PUSH 알림을 포함한 모든 유형의 경고를 제공합니다. 인디케이터 구매 후 연락주세요. 내 개인 거래 권장 사항과 훌륭한 보너스 지표를 무료로 공유합니다! 나는 당신에게 행복하고 유익한 거래를 기원합니다!
우선적으로, 이 거래 도구는 전문적인 거래에 이상적인 비-다시 그리기 및 지연되지 않는 지표입니다.  스마트 가격 액션 컨셉트 인디케이터는 신규 및 경험 많은 트레이더 모두에게 매우 강력한 도구입니다. Inner Circle Trader Analysis 및 Smart Money Concepts Trading Strategies와 같은 고급 거래 아이디어를 결합하여 20가지 이상의 유용한 지표를 하나로 결합합니다. 이 인디케이터는 스마트 머니 컨셉트에 중점을 두어 대형 기관의 거래 방식을 제공하고 이동을 예측하는 데 도움을 줍니다.  특히 유동성 분석에 뛰어나 기관이 어떻게 거래하는지 이해하는 데 도움을 줍니다. 시장 트렌드를 예측하고 가격 변동을 신중하게 분석하는 데 탁월합니다. 귀하의 거래를 기관 전략에 맞추어 시장의 동향에 대해 더 정확한 예측을 할 수 있습니다. 이 인디케이터는 시장 구조를 분석하고 중요한 주문 블록을 식별하고 다양한 패턴을 인식하는 데 뛰어납니다. 
현재 20% 할인 ! 초보자 또는 전문가 트레이더를 위한 최고의 솔루션! 이 대시보드 소프트웨어는 28개의 통화 쌍에서 작동합니다. 2가지 주요 지표(Advanced Currency Strength 28 및 Advanced Currency Impulse)를 기반으로 합니다. 전체 Forex 시장에 대한 훌륭한 개요를 제공합니다. 고급 통화 강도 값, 통화 이동 속도 및 모든(9) 시간대의 28 Forex 쌍에 대한 신호를 보여줍니다. 추세 및/또는 스캘핑 기회를 정확히 파악하기 위해 차트의 단일 지표를 사용하여 전체 시장을 볼 수 있을 때 거래가 어떻게 개선될지 상상해 보십시오! 잠재적인 거래를 식별하고 확인하면서 강력한 통화와 약한 통화를 더욱 쉽게 식별할 수 있도록 이 지표에 기능을 내장했습니다. 이 표시기는 통화의 강세 또는 약세가 증가 또는 감소하는지 여부와 모든 시간대에서 수행되는 방식을 그래픽으로 보여줍니다. 추가된 새로운 기능은 현재 시장 조건 변화에 적
Scalper Inside PRO
Alexey Minkov
4.75 (55)
SALE NOW! Limited Time Offer! An exclusive indicator that utilizes an innovative algorithm to swiftly and accurately determine the market trend. The indicator automatically calculates opening, closing, and profit levels, providing detailed trading statistics. With these features, you can choose the most appropriate trading instrument for the current market conditions. Additionally, you can easily integrate your own arrow indicators into Scalper Inside Pro to quickly evaluate their statistics and
TPSpro RFI Levels
Roman Podpora
5 (13)
A key element in trading is zones or levels from which decisions to buy or sell a trading instrument are made. Despite attempts by major players to conceal their presence in the market, they inevitably leave traces. Our task was to learn how to identify these traces and interpret them correctly. Reversal First Impulse levels (RFI)   -  Version MT5                INSTRUCTIONS                 RUS                 ENG                                       R ecommended to use with an indicator   -  
Quantum Trend Sniper Indicator MT4
Bogdan Ion Puscasu
4.59 (39)
소개       Quantum Trend Sniper Indicator는   추세 반전을 식별하고 거래하는 방식을 변화시키는 획기적인 MQL5 지표입니다! 13년 이상의 거래 경험을 가진 숙련된 트레이더 팀이 개발한       Quantum Trend Sniper 표시기       매우 높은 정확도로 추세 반전을 식별하는 혁신적인 방법으로 거래 여정을 새로운 차원으로 끌어올리도록 설계되었습니다. ***Quantum Trend Sniper Indicator를 구입하면 Quantum Breakout Indicator를 무료로 받을 수 있습니다!*** Quantum Trend Sniper Indicator는 추세 반전을 식별하고 세 가지 이익실현 수준을 제안할 때 경고, 신호 화살표를 제공합니다. 초보자 거래자와 전문 거래자 모두에게 적합합니다. Quantum EA 채널:       여기를 클릭하세요 MT5 버전:       여기를 클릭하세요
Market Reversal Alerts
LEE SAMSON
4.21 (121)
가격이 역전되고 후퇴함에 따라 시장 구조가 변경됩니다. 시장 구조 반전 경고 표시기는 추세 또는 가격 움직임이 고갈에 가까워지고 반전할 준비가 되었음을 식별합니다. 일반적으로 반전이나 큰 하락이 일어나려고 할 때 발생하는 시장 구조의 변화를 알려줍니다. 지표는 가능한 고갈 지점 근처에서 새로운 고점 또는 저점이 형성될 때마다 초기에 돌파와 가격 모멘텀을 식별합니다. 표시기는 반대쪽에 있는 마지막 촛불에 직사각형을 그립니다. 그런 다음 현재의 단기 추세에서 계속 움직이기 때문에 가격과 함께 직사각형을 따라갈 것입니다. 가격이 사각형 위나 아래로 다시 닫힐 정도로 약해지면 시장 구조에 잠재적인 변화가 일어나고 있음을 나타냅니다. 그런 다음 표시기는 방향의 잠재적인 이동과 추세 또는 주요 하락의 가능한 반전 시작에 대해 경고합니다. 작동 방식을 보려면 아래의 작동 표시기를 참조하십시오! 여기에서 모든 쌍 및 기간을 모니터링하기 위한 선택적 대시보드 추가 기능: https://
Trend Screener
STE S.S.COMPANY
4.83 (86)
트렌드 표시기, 트렌드 트레이딩 및 필터링을 위한 획기적인 고유 솔루션, 하나의 도구 안에 내장된 모든 중요한 트렌드 기능! Forex, 상품, 암호 화폐, 지수 및 주식과 같은 모든 기호/도구에 사용할 수 있는 100% 다시 칠하지 않는 다중 시간 프레임 및 다중 통화 표시기입니다. Trend Screener는 차트에 점이 있는 화살표 추세 신호를 제공하는 효율적인 지표 추세 추종 지표입니다. 추세 분석기 표시기에서 사용할 수 있는 기능: 1. 트렌드 스캐너. 2. 최대 이익 분석이 있는 추세선. 3. 추세 통화 강도 측정기. 4. 경고가 있는 추세 반전 점. 5. 경고가 있는 강력한 추세 점. 6. 추세 화살표 Trend Screener Indicator가 있는 일일 분석 예, 일일 신호 성능...등은 여기에서 찾을 수 있습니다.   여기를 클릭하십시오. LIMITED TIME OFFER : Trend Screener Indicator는 50 $ 및 평생 동안만 사용할 수 있
Quantum Breakout Indicator PRO
Bogdan Ion Puscasu
4.96 (26)
소개       Quantum Breakout PRO   , 브레이크아웃 존 거래 방식을 변화시키는 획기적인 MQL5 지표! 13년 이상의 거래 경험을 가진 숙련된 트레이더 팀이 개발한   Quantum Breakout PRO는   혁신적이고 역동적인 브레이크아웃 영역 전략으로 거래 여정을 새로운 차원으로 끌어올리도록 설계되었습니다. Quantum Breakout Indicator는 5개의 이익 목표 영역이 있는 브레이크아웃 영역의 신호 화살표와 브레이크아웃 상자를 기반으로 한 손절 제안을 제공합니다. 초보자 거래자와 전문 거래자 모두에게 적합합니다. Quantum EA 채널:       여기를 클릭하세요 MT5 버전 :   여기를 클릭하세요 중요한! 구매 후 설치 매뉴얼을 받으려면 개인 메시지를 보내주십시오. 추천: 기간: M15 통화쌍: GBPJPY, EURJPY, USDJPY,NZDUSD, XAUUSD 계정 유형: 스프레드가 매우 낮은 ECN, Ra
Advanced Supply Demand
Bernhard Schweigert
4.92 (310)
현재 33% 할인! 초보자나 전문 트레이더를 위한 최고의 솔루션! 이 보조지표는 우리가 다수의 독창적 기능과 새로운 공식을 통합한 독특하고 고품질이며 저렴한 거래 도구입니다. 이 업데이트를 통해 이중 시간대를 표시할 수 있습니다. 더 높은 TF를 표시할 수 있을 뿐만 아니라 차트 TF와 더 높은 TF 모두를 표시할 수 있습니다: 중첩 영역 표시. 모든 Supply Demand 트레이더들이 좋아할 것입니다. :) 중요한 정보 공개 Advanced Supply Demand의 잠재력을 극대화하려면 다음을 방문하십시오. https://www.mql5.com/ko/blogs/post/720245   진입 또는 목표의 명확한 트리거 포인트를 정확히 찾아냄으로 해서 거래가 어떻게 개선될지 상상해 보십시오. 새로운 알고리즘을 기반으로 매수자와 매도자 간의 잠재적인 불균형을 훨씬 더 쉽게 분간할 수 있습니다. 왜냐하면 가장 강한 공급영역과 가장 강한 수요 영역과 과거에 어떻게 진행 되었는지를(이
Currency Strength Wizard
Oleg Rodin
4.91 (44)
통화 강도 마법사는 성공적인 거래를 위한 올인원 솔루션을 제공하는 매우 강력한 지표입니다. 표시기는 여러 시간 프레임의 모든 통화 데이터를 사용하여 이 또는 해당 외환 쌍의 힘을 계산합니다. 이 데이터는 특정 통화의 힘을 확인하는 데 사용할 수 있는 사용하기 쉬운 통화 지수 및 통화 전력선의 형태로 표시됩니다. 필요한 것은 거래하려는 차트에 표시기를 부착하는 것뿐입니다. 표시기는 거래하는 통화의 실제 강세를 보여줍니다. 지표는 또한 추세와 거래할 때 유리하게 사용할 수 있는 구매 및 판매 거래량 압력의 극한값을 보여줍니다. 지표는 또한 피보나치에 기반한 가능한 대상을 보여줍니다. 표시기는 PUSH 알림을 포함한 모든 유형의 알림을 제공합니다. 구매 후 연락주세요. 나는 당신과 거래 팁을 공유하고 당신에게 무료로 훌륭한 보너스 지표를 줄 것입니다! 나는 당신에게 행복하고 유익한 거래를 기원합니다!
맞춤형 MT4 지표로 성공적인 외환 거래에 대한 비밀을 발견하십시오! 외환 시장에서 성공을 달성하고 위험을 최소화하면서 일관되게 이익을 얻는 방법을 궁금해 한 적이 있습니까? 여기에 당신이 찾고 있던 답이 있습니다! 거래에 대한 귀하의 접근 방식을 혁신 할 독점적 MT4 지표를 소개 할 수 있습니다. 독특한 다양성 우리의 지표는 Renko 및 Rangebar Candle Formations를 선호하는 사용자를 위해 특별히 설계되었습니다. 우리는 이러한 차트 유형이 많은 숙련 된 거래자들이 선호한다는 것을 이해하기 때문에 우리의 지표가 그들과 완벽하게 통합되어 비교할 수없는 시장 분석을 제공합니다. 명확한 추세 신호 복잡한 분석을 잊어 버리십시오! 우리의 지표는 생생한 색상과 명확한 점 구조를 사용하여 시장 동향을 명확하게 나타냅니다. 빨간색과 파란색 점은 가격 이동 방향에 대해 의심의 여지가 없어 거래에서 빠른 의사 결정을 할 수 있습니다. HH/HL HL/LL
Break and Retest
Mohamed Hassan
5 (2)
Break & Retest is unstoppable when combined with our other divergence indicator. After purchase, send us a message and you could get this  2nd indicator  for  FREE  as a  BONUS! ‍You can visually backtest Break & Retest to see how it behaved in the past!    Manual guide:   Click here $59  for the first 25 copies ( 4  left)! Next price is $120 .  After many months of hard work and dedication, we are extremely proud to present you our  Break and Retest price action indicator crea
기적적인 외환 지표 소개: 정확한 트레이딩의 힘을 발휘하세요 모든 시간대에서 뛰어난 결과를 제공하는 최고의 외환 지표를 찾는데 지친 적이 있나요? 더 이상 찾을 필요가 없습니다! 기적적인 외환 지표가 도래하여 귀하의 트레이딩 경험을 혁신하고 수익을 새로운 고도로 끌어올립니다. 최첨단 기술과 수년간의 정성스런 개발을 토대로 기적적인 외환 지표는 외환 시장에서의 힘과 정확성의 정점으로 떠오릅니다. 이 탁월한 도구는 모든 수준의 트레이더의 요구를 충족시키고 지속적인 수익을 추구하는 데에서 비길 데 없는 우위를 제공하기 위해 설계되었습니다. 기적적인 외환 지표의 가장 큰 장점은 그 뛰어난 적응성에 있습니다. 당신이 데이 트레이더, 스윙 트레이더이든 장기 포지션을 선호하든, 이 지표는 모든 시간대에서 뛰어난 결과를 제공하기 위해 최적화되었습니다. 그러나 그 정확성과 시장의 복잡한 움직임을 포착하는 능력이 참으로 빛을 발하는 것은 1시간 기간대에서 사용할 때입니다. 기적적인 외환 지표의 정확성
Entry Points Pro
Yury Orlov
4.7 (225)
다시 색을 칠하지 않고 거래에 진입할 수 있는 정확한 신호를 제공하는 MT4용 지표입니다. 외환, 암호화폐, 금속, 주식, 지수 등 모든 금융 자산에 적용할 수 있습니다. 매우 정확한 추정값을 제공하고 매수와 매도의 가장 좋은 시점을 알려줍니다. 하나의 시그널로 수익을 내는 지표의 예와 함께 비디오 (6:22)시청하십시오! 대부분의 거래자는 Entry Points Pro 지표의 도움으로 첫 거래 주 동안 트레이딩 결과를 개선합니다. 저희의   Telegram Group 을 구독하세요! Entry Points Pro 지표의 좋은점. 재도색이 없는 진입 신호 신호가 나타나고 확인되면(시그널 캔들이 완성된 경우) 신호는 더 이상 사라지지 않습니다. 여타 보조지표의 경우 신호를 표시한 다음 제거되기 때문에 큰 재정적 손실로 이어집니다. 오류 없는 거래 게시 알고리즘을 통해 트레이드(진입 또는 청산)를 할 이상적인 순간을 찾을 수 있으며, 이를 통해 이를 사용하는 모든 거래자의
TrendDecoder Premium
Christophe, Pa Trouillas
5 (3)
범위 및 다음 가능한 움직임 식별   |  추세의 초기 신호와 강도를 확인하세요   |  반전 전 명확한 출구 확보   |  가격이 테스트 할 피보 레벨 파악 비추적, 비지연 지표 - 수동 및 자동 거래에 이상적 - 모든 자산 및 모든 시간 단위에 적합 기간 한정 혜택 >>   50% 할인 구매 후 이 채널로 문의 하여 권장 설정을 확인하세요. MT5   버전:   여기를 클릭하세요 BladeSCALPER   및   PowerZONES   로 전체 방법을 확인하세요. 어떤 서비스인가요? 트렌드디코더는 추세 모니터링을 간단하고 쉽게 하기 위한 여러 혁신 기술의 집약체입니다. 투영 추세선(투영 추세선) - 다가오는 추세의 속도 기준 실시간 추세선과 투영 추세선 비교 - 시장이 이전과 같은 방향으로 움직이고 있는지, 아니면 둔화되고 있는지? 실시간 추세선 교차 - 추세가 궤도를 이탈하고 있습니다. 그레이박스 - 시장이 더 이상 추세가 아니며 새로운 전환기에 들어섰습
EasyTrade Indicator
Gabor Bocsak
5 (5)
다중 통화 및 다중 시간대 매수 및 매도 알림. 자동 추적 중지 및 위험 보상 이익 실현! 지표는 시장을 스캔하고 분석하므로 귀하가 할 일이 없습니다! 하나의 차트에서 모든 통화를 거래하세요!   구매 후 댓글 남겨주시면 연락드리겠습니다. 무역도우미 EA를 보내드리겠습니다. 표시기는 여러 오실레이터와 부착된 필터를 사용하여 최상의 확인 진입점을 찾으므로 걱정할 필요가 없습니다! 이는 귀하에게 경고하고 귀하가 시청하기로 선택한 모든 기간과 통화에 대한 버튼을 그립니다. 버튼을 누르면 차트로 이동하여 거래를 시작할 수 있습니다! 이 표시기는 또한 모든 기본 및 시장 감시 통화에 대한 강도 패널을 그립니다(설정에서 조정 가능). 그러면 모든 통화 쌍과 선택한 더 높은 기간의 통화가 표시됩니다. 표시기 창에는 추세 필터가 포함된 특수 MACD 히스토그램과 차트 통화에 대한 다중 기간 추세 패널이 있습니다! 모든 통화와 시간대에 대한 거래 알림을 제공하며 버튼을 누르면
TrendMaestro
Stefano Frisetti
5 (2)
note: this indicator is for METATRADER4, if you want the version for METATRADER5 this is the link: TRENDMAESTRO recognizes a new TREND in the bud, he never makes mistakes. The certainty of identifying a new TREND is priceless. DESCRIPTION TRENDMAESTRO identifies a new TREND in the bud, this indicator examines the volatility, volumes and momentum to identify the moment in which there is an explosion of one or more of these data and therefore the moment in which prices have strong probability of f
FX Volume
Daniel Stein
4.6 (35)
모닝 브리핑을 통해 세부 정보와 스크린샷으로 매일 시장 업데이트를 받으세요 여기 mql5 및 텔레그램에서 FX 거래량은 브로커의 관점에서 시장 심리에 대한 실제 통찰력을 제공하는 최초이자 유일한 거래량 지표입니다. 브로커와 같은 기관 시장 참여자가 외환 시장에서 어떤 포지션을 취하고 있는지에 대한 훌륭한 통찰력을 COT 보고서보다 훨씬 빠르게 제공합니다. 차트에서 이 정보를 직접 확인하는 것은 트레이딩의 진정한 판도를 바꾸고 획기적인 솔루션입니다. 다음과 같은 고유한 시장 데이터 인사이트의 이점 비율 는 통화의 매수/매도 포지션 비율을 백분율로 표시 비율 변화 는 선택한 기간 내 매수 비율과 비율 변화를 표시 총 거래량 는 해당 통화의 총 거래량(롱 및 숏)을 로트 단위로 보여줍니다 Volumes Long 는 해당 통화의 모든 롱 포지션의 거래량을 보여줍니다 Volumes Short 는 해당 통화의 모든 숏 포지션의 거래량을 보여줍니다 Net Long 는 순 롱 포지션의 거래량
Price Action Entry Alerts
Stephen Sanjeeve Sahayam
5 (3)
이 지표는 매수 또는 매도 압력에 대한 모든 막대를 선별하고 볼륨이 가장 높은 4가지 유형의 캔들 패턴을 식별합니다. 이 양초는 여러 선형 필터를 사용하여 필터링되어 매수 또는 매도 신호를 표시합니다. 신호는 더 높은 시간 프레임 방향과 함께 거래량이 많은 시간에 거래될 때 가장 잘 작동합니다. 모든 필터는 사용자 정의가 가능하며 독립적으로 작동합니다. 버튼 클릭으로 단일 방향의 신호를 볼 수 있습니다. 또한 이 지표에는 의사 결정 과정을 지원할 수 있는 가장 중요한 가격 조치 및 스마트 머니 개념이 포함되어 있습니다. 하나의 도구에서 신호 및 거래 교육을 모두 제공합니다. 특징: 신호는 다시 칠하지 않습니다. Engulfing candles, Rejection candles, Expanded range candles 및 Pinbars를 식별합니다. 각 유효한 신호에 대해 여러 항목, 손절매 및 여러 이익 실현 수준을 표시합니다. 대량 세션으로 필터링합니다. 지원/저항 수준 및
Advanced Currency IMPULSE with ALERT
Bernhard Schweigert
4.91 (494)
현재 31% 할인!! 초보자 또는 전문가 트레이더를 위한 최고의 솔루션! 이 지표는 우리가 독점 기능과 비밀 공식을 통합했기 때문에 독특하고 고품질이며 저렴한 거래 도구입니다. 단 하나의 차트로 28개 통화 쌍 모두에 대한 경고를 제공합니다. 새로운 추세 또는 스캘핑 기회의 정확한 트리거 포인트를 정확히 찾아낼 수 있기 때문에 거래가 어떻게 개선될지 상상해 보십시오! 새로운 기본 알고리즘을 기반으로 구축되어 잠재적인 거래를 훨씬 더 쉽게 식별하고 확인할 수 있습니다. 이는 통화의 강세 또는 약세가 가속되는지 여부를 그래픽으로 표시하고 가속 속도를 측정하기 때문입니다. 자동차의 속도계처럼 생각하면 됩니다. 가속화할 때 Forex 시장에서 동일한 일이 분명히 더 빠르게 발생합니다. 즉, 반대 방향으로 가속화되는 통화를 페어링하면 잠재적으로 수익성 있는 거래를 식별한 것입니다. 통화 모멘텀의 수직선과 화살표가 거래를 안내합니다! 역동적인 Market Fibonacci 23
Trend Forecasting
Mohamed Hassan
5 (15)
This indicator is unstoppable when combined with our other indicator called Katana. After purchase, send us a message and you could get Katana for FREE as a BONUS After purchase, send us a private message for your instructions.  MT5 version: click here 3 copies left available at $45. Next price is $99. Don't miss this great deal!  The Trend Forecasting indicator is a very unique & easy tool that is able to make prediction about future price movement based on the signals generated
차트에 지지 및 저항 수준과 추진 캔들 갭을 자동으로 그려주므로 다음 가격 방향 및/또는 잠재적 반전 가능성을 확인할 수 있습니다. 이 보조지표는 제 웹사이트(시장 구조 트레이더)에서 가르치는 포지션 트레이딩 방법론의 일부로 사용하도록 설계되었으며 타겟팅 및 잠재적 진입을 위한 주요 정보를 표시합니다. 이 보조지표에는 2가지 핵심 기능과 4가지 추가 기능이 있습니다: 핵심 기능 1 - 일일, 주간 및 월간 시간대의 자동 지지선 및 저항선 이 인디케이터는 지난 2일에서 최대 6주 및 몇 달 전의 가장 최근 지원 및 저항 수준을 자동으로 가져옵니다. 이러한 레벨의 모양을 원하는 대로 완전히 사용자 지정하고 표시되는 레벨 수를 표시할 수 있습니다. 이러한 주요 레벨은 종종 가격이 하락하거나 반전되는 주요 지지 및 저항 구간으로 작용합니다. 또한 가격이 향할 목표가 되기도 하므로 가격이 전환되기 전에 거래할 수 있는 잠재적 거리를 빠르게 확인할 수 있습니다. 핵심 기능 2 -
How to use Pair Trading Station Pair Trading Station is recommended for H1 time frame and you can use it for any currency pairs. To generate buy and sell signal, follow few steps below to apply Pair Trading Station to your MetaTrader terminal. When you load Pair Trading Station on your chart, Pair Trading station will assess available historical data in your MetaTrader platforms for each currency pair. On your chart, the amount of historical data available will be displayed for each currency pai
FX Power MT4 NG
Daniel Stein
5 (8)
모닝 브리핑 여기 mql5 와 텔레그램에서 FX Power MT4 NG 는 오랫동안 인기 있는 통화 강도 측정기인 FX Power의 차세대 버전입니다. 이 차세대 강도 측정기는 무엇을 제공합니까? 기존 FX Power에서 좋아했던 모든 것 PLUS GOLD/XAU 강도 분석 더욱 정밀한 계산 결과 개별 구성 가능한 분석 기간 더 나은 성능을 위한 사용자 정의 가능한 계산 한도 특별 멀티더 많은 것을보고 싶은 사람들을위한 특별한 다중 인스턴스 설정 모든 차트에서 좋아하는 색상을위한 끝없는 그래픽 설정 수많은 알림 옵션, 중요한 것을 다시는 놓치지 않도록 Windows 11 및 macOS 스타일의 둥근 모서리가 있는 새로운 디자인 마법처럼 움직이는 인디케이터 패널 FX 파워 키 특징 모든 주요 통화의 완전한 강세 이력 모든 시간대에 걸친 통화 강세 이력 모든 브로커 및 차트에서 고유 계산 결과 100% 신뢰할 수있는 실시간100 % 신뢰할 수있는 실시간 계산-> 다시 칠하지 않음
PRO Renko System
Oleg Rodin
5 (24)
PRO Renko System 은 RENKO 차트 거래를 위해 특별히 고안된 매우 정확한 거래 시스템입니다. 이것은 다양한 거래 상품에 적용될 수있는 보편적 인 시스템입니다. 체계는 효과적으로 당신에게 정확한 반전 신호에 접근을 주는 소위 시장 소음을 중화합니다. 이 표시기는 사용하기가 매우 쉽고 신호 생성을 담당하는 매개 변수가 하나만 있습니다. 당신은 쉽게 당신의 선택의 어떤 무역 계기에 공구를 적응시킬 수 있고 renko 막대기의 크기. 나는 항상 당신이 내 소프트웨어로 수익성있게 거래 할 수 있도록 추가 지원을 제공 할 준비가되어 있습니다! 나는 당신에게 행복하고 수익성있는 거래를 기원합니다! 구매 후 저에게 연락하십시오! 내 렌코 차트 생성기를 보내드립니다. 또한 내 개인 권장 사항 및 시스템의 다른 모듈을 무료로 공유 할 것입니다!
제작자의 제품 더 보기
FHDrawer
Sergio D. Rocha
2.5 (2)
Free Hand Drawer is a small app that runs as technical indicator and the only thing that does is that it draws continuous line. To activate it, after adding the indicator to the chart just press the D on your keyboard and click where you want to start drawing. Then every click you make on your chart will be the next nod in your drawing. Use it to draft Elliott waves, or to illustrate ideas on your chart. If you like to draw manually your Gann line you’ll find it handy as well. Each time you want
Dollar Index
Sergio D. Rocha
4 (4)
This indicator calculates directly the value of the dollar index by using the ICE formula to plot the chart, this can help you as reference. You do not need your broker to provide the ICE DX to use this indicator, is a way to have it calculated. Little discrepancies could be found in the exact value of the candles or time due closing time of the trading floor and the use of decimals, but generally will give you good reference.  You need your broker offers the feed for the following pairs in orde
FREE
Elliott Wave Tool Lite
Sergio D. Rocha
4.2 (5)
This is a reduced version, demo if you like, of the published Elliott Wave Tool 7Pasos . The limitations for this tool vs Elliott Wave Tool 7pasos are the following: Only one account possible, the original tool has 1 principal and 4 alternative accounts. Only one degree (Primary) is available, in the original tool 12 different degrees (6 in micro) are at your disposition. As only one degree is available, the functions to upgrade and downgrade the degree of the selected wave are disabled. Fixed c
FREE
SundayCandle
Sergio D. Rocha
5 (1)
This is a very simple indicator that mixes the Sunday session with the Monday one. This is useful because the Sunday session is a partial session mostly with only Australian and Asian sessions included, so the analysis of the Monday's daily session if mixed with Sunday tends to be more comprehensive. This indicator plots a candle with the following values: Open - the Friday's Close or Sunday's Open (depending on your choice). High - the highest High of Sunday and Monday. Low - the lowest Low of
FREE
DollarAndEuroIndex
Sergio D. Rocha
4.83 (6)
This is an extension of the previous published DollarIndex with the addition of the function for calculating EURO Index under ICE Formula. Note that the broker should provide the following data: For Dollar Index formula, EURUSD, USDJPY, GBPUSD, USDCAD, USDSEK and USDCHF are needed. For Euro Index formula, EURUSD, EURGBP, EURSEK and EURCHF are needed. Now in this version if the SEK (the most uncommon) is not provided, the formula still works, since it adds 0.0001 to its value, but the index will
FREE
ManualBackTest
Sergio D. Rocha
3.5 (2)
This is a technical indicator that put on strategy tester the buttons of the expert adviser "Control adora". Usually when applied the controladora to the strategy tester, the buttons do not appear and therefore its functions (like directly buy, sell, close orders or place stop loss indicator) can't be used. But now you can if have the Manual Backtest indicator. If you don't have Control adora, you can get it from here . This indicator get on the chart the buttons that can be of use in strategy t
FREE
LevelsGrid
Sergio D. Rocha
5 (1)
This is a simple script that places a defined number of lines above and below a given price.  The script lets you set the number of lines, the separation in pips and the color.   Instructions: Drop the script on a chart to draw the level lines  If the last parameter is set to false, the script will delete the lines previously placed by it.  Parameters:  English? Turn it yes to use English language, false will turn language to Spanish  Separation Set the pips distance among lines  From Price
FREE
Delete All
Sergio D. Rocha
4 (1)
This is a very silly script but perhaps you find it useful. It deletes all objects from the chart. I recommend setting a hot key to call it just by pressing a couple of keys on your keyboard.  To avoid accidental deletion of object, the script will ask you to confirm the action as you won't be available to restore them with "undo" (Ctrl+Z).
FREE
"TradeALot" is a plug-in for the Expert Advisor Control-adora . It allow you to place programmed orders without the need to write the name of the order in the Arrow (like bs, ss, bl, sl, sl1, sl2, etc). Just drag and drop the button for "Programmed Buys" or "Programmed Sells" over the candles-zone at the place where you want to program the order and TradeALot will compare the bid price with the position where you dropped the button and will decide if the order need to be "Stop" or "Limit". With
FREE
RepliTrades Source
Sergio D. Rocha
4 (1)
This is a system consistent of 2 components: RepliTrades Source: It sends the trades to one or more terminals into the same Computer RepliTrades Trader: It trades the orders sent by RepliTrades Source  Please watch the video to learn how it works and use it. Features: Manage up to 300 trades at same time in each terminal Work with any broker, no matter if uses suffix or prefix in symbols names Replicate pending orders (limits or stops orders) or direct trades (market orders, etc) and its modif
FREE
This is a technical indicator that works as a plug-in for "Control adora" - the Expert Advisor that helps you to calculate, place and control positions on the chart. When run on a chart with Control adora EA, this plug-in allows setting entry levels that send orders at contact, while you have StopCloseOnly (OCO in Comments) = 1 settled in Control adora (meaning that without this, the indicator will send the order only when the price Close crosses the arrow level). This indicator only works if yo
FREE
Trailing Even is a free complement for the Control adora Expert Adviser. It adds a trailing stop function and changes the exit level that works as stop loss if some price is reached, let's review how to make it work: First of all make sure you have the same language selected both in the Control adora Expert and in this indicator.  Change of the exit level that works as stop loss with "BES" and "BEO": This function needs 2 arrows to work: 1 named BES (stands for Break Even Start) place it at the
FREE
AllHere is a plug-in for Control-adora that works as information panel. Its main function is to show you all the Control-adora elements placed in the chart, like the Control-adora's orders or the exit lines. On the lower left corner, AllHere shows a collection of buttons classified by color (you can set them in the indicator's properties) for several elements used in Control-adora system: Stop loss indications (stop loss Arrows) Exit lines Above (Above trend lines) Exit lines Below (Below trend
FREE
CorExTi is a tool that will save you literally hours in your daily routine to draw lines and other graphic elements in your charts.   With a temporary panel discreetly displayed on your screen at the touch of a graphic element as trendline:  Changes the object between 4 favorite line styles (with color, line thickness and style)  Cuts trendlines, when are extended, just at the point where you touch them Extends trendlines (active property of Ray) which are not extended  Or deactivates visualizat
RotaGrafico
Sergio D. Rocha
The best way to monitor multiple pairs within little workspace. RotaGrafico sequentially displays up to 6 different pairs. It has buttons to set a pair more time for observation. Normal exposure time adjustable. Broad exposure time adjustable. Combine in a profile, Rotagrafico and use the rest of your workspace to the pair that you want to analyze in detail.
Object Copier
Sergio D. Rocha
5 (2)
Did you have to start again the very same analysis because the original one, from where you want to modify, just have so much information that no longer fits? Have you ever wanted to change some in one of your charts and make this new line, Fibo or channel automatically appear in some or the rest of your set of charts? Object Copier is the solution to replicate any object into one or several charts at your desire. No matter if you changed an object, or made it from the scratch. With Object Copie
Control adora
Sergio D. Rocha
4.33 (6)
Controladora means in Spanish controller, this is a simple yet powerful Expert Advisor that allows you to control your trading easily and precisely. Do you want to stop your trade when the price cross a trend line? Don't worry, Controladora can do it. Do you want to take profit when the price reaches the top of a channel? Controladora can do it as well. Calculating the exact proportion of your account by opening a trade, which size represents in case of loss a percentage of your balance, is time
Fibo Pro
Sergio D. Rocha
4.5 (4)
When you combine short term fibos with the long term, your chart get missed up with a lot of lines that hardly make sense at first view. The best way to improve the clearness and there for the easiness to read your chart is by deleting the fibo levels that you no longer need, for example those levels that the price proved didn’t work as support or resistance. With Fibo Pro, you can activate or deactivate from a set of fibo levels pre-settled by you, without miss with the default fibo configurati
BreakEven
Sergio D. Rocha
BreakEven shows the location of the average price level of the orders in the symbol, to which the indicator is attached. This information allows you to find the break-even. The indicator is helpful if you manage several positions, since it allows you to evaluate the performance of your open trades in a glance. If you trade a single order, it allows you to evaluate the effect of your stop loss and the profit or loss during the time your trade is open. Apart from drawing a break-even level line (w
Gann Line
Sergio D. Rocha
Gann Line indicator is usually used in combination with other Gann’s techniques, some say this is a key point in its success. The Gann line is interpreted as trend indicator, a series of higher highs and higher lows in it's trend are considered bullish, and a series of lower lows and lower highs are bearish. As with other technical indicators, for better results Gann Line should be used in combination with other technical concepts as Gann Fan, fibo, swings, supports and resistance, etc. When rev
RepliTrades Trader
Sergio D. Rocha
2.5 (2)
This is a system consistent of 2 components: RepliTrades Source: It sends the trades to one or more terminals into the same Computer RepliTrades Trader: It trades the orders sent by RepliTrades Source   Please watch the video to learn how it works and use it. Features: Manage up to 300 trades at same time in each terminal. Work with any broker, no matter if uses suffix or prefix in symbols names. Replicate pending orders (limits or stops orders) or direct trades (market orders, etc) and its mo
The indicator that helps you by plotting a reference to easily determine if a scalping trade (or intraday trade) has chances to work out in your favor. One of the most common issues intraday traders have is the lost of reference to know if a movement is big or small due to the scaling of the chart. With this indicator, you have 3 visual aids on your chart that will help you: "Screener" : Please set the normal stop loss size that you usually apply in your strategy. This will plot a rectangle afte
Moon Phase
Sergio D. Rocha
5 (1)
Gann and other analyst had found a curious correlations between moon phases and change in trends, this is an excellent indicator to test those relation and use what you find useful. It's very simplistic, can calculate the moon phases using the average moon cycle duration of 29 days 12 hours 44 minutes since the 1970 first full moon registered at January 22nd. You can also place a known full moon's date, to start the count since the daily opening of that date. In its window will plot a vertical l
Pointer Sync
Sergio D. Rocha
4.29 (7)
This indicator plots a crosshair pointer in all charts of the terminal in the position relative to the active chart. To activate the Pointer Sync, just press the "+" button that will appear in one of the 4 corners of the chart where the indicator is added. To deactivate the Pointer Sync, just press the "+" button again. Once Pointer Sync is deactivated, the cross lines will disappear in all charts as well. You can adjust the color of the pointers and the button, the corner where the button appea
Boundaries
Sergio D. Rocha
This indicator plots a line that shows the high and low of a higher time frame than the one where you have actually in your chart. For example if you want to see the high and low of the day while you are in 1hour chart, set Boundaries to Daily. Boundaries have predefined Monthly, Weekly, Daily and Hourly time frames, but if you want to use a different timeframe, just choose the option Other_TF and write on the next field the minutes for your desired timeframe. As MT4 only works beyond M1 with 5,
AntiCursing
Sergio D. Rocha
Having a trade about to reach its take profit and suddenly see that it turns around to go strait ahead to your Stop Loss is one of the few things that makes me curse (a lot). This is why I created AntiCurse. Just add this Expert Advisor to an empty chart, set a "Trigger" and "Lock" in its properties and you'll have one less reason to curse! AntiCursing Settings: "Trigger" is set in percentage terms, it is the distance between the entry price and the Take Profit that needs to be covered in orde
PerfectLine
Sergio D. Rocha
5 (3)
When drawing a trend line or other objects, there is a natural deviation when you place the object from a higher time frame, and then go to watch it in a lower time frame. PerfectLine is a technical indicator that solves this problem. Once you touch a line after drawing it, Perfect Line will find the exact spot in the lower time frame available for it's position and then rectifies where it should be. Perfect Line uses a five pixels pre-established tolerance, if a difference between the line's no
The Polarized Fractal Efficiency (PFE) was introduced by Hans Hannula in 1994. The indicator was intended to quantify the efficiency of price movement and  how trendy or choppy  the recent past price action has been. This is calculated by contrasting the price traveled in the window of study  against the total accumulation of movements during the same period of time. For example: If in 10 days, an active raised from 50 to 100, by increasing it's value 5 points or dollars each session, the effici
CrossAlert
Sergio D. Rocha
Cross Alert is an all-in-one solution for oscillators' cross over and under. Cross Alert manages the levels for the cross under and cross over separately. Thanks to this you can use it to signal zero cross over (by fixing both levels, above to below, and below to above as zero) or over-bought and over-sold levels (like 70 and 30) as well.  With CrossAlert you can also avoid alerts from one kind of crosses (overs or unders), for example if you are in an uptrend perhaps you do not want to have ale
AdvancedTradeLog
Sergio D. Rocha
5 (2)
AdvancedTradeLog is a system that allows you to keep visual register of what you had in your chart when you take a trade decision. Basically it takes screenshots of your chart each time you open, modify or close a trade. But not just that, AdvancedTradeLog gives you the ability to record the reasons of why you take those decisions. All who had been trading some time knows that keep a track-record of what you decide and why on the market, is a powerful tool to improve your performance. AdvancedTr
필터:
Tim Eubanks
5733
Tim Eubanks 2018.03.18 23:40 
 

사용자가 평가에 대한 코멘트를 남기지 않았습니다

Maksym Mudrakov
29226
Maksym Mudrakov 2016.08.31 18:56 
 

사용자가 평가에 대한 코멘트를 남기지 않았습니다

Rabbitpips
299
Rabbitpips 2015.06.11 20:39 
 

사용자가 평가에 대한 코멘트를 남기지 않았습니다

MasterExpertAd
261
MasterExpertAd 2014.07.06 02:17 
 

사용자가 평가에 대한 코멘트를 남기지 않았습니다

리뷰 답변
버전 1.10 2021.11.23
Recompiled with latest MT4 build, requested by mql5.com