Support Resistance Pattern
- 지표
- Emanuele Cartelli
- 버전: 1.0
- 활성화: 5
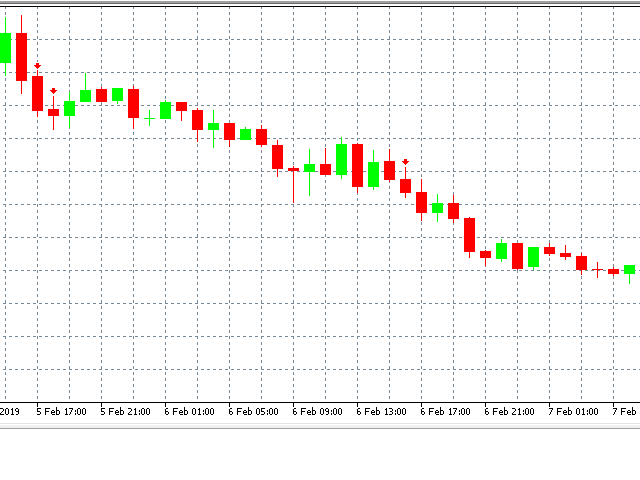
Support Resistance Pattern is based on supports and resistance to find the points in which the currency will probably go in a defined direction.
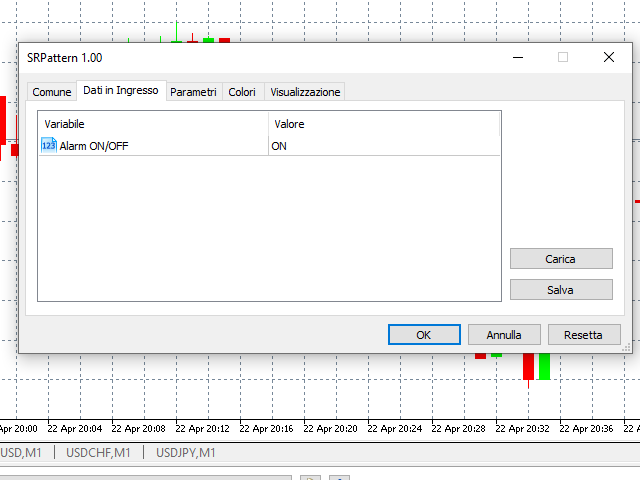
Inputs:
- Alarm ON/OFF: turn on or off alarm on screen.
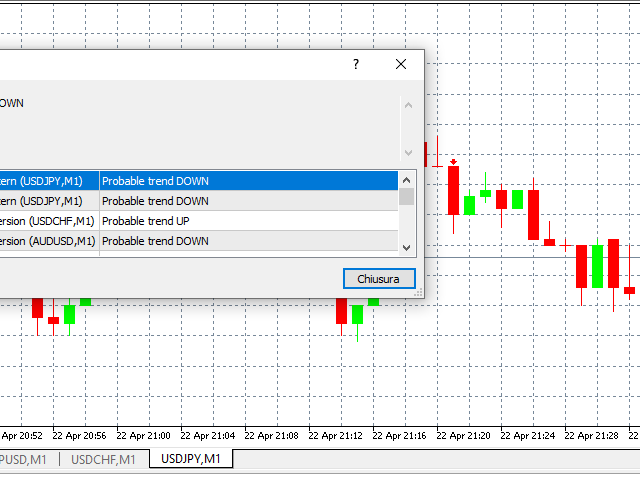
The indicator draws an arrow pointing the direction to follow based on when a specific pattern of bars is found near a support or a resistance.
Support Resistance Pattern can help you to choose the moment to do your trades in a specific direction, strengthening your trading strategy.