Trend Direction Ind
- 지표
- HITESH ARORA
- 버전: 1.0
- 활성화: 5
Contact us for any custom order, CodeYourTrade.com.
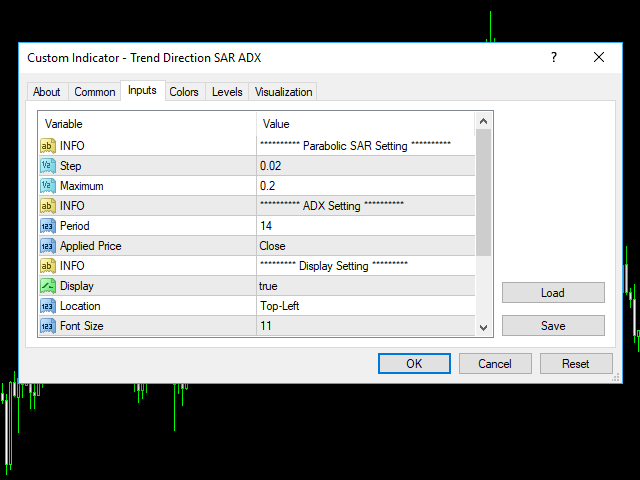
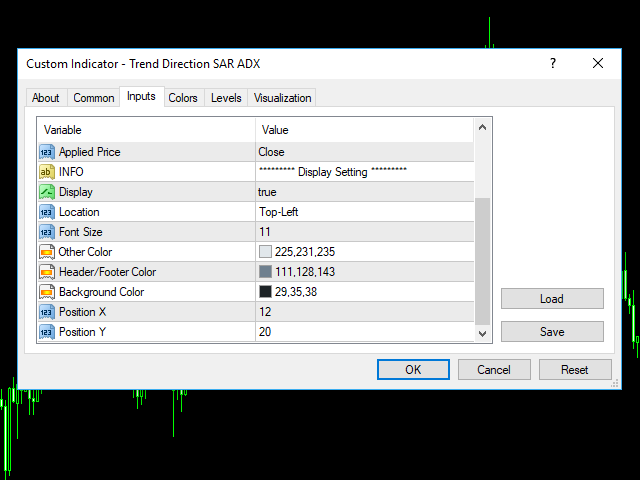
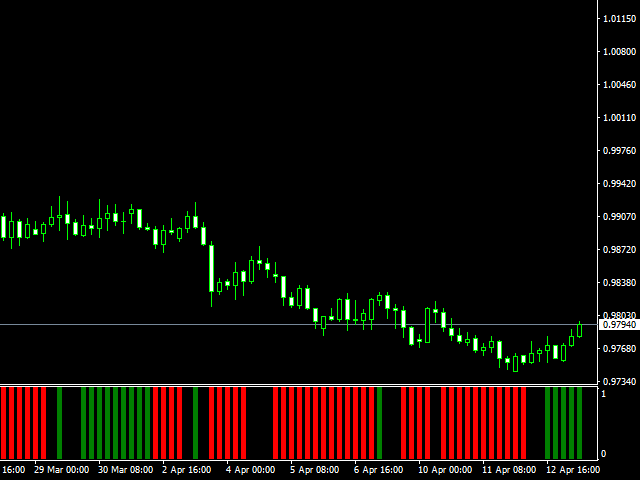
Trend Direction indicator finds the direction of the trend using 2 indicators ADX and Parabolic SAR. Change the color of the Sell and Buy strength from the Colors tab in indicator settings.
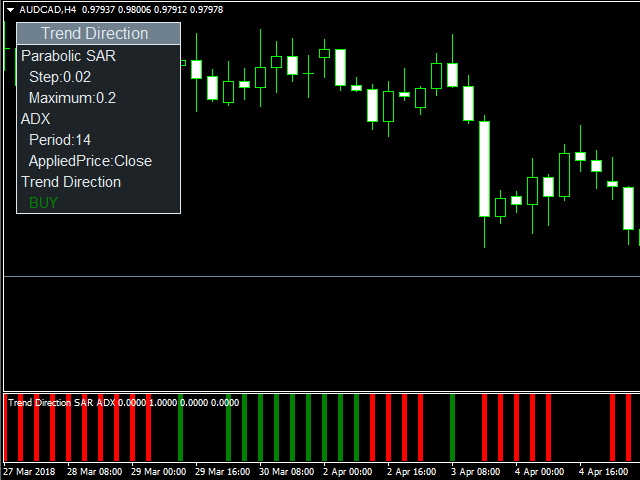
After you attached the indicator to a chart it will show the following information on the chart:
1. Parabolic SAR: Input values of Parabolic SAR Indicator
2. ADX: Input values of ADX Indicator
3. Trend Strength: Direction of the trend