DYJ Trend Analyst
- 지표
- Daying Cao
- 버전: 1.76
- 업데이트됨: 21 2월 2024
- 활성화: 5
우리의 목표는 정보에 입각한 시기적절한 거래 결정을 위해 꼭 필요한 도구를 사용하여 접근 가능하고 양질의 서비스를 제공하고 시장 참가자, 거래자 및 분석가를 모두 가능하게 하는 것입니다.
가장 최적화되고 강력하며 사용하기 쉬운 DYJ 트렌드 분석 지표.
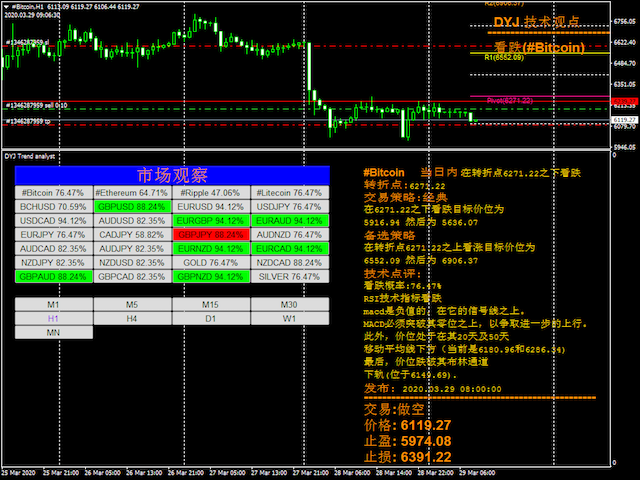
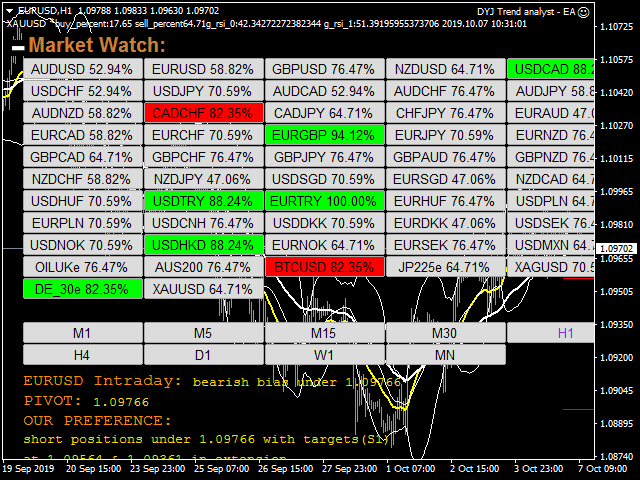
DYJ Trend 분석가는 각 방향 압력 유형에 대해 하나씩 두 가지 개별 측정값을 사용하여 시장의 강세 및 약세 힘을 측정하려고 시도합니다.
지표의 BearsIndex는 더 낮은 가격에 대한 시장의 욕구를 측정하려고 시도합니다.
지표의 BullsIndex는 더 높은 가격에 대한 시장의 욕구를 측정하려고 시도합니다.
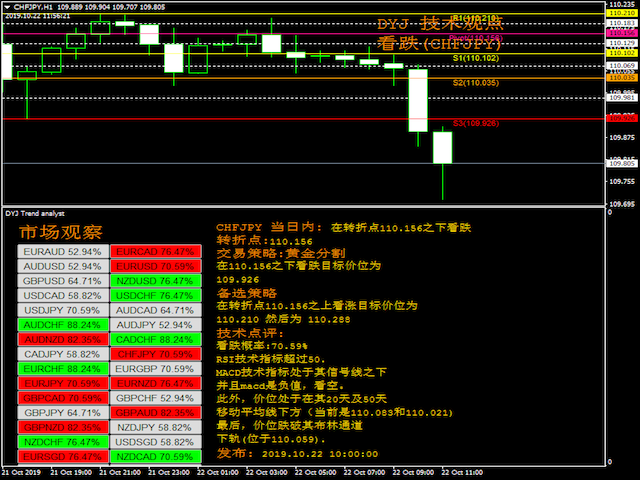
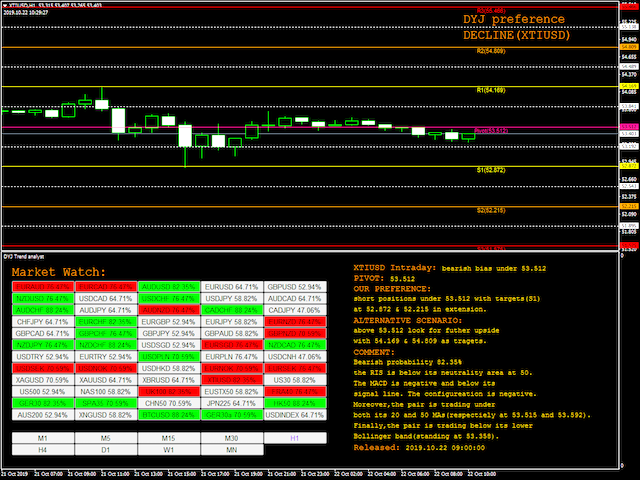
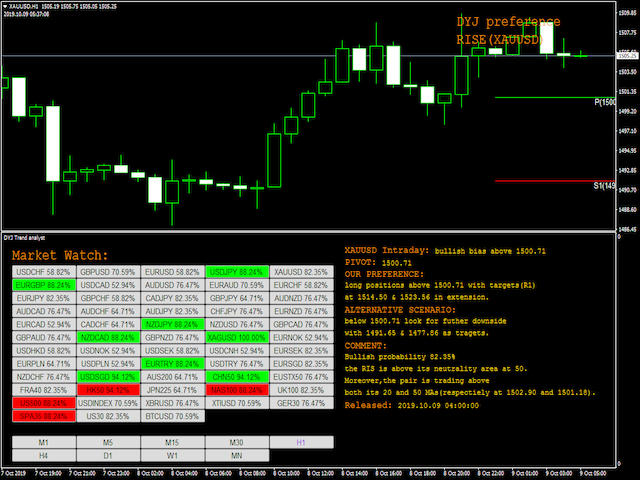
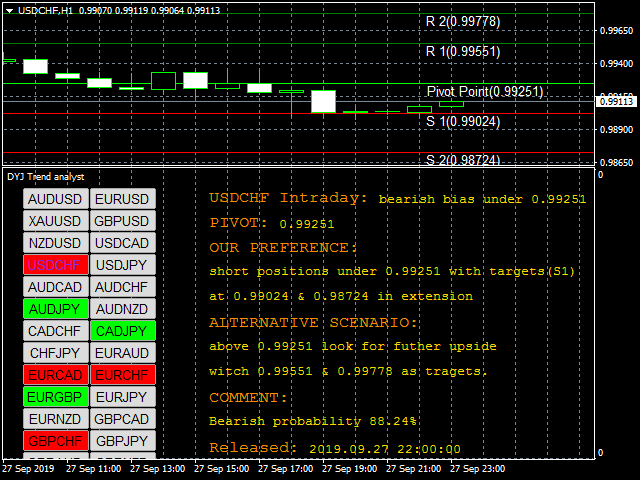
DYJ Trend 분석가를 위한 Pivot Point Extra Indicator.
우리의 피벗 포인트 표시기는 피벗 포인트와 지지 및 저항 수준을 계산하는 고급 알고리즘을 기반으로 합니다.
미래의 중요한 가격 수준과 가능한 시장 반전에 대한 믿을 수 없을 정도로 정확한 예측.
모든 시장(forex, 상품, 주식, 지수 및 기타) 및 기간에 유용합니다.
특징
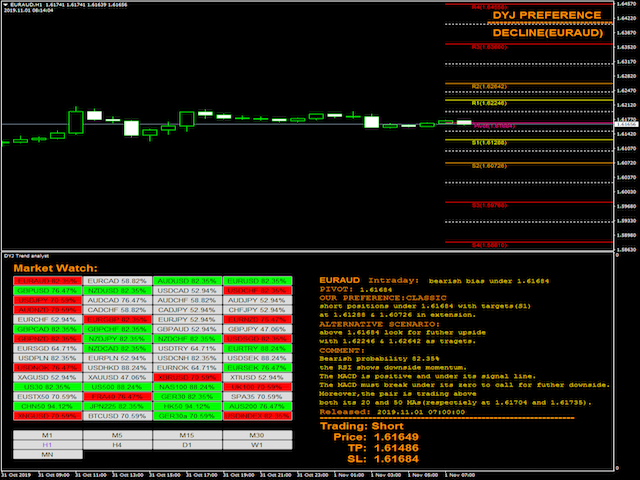
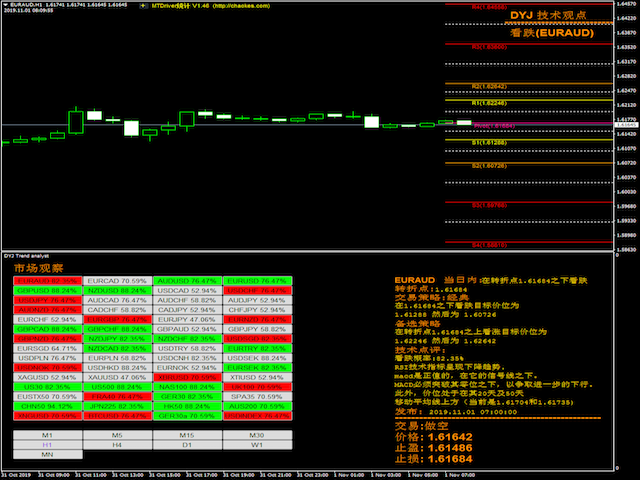
모든 쌍을 동시에 모니터링합니다.
표시기는 기본적으로 MaekingWatch 쌍을 모니터링합니다.
그래프(M1에서 MN까지)에서만 실행됩니다.
Parameter:
- InpLanguage = English -- English or Chinese
- InpCalculationMode = CALC_MODE_CLASSIC -- Classic,Camarilla,Woodie,Fibonacci,Floor,Fibonacci retraction
- InpPivotLineType = PIVOT_TREND -- PIVOT_TREND or PIVOT_HLINE
- InpEntryPercent = Min_70 -- Trend percentage requirements 70% or more.
- InpSelecttrend = WeakTrend -- Select trend. DoNotUseThis to ExtremelyStrongTrend.
- Wait_Mins_For_Next_Signal = 30 -- The next signal occurs 30 minutes later
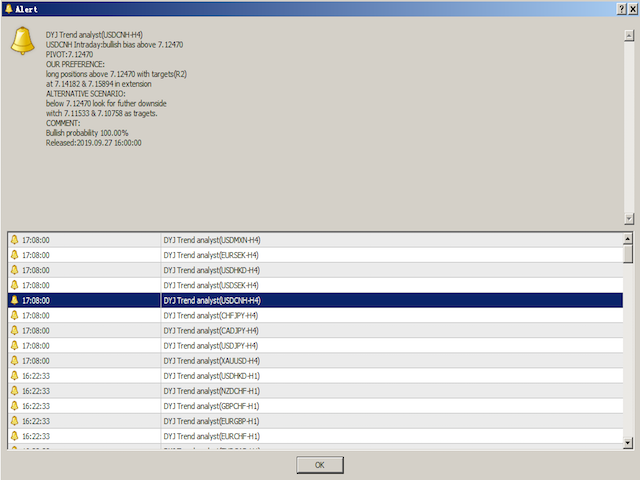
- ISALARM = false -- Snow_Alert
- Send_Email = false -- SendEmail
- Mobile_Alert = false -- MobileAlert
- ButtonsInARow = 5 -- Buttons in a horizontal row


good product great support