TradingDesk
- 지표
- Christian Weilinger
- 버전: 1.0
- 활성화: 5
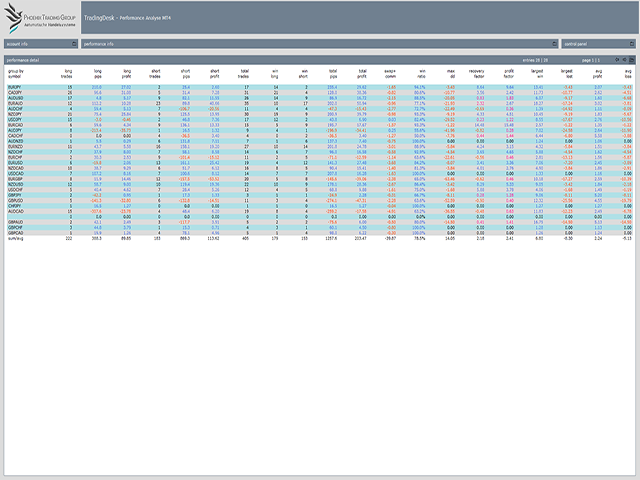
TradingDesk – Performance Analyse MT4
To test the indicator download free Demo version here: https://www.mql5.com/en/market/product/40471
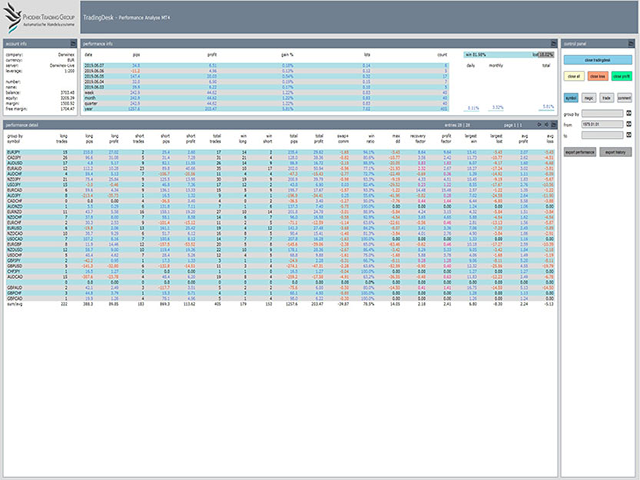
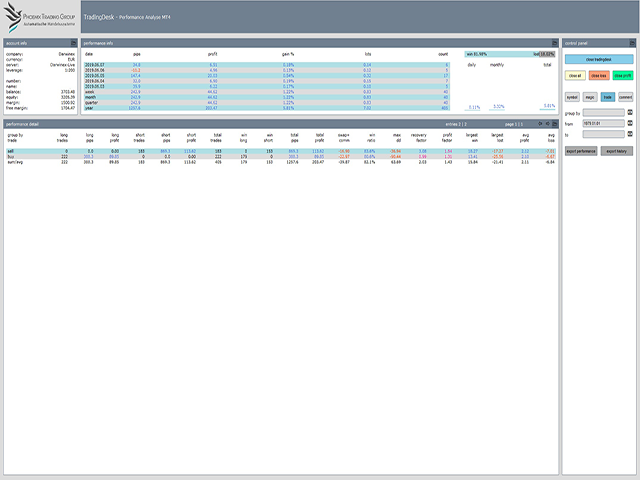
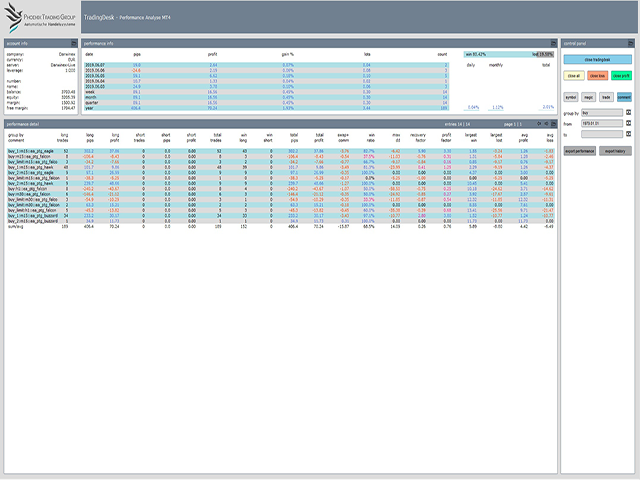
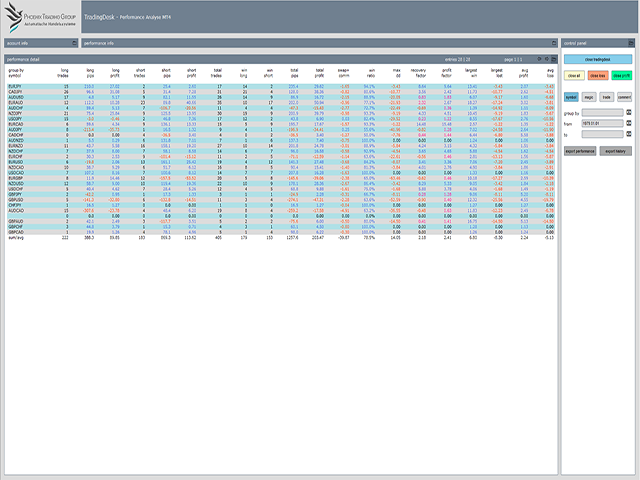
TradingDesk analysed MetaTrader 4 historical data by Symbol, Magic Number, Trade or Comment. All these evaluations will be displayed in real time on your MetaTrader 4 chart window.
All this information will be displayed in the following dashboards:
- account info
General information about the account is displayed in the account info dashboard.
- performance info
Main statistics like Pips, Profit, Gain, Lots and Count are displayed in the performance info dashboard. In addition, the daily, monthly and total growth with win and lost trades is also displayed in this area.
- performance detail
Detailed evaluations are provided in the dashboard performance detail.
- control panel
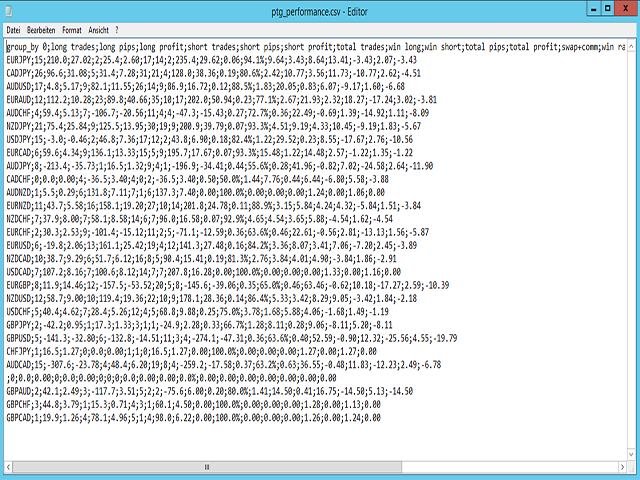
The control of TradingDesk. All these filters have an impact on performance info and detail dashboard. Loss, profit or all open trades inclusive limit can be closed at once. The filter are also used during export.
In the expert parameter, the colors of TradingDesk can be adjusted completely according to your wishes.
Important Instructions
Make sure to turn on “All History” in the “Account History” tab at the bottom of your MetaTrader 4 account so that the TradingDesk gets access to all of your trading history.
TradingDesk does not scan open trades. It will only analysis closed trades, group them and filter it according to your specifications.


Works well and give a nice overview. Would be 5 stars if export function to Excel would work.