Perfect Peenachi
- 지표
- Praveen Elango
- 버전: 1.0
- 활성화: 5
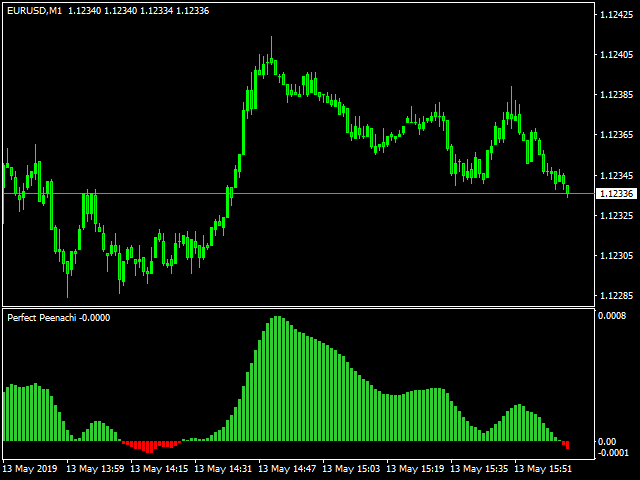
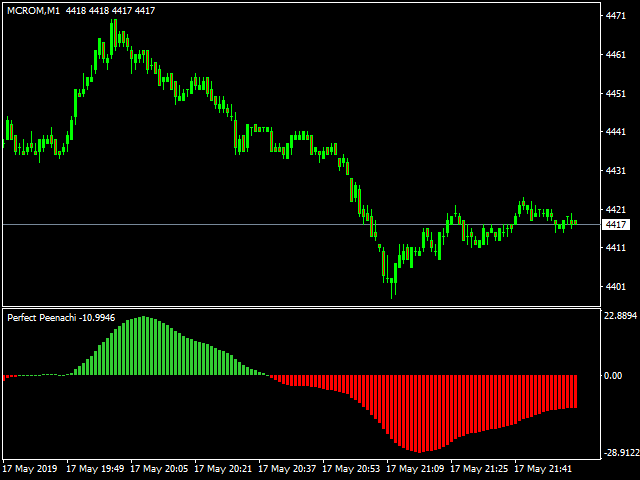
Perfect Peenachi
Perfect Peenachi is a new trend based MT4 Indicator. This indicator is perfect for scalp traders as well as swing traders. It simply show you the trend where traders can get into the beginning of the trend.
Indicator Parameters
This has only two input parameters which is easy for the users to make their own customization
- Main Period = This period used to calculate major trend
- Sub Period = This period determines the lower level trend
Notes:
- This indicator alone is enough to trade decision but you can definitely combine other indicators to form your own trading strategy.
- It is better to avoid trading during high volatility and news events.
- It is also good to Practice and backtest your trading strategy before going to live.
- Usage of indicators and trading is solely responsible for the user