BeST Chande TrendScore Indicator MT5
- 지표
- Eleni Koulocheri
- 버전: 1.10
- 업데이트됨: 4 5월 2019
- 활성화: 10
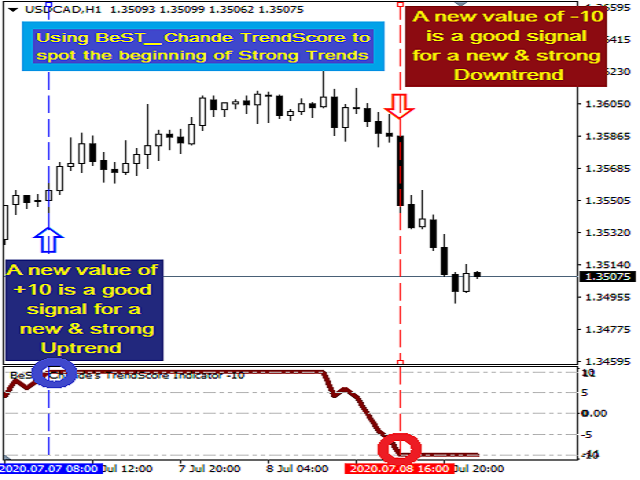
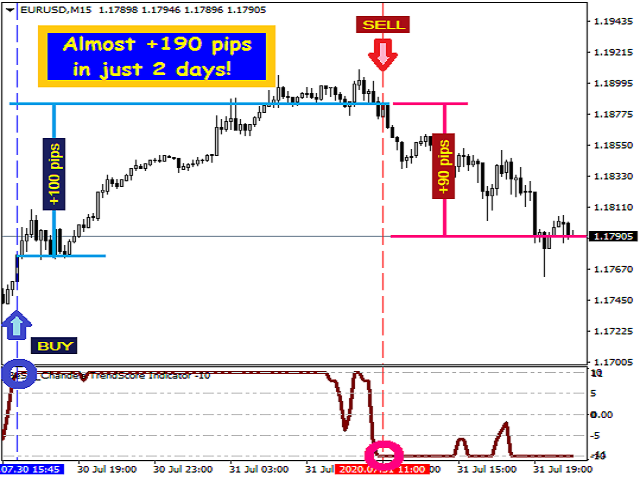
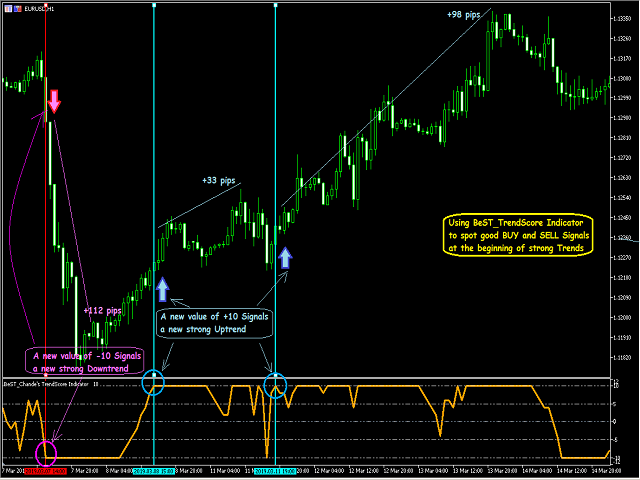
BeST_Chande TrendScore Indicator points the start of a trend with high degree of accuracy and it is amazing for scalping on the 1min timeframe. It is also a simple way to rate trend strength. It indicates both the direction and strength of a trend and can be easily combined with various trend-following, swing and scalping strategies.As of a trend’s direction and strength a value of +10 signals a strong uptrend while a value of -10 signals a strong downtrend. Generally a positive score shows an upward trend bias while a negative score shows a downward bias. The TrendScore is pinned to +10 during major portions of the upward moves and to –10 during major portions of the upward moves while it is quick to change directions during sideways periods.
TrendScore Indicator
- is great for trend trading
- is great for swing trading
- is great for scalping
- does not repaint
- works on any timeframe
- works on any Symbol
- is simple and easy to use
TrendScore Indicator was devised by Tushar S. Chande and he explained all about its use at his article in Stocks & Commodities: “Rating Trend Strength”.
TrendScore Indicator can be traded in many ways. The approach we choose depends on our trading style:
- You can use the zero crossing as an early signal and then buy when the trendscore becomes positive or equal to +10 and sell when it becomes negative or equal to –10.
- Also as a filter you can wait one to three bars after the TrendScore reaches +10 or -10 before buying (+ 10) or selling (-10).
- Or you can combine the trendscore with a moving average, trading an upward or downward crossover.
- Another variation would be to go long after the trendscore crosses from -10 to above +5 and go short after the trendscore falls from +10 to below 5.
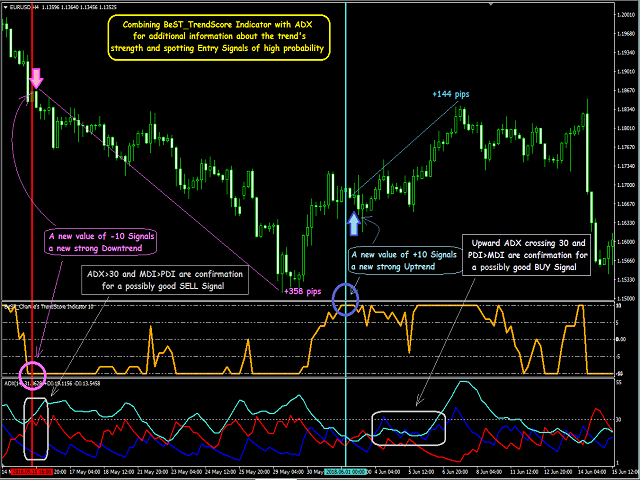
You could also combine TrendScore with other indicators of trend strength. For example, if you combine it with the ADX indicator Trendscore would provide an indication of direction, while the ADX can provide additional information about the trend's strength. You could also for example use H1 data to calculate a trend's score and make trades based on a lower timeframe like M15,M5 or M1 etc.
Inputs
The only Input parameters of the indicator are the following:
- Select Color of TrendScore Indicator
- Select Width of TrendScore Indicator
For EA Developers
TrendScore Buffer = 1