BeST Keltner Channels Variations and Strategies
- 지표
- Eleni Koulocheri
- 버전: 1.10
- 업데이트됨: 30 7월 2020
- 활성화: 10
BeST_Keltner Channels Variations & Strategies is an MT4 Indicator based on the original Keltner Channels Technical Analysis Indicator and it is a very useful Visual Tool that can display in the Chart all the known Variations of Keltener Channels and also the corresponding 10 totally Strategies i.e. all ENTRY signals (BUY and SELL) and also any corresponding EXIT signal, in which the Enrty and Exit Signals are derived exclusively by using Keltner Channels Variations. Every variation of Keltner Channels Indicator generally consists of a Central Moving Average Line and two Boundary Bands at a distance above and below it and can be traded mainly in a Trending Mode but also in a Ranging ReEntry Mode.
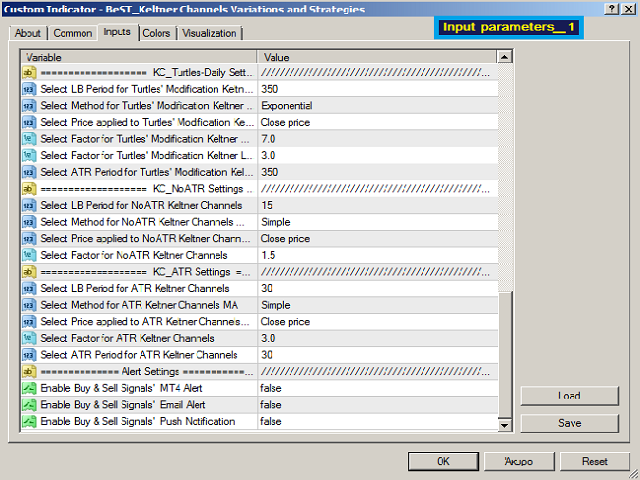
Inputs
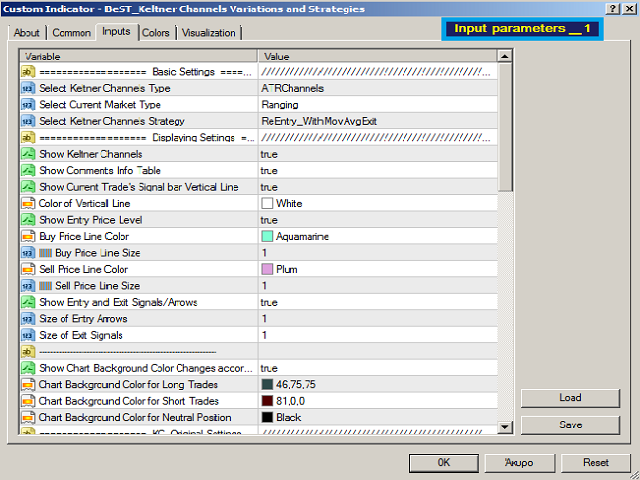
Basic Settings
1. Keltner Channels Type
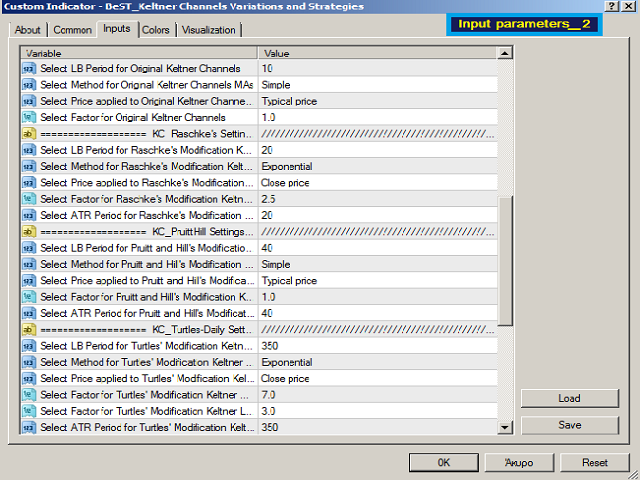
- Original for Keltner’s default settings.
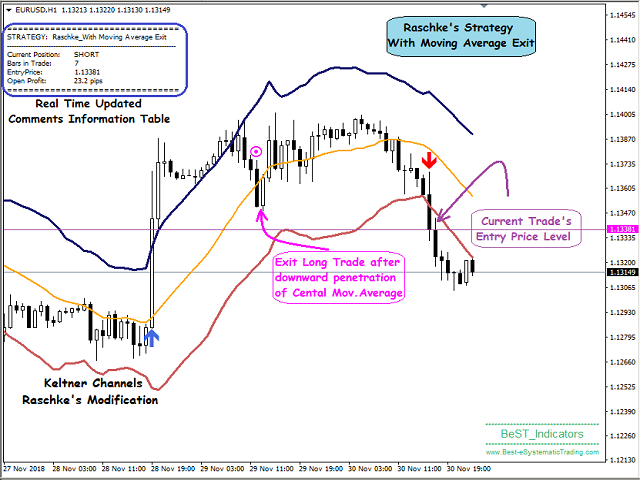
- RaschkeModification for Linda Raschke’s modification.
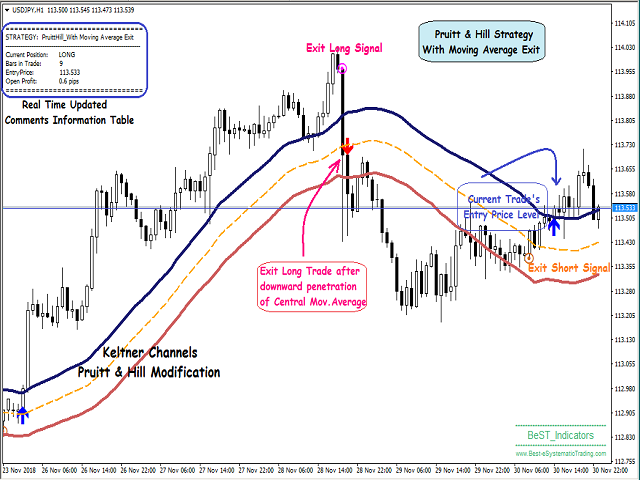
- PruittHillModification that is based on “The King Keltner Trading Strategy” as described in the book Building Winning Trading Systems with TradeStation by G. Pruitt and J. R. Hill.
- TurtlesDailyModification that is based on a variation used by the legendary Turtle Traders and that is presented by Curtis Faith in his book Way Of The Turtle.
- NoATRChannels for any modification that do not use ATR for constucting the boundary Bands and that is used only in Ranging ReEntry Strategies.
- ATRChannels for any modification that uses ATR for constucting the boundary Bands and that is used only in Ranging ReEntry Strategies.
2. Current Market Type
- Trending for all Trending Strategies.
- Ranging for all Ranging Strategies of ReEntry Type.
3. Keltner Channels Strategy
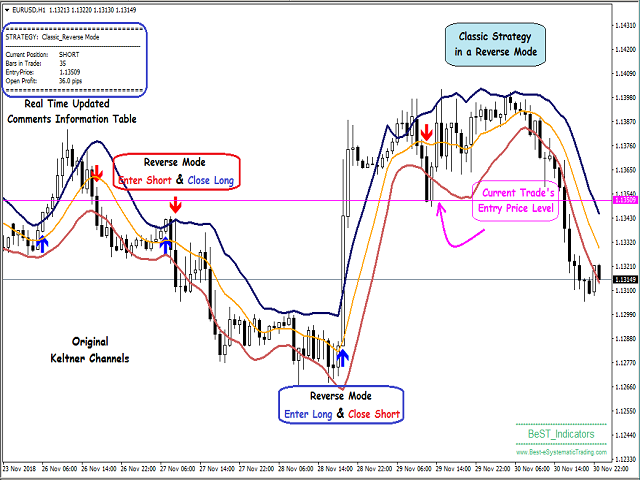
· Classic_ReverseMode: In order to select this strategy we need in the previous options to have already select Keltner Channels Type =Original and Current Market Type =Trending.
· Classic_WithOppositeBandExit : In order to select this strategy we need in the previous options to have already select Keltner Channels Type =Original and Current Market Type =Trending.
· Classic_WithMovAvgExit: In order to select this strategy we need in the previous options to have already select Keltner Channels Type =Original and Current Market Type =Trending.
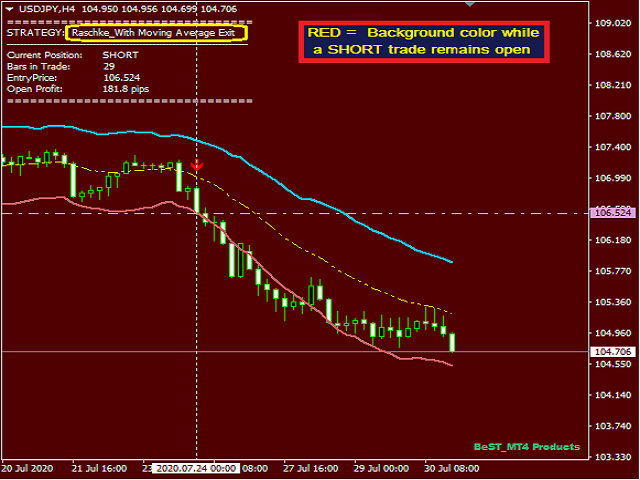
· Raschke_WithMovAvgExit: In order to select this strategy we need in the previous options to have already select Keltner Channels Type =RaschkeModification and Current Market Type =Trending.
· PruittHill_WithMovAvgExit: In order to select this strategy we need in the previous options to have already select Keltner Channels Type =PruittHillModification and Current Market Type =Trending.
· TurtlesDaily_WithMovAvgExit: For selecting this strategy we need in the previous options to have already select Keltner Channels Type =TurtlesDailyModification & Current Market Type =Trending.
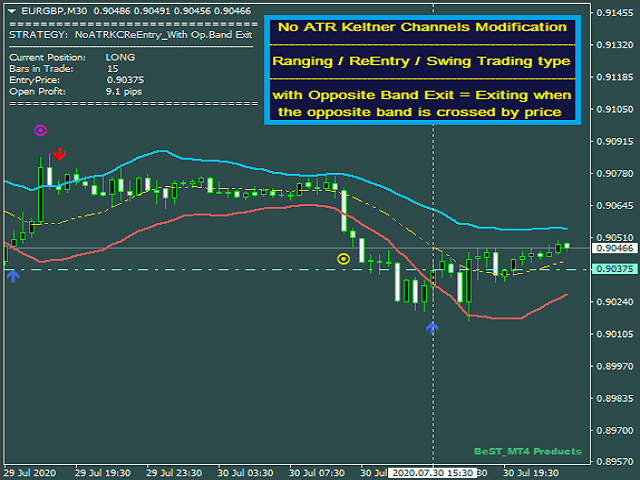
· ReEntry_WithOppositeBandExit: In order to select this strategy we need in the previous options to have already select Keltner Channels Type = NoATRChannels or ATRChannels either of which we prefer and Current Market Type = Ranging.
· ReEntry_WithMovAvgExit: In order to select this strategy we need in the previous options to have already select Keltner Channels Type = NoATRChannels or ATRChannels either of which we prefer and Current Market Type = Ranging.
Other Settings
Here you can select
· Show or Not Keltner Channels
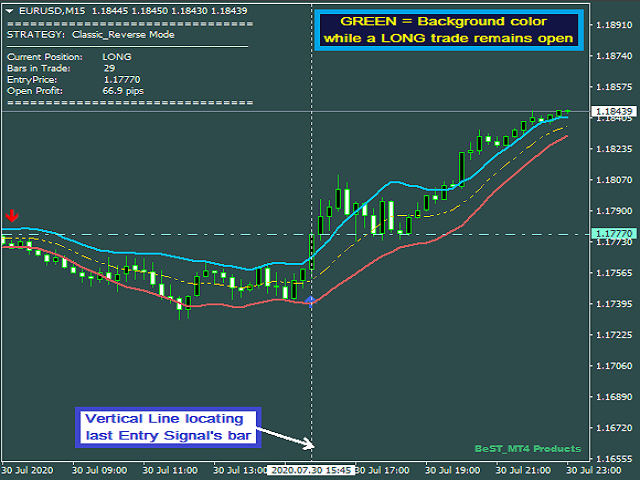
· Show Comments or Not for selecting to Show or Not an information table (Comments) in the upper left corner of the Chart including the name of the selected Strategy,Number of Bars in Current Trade,Entry Price, Open Profit etc.
· Show Entry Price Level or Not
· Color for the Buy Price Line
· Color for the Sell Price Line
· Show or Not Arrows
· Distance between Bars and Arrows
· Size of Entry Arrows
Every other selection is related to the Keltner Channels parameters.
Notes
- All of the above are updated in Real Time while the indicator is non-repainting.
- BeST_Keltner Channels Variations & Strategies is a very useful tool for any trader looking for a simple and handy Trading Strategy. It works on every single timeframe but it certainly is not a complete or automated trading system.So it should be used with caution and usually not alone but with the simultaneous use of other indicators.
For EA Developers
- Buy Arrow : Buffer = 4
- Sell Arrow : Buffer = 5
- Exit Long : Buffer = 6
- Exit Short : Buffer = 7