Semaphore and ABC Pattern
- 지표
- Stoyan Roev
- 버전: 1.2
- 업데이트됨: 30 3월 2018
- 활성화: 10
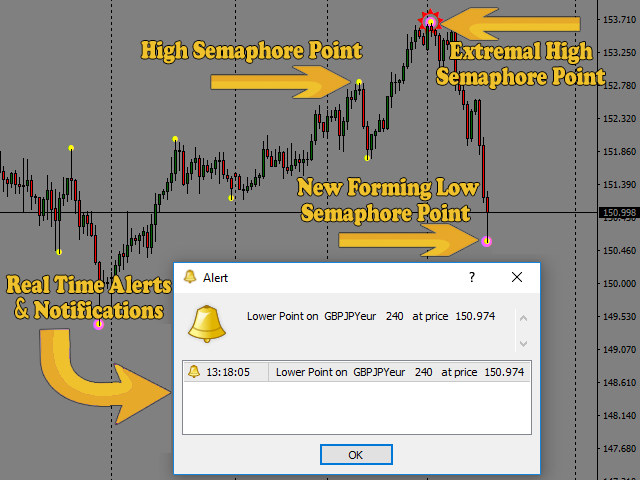
- The indicator places Semaphore points on the maximum and minimum of a higher, medium and lower period.
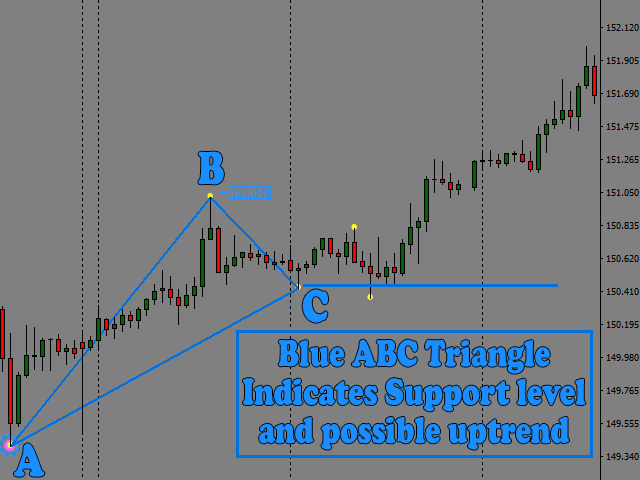
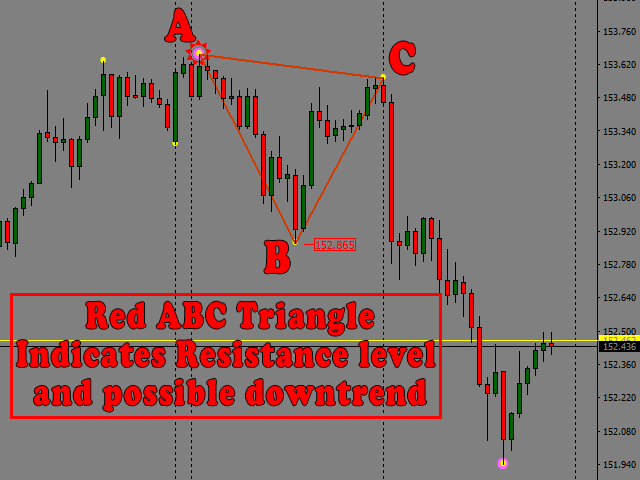
- It includes A,B,C Triangles for easier spotting of reversal chart pattern which occurs very frequently and has a very high success ratio.
- Both Semaphore and A,B,C Triangles have Alerts and Push notifications to a mobile device when they occur on the chart.
- These indicators are very useful for breakout trading and spotting support/resistance levels which gives good opportunities for positions.
| Please visit our blog for step by step strategy guide about the indicator and to study actual trades with explanations. |
|---|
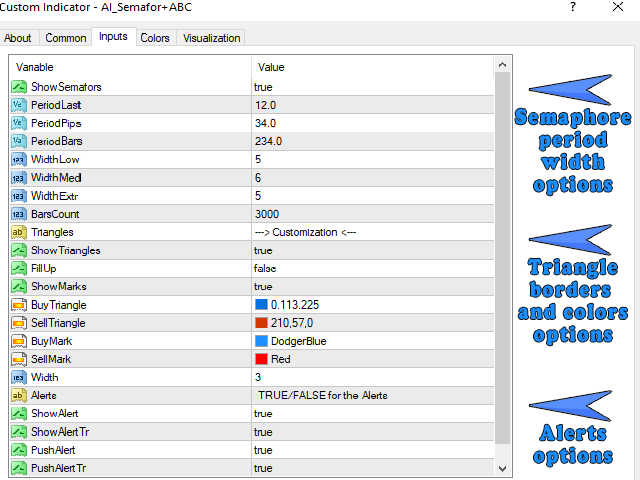
Indicator parameters
- ShowSemafors - show or hide the semaphores (default true)
- PeriodLast - checks the specified number of previous bars to see if they are lower/higher than current semaphore (default 12.0)
- PeriodPips - checks if the current High(Low) is higher(lower) than the last High(Low) between the specified number of pips (default 34.0)
- PeriodBars - you can input the minimum number of bars which are required for a new extremal semaphore to occur (default 234.0)
- WidthLow - width of lower semaphore point (default 5)
- WidthMed - width of medium semaphore point (default 5)
- WidthExtr - width of extremal semaphore point (default 5)
- BarsCount - bars from which semaphores start drawing on the chart (default 3000)
- ShowTriangles - show or hide the triangles (default true)
- FillUp - filling the triangle with the chosen color (default false)
- ShowMarks - show mark with the price of the side on triangle (default true)
- BuyTriangle - color of the Buy Triangle (default is blue)
- SellTriangle - color of the Sell Triangle (default is red)
- BuyMark - color of the buy price mark (default dodger blue)
- SellMark - color of the sell price mark (default red)
- Width - width of lines which forms the triangles (default 3)
- ShowAlert - desktop alert for semaphore (default true)
- ShowAlertTr - desktop alert for triangles (default true)
- PushAlert - mobile phone alert for semaphore (default true)
- PushAlertTr - mobile phone alert for triangles (default true)
How to configure the indicator?
- The indicator is configured with default settings which are most effective.
- If you want to experiment and try different settings you can open Indicator list, choose AI_Semaphore+ABC and click on " Inputs" tab.
- Check the Screenshots to see how to input your parameters correctly.
Сheck the specified number of previous bars to see if they are lower/higher than current semaphore.


I have had this since June 25th. The premise is good and I understand how it may benefit the trader. I have 5 different semaphores, and many were free, but adding the triangle makes good sense. However, unless you are sitting at the computer and flipping through 28 pairs and a multitude of time frames, it will be difficult to catch the trade. I am a swing trader and I understand it takes time for the triangle to appear, but what do they call it when a signal shows up and then disappears? Isn't that called "repainting? I have had triangles show up, but disappear. In fairness, the indicator is not expensive, but nobody should only be given five activations. I trade on many devices and in two weeks I only have two activations remaining. If things change I will update the review for the others. Update. Many of the signals have played out well. As promised, I revisited the review and moved the rating.