Review Candle Chart
- 지표
- Yutaka Okamoto
- 버전: 1.13
- 업데이트됨: 24 5월 2021
- 활성화: 5
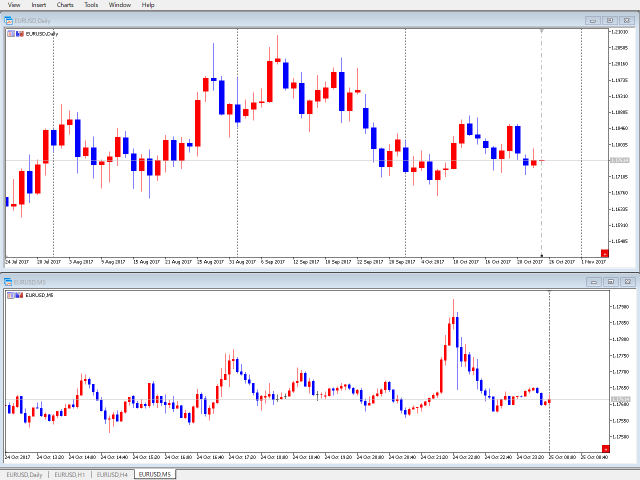
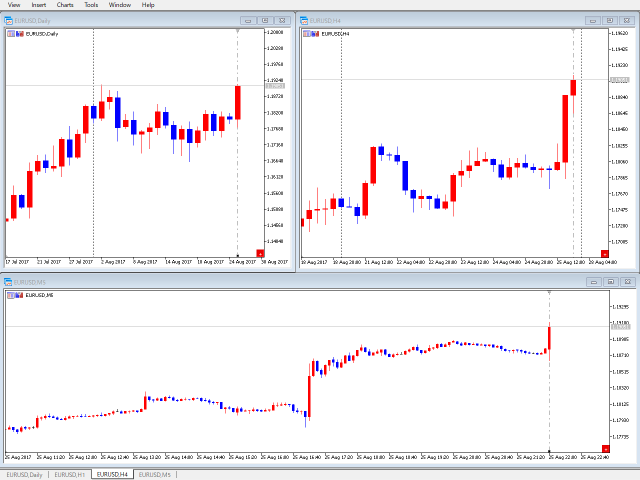
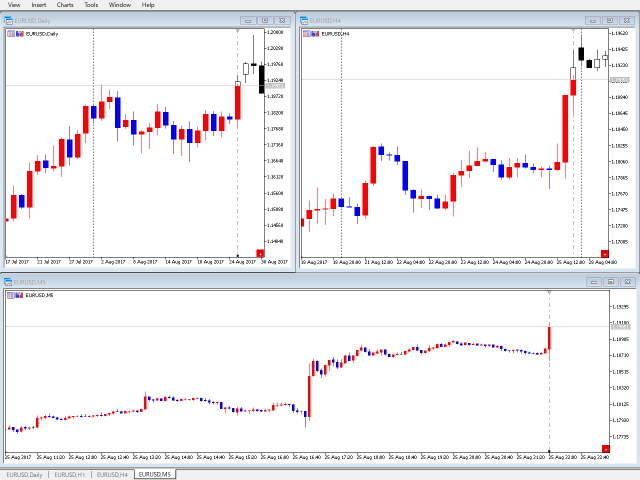
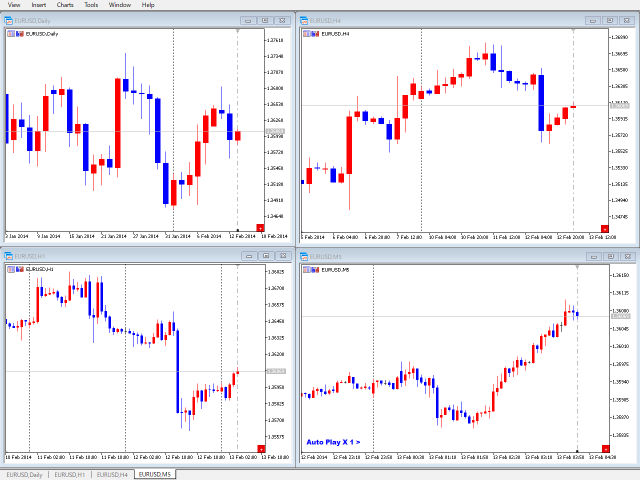
ReviewCandleChart is a unique product that can verify past price fluctuations using candlestick charts.
This indicator accurately reproduces market price fluctuations in the past and can make trading decisions (entries, profits, loss cut) many times so that you can learn the trading faster.
ReviewCandleCahrt is the best indicator to improve trading skills.
ReviewCandleCahrt caters to both beginners and advanced traders.
Advantages of the indicator
- This Indicator for verifying price fluctuation using candlestick charts.
- Synchronize with the same currency pair. -> Added "Synchronization between different currency pairs" setting in paid version
- As with music data (mp3), you can fast-forward , pause or jump and move to the price data you want to check.
- When the start button is on, the candlestick on the right side of the baseline will not be drawn.
- Synchronization is possible by moving the reference line even when the start button is off, depending on the setting.
Please download a free trial version and rate it. ReviewCandleChart(Trial) here:https://www.mql5.com/ja/market/product/26385
Product version has no limit.
How to use the product
After pressing the start button
The vertical baseline is displayed. Move it with the mouse to synchronize other charts. You can select and deselect the vertical baseline with double click.
Use Keys
- R key
- L key
- F key
- Z or X key
- 4 or 6 or 5 (Numlock key)
- A key
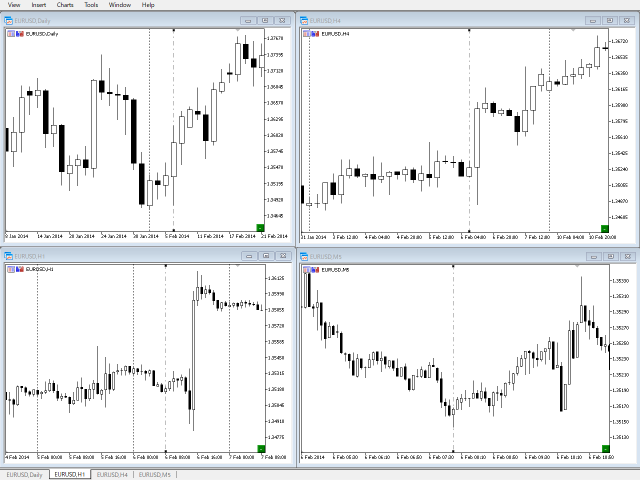
Synchronization of multi-time frames. By moving the chart, draw candlesticks of synchronized currency pairs.If the moved chart is in the lower period, draw a candlestick based on the price drawn in that period.
Before pressing start button
Use Keys
- L key
- T key + pressing start button
Indicator parameters
- base vertical line
- always enabled - Display when the start button is OFF - [false]
- color - [Gray]
- style - [Dashdot]
- width - 2 to 4 are valid only for Solid Style - 1 to 4 - [1]
- Shift right(>=0) - Set the display position of the candlestick at the right end - [1]
- candlestick
- bearish candle color - bear color - [Blue]
- bullish candle color - bull color - [Red]
- doji color - [Black]
- max bar counts (limit) - Maximum number of bars to be calculated. See the note - [100000]
- input keys - Key operation
- Step count - Number of bars to move at one time - 1 or more - [1]
- next - Move to the right - [Key_X]
- back - Move to the left - [Key_Z]
- auto(next) - Move to the right automatically - [Key_NUM6]
- auto(stop) - Stop automatic movement - [Key_NUM5]
- auto(back) - Move to the left automatically - [Key_NUM4]
- redisplay - Move chart to baseline - [Key_R]
- base line - Move the baseline to the position of the displayed chart - [Key_L]
- future - Show / hide candlestick on right side of baseline - [Key_F]
- all chart control - Simultaneous start control of all charts - [Key_A] + start button
- start button
- button corner - Button position - Right Lower or Left Lower - [Right Lower]
- x margin - Horizontal margin - 0 or more - [0]
- y margin - Vertical margin - 0 or more - [15]
- BID price line
- enabled - Display enabled - [true]
- color - [Silver]
- style - [Solid]
- width - 2 to 4 are valid only for Solid Style - 1 to 4 - [1]
- ASK price line
- enabled - Display enabled - [true]
- color - [Silver]
- style - [Solid]
- width - 2 to 4 are valid only for Solid Style - 1 to 4 - [1]
- training mode
- execute with key on - Hold down the designation key and click the start button - [Key_T]
- scale - Set scale display at startup - [show]
- show
- hide date scale
- hide price scale
- hide date/price scale
- randomly position - Randomly determine display position - [false]
- auto play interval
- x1 - [1.8sec]
- x2 - [1.4sec]
- x3 - [1.0sec]
- x4 - [0.8sec]
- x5 - [0.4sec]
- interval-[0.4,0.8,1.0,1.4,1.8,4.0,6.0,8.0,10,15,20,25,30,35,40,45,50,55] sec
- sync
- Different currency pairs - [false]
Note
Setting the maximum number of display bars.
Tools menu>Options>Charts tab > Max bars in chart:
Please set the indicator setting to the same value or a smaller value than the setting value of "Max bars in chart:".
Inputs>candlestick>max bar counts(limit)
Please set the value according to the performance of your PC.
If there is no price data, an error message will be displayed.
>no data found[YYYY.MM.DD] previous data
Developer
Yutaka Okamoto, professional programmer.