TSO Top Bottom Divergence MACD
- 지표
- Dionisis Nikolopoulos
- 버전: 1.32
- 업데이트됨: 13 5월 2019
- 활성화: 10
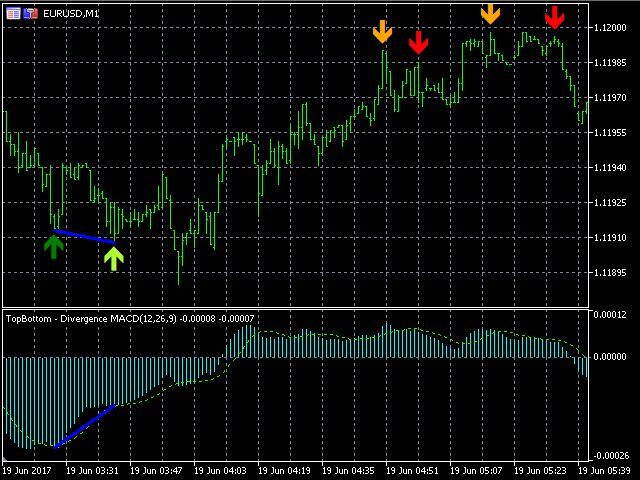
This indicator combines double bottom and double top reversal chart patterns together with detection of divergences between the price chart and the MACD oscillator.
Features
- Easily detect strong reversal signals
- Allows to use double top/bottom and MACD divergence signals combined or independently
- Get email and/or push notification alerts when a signal is detected
- Custom colors can be used
- The indicator is not repainting
- Can easily be used in an EA (see below)
Inputs
- ENABLE Double Top - Bottom: Enable the double top - bottom indicator.
- ENABLE Show Double Top - Bottom Potential: Show Potential Double Top - Bottom before happens(repaint feature)
- ENABLE Divergence: Enable the MACD divergence indicator.
- Fast Period: Set the fast period of the MACD oscillator.
- Slow Period: Set the slow period of the MACD oscillator.
- Signal Period: Set the signal period of the MACD oscillator.
- Applied Price: The candlestick price to be used for MACD calculations.
- Relationship between Double Top-Bottom and MACD Divergence:
- Combined: All Double Top - Bottom signals are shown but only the MACD Divergence Signals that correspond with Double Top - Bottom signals are shown. Both Double Top - Bottom and MACD Divergence indicators should be enabled.
- Independent: Each indicator presents their signals independently.
- Number of Bars (Odd Number) [Affects only Divergence]: This is the number of bars that are required to detect a price high or low, including the top/bottom bar. For example, if set to 5, price HIGHs will be detected at bars which have a HIGH that is higher than the HIGH of the first two bars on their left and right. If MACD Divergence is used independently, it uses this mechanism to detect highs and lows. Otherwise, highs and lows are detected through the Double Top/Bottom indicator.
- Color Settings: Set the colors for the objects shown on the graph.
- ENABLE Alert For Divergences: Get an alert when divergence is detected.
- ENABLE Alert For Double Top - Bottom: Get an alert when double top/bottom is detected.
- ENABLE Metatrader Alert: Get an alert on the MetaTrader platform.
- ENABLE Email Alert: Get an alert to your email.
- ENABLE Push Notification: Get a push notification on your mobile.
For EA Developers
- MACD value: Buffer = 0
- Divergence Signal: Buffer = 1
- Buy=0
- Sell=1
- First Bottom value: Buffer = 2
- Second Bottom value: Buffer = 3
- First Top value: Buffer = 4
- Second Top value: Buffer = 5
- Top/bottom Signal: Buffer = 6
- Buy=0
- Sell=1
- MACD Signal value: Buffer = 7

Very very good Indicator and signals.