Wall AM
- 지표
- Andriy Matviyevs'kyy
- 버전: 26.5
- 업데이트됨: 28 10월 2023
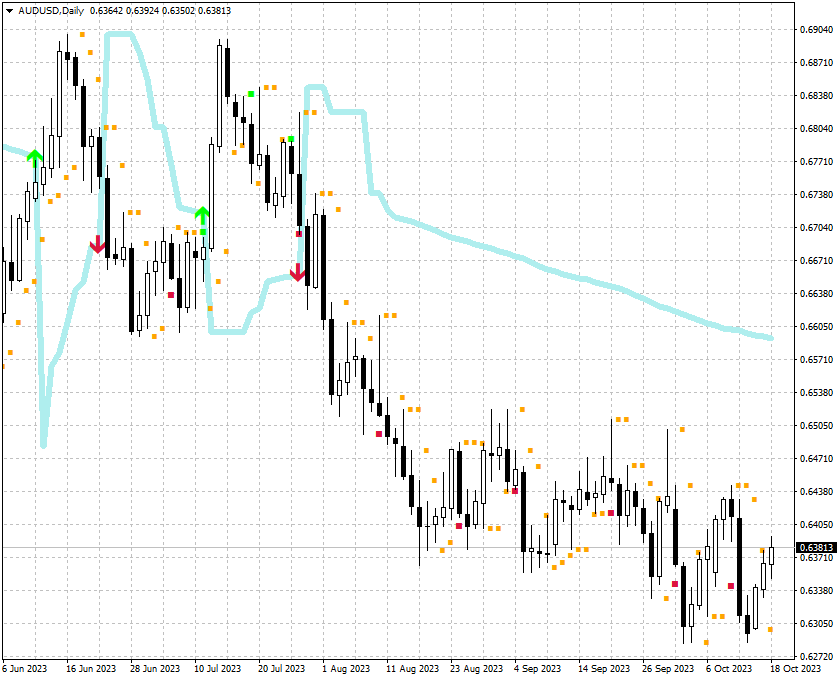
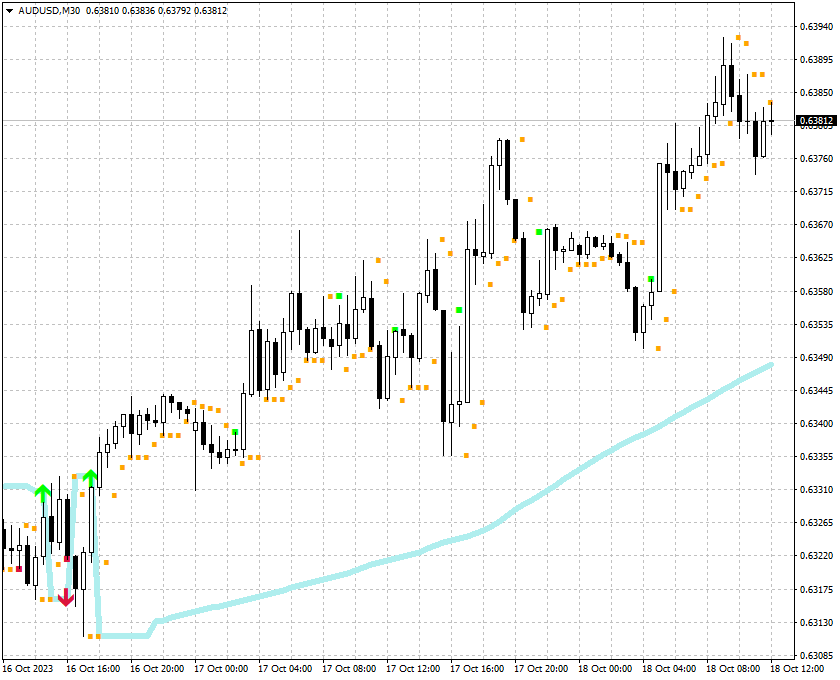
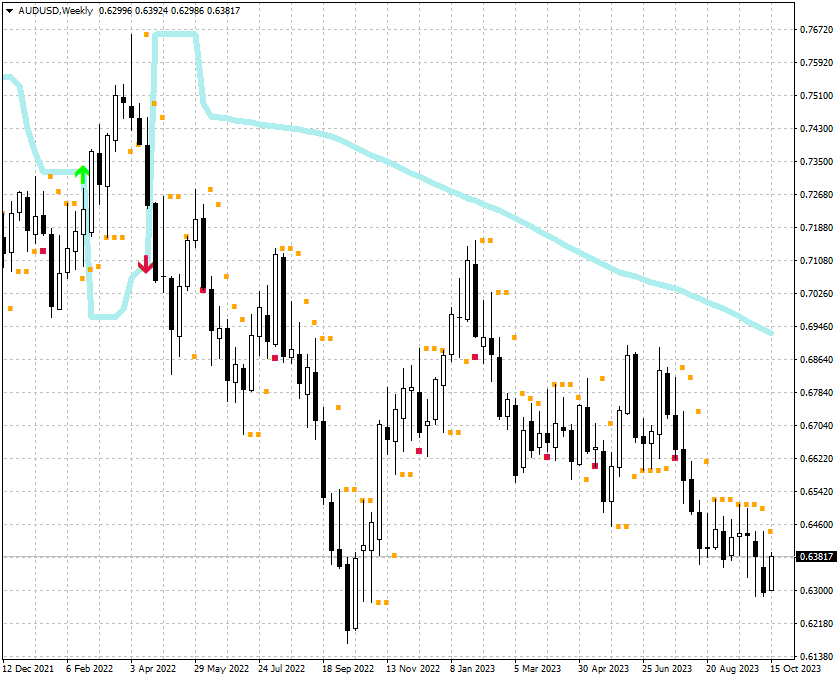
This indicator identifies the current trend, thus allowing the trader to capture a maximum of strong price movements with pending order. The indicator settings are very simple and its application is intuitive. The line serves as a strong support/resistance level depending on its location relative to the price. Individual dots of the indicator mark short-term resistance/support levels. Place pending orders to enter the market above or below (taking the spread into account) those values.
The indicator does not redraw.
Due to its simplicity and efficiency, it is an excellent tool for beginners.