MAS Indicator
- 지표
- Carlo Forni
- 버전: 1.40
MAS Indicator can be used in all currency pairs and at any timeframe, it is suitable for any trading speed. In addition, it's relatively easy to trade with the MAS Indicator.
This indicator produces two signals:
- BUY Signal: arrow deep sky blue
- SELL Signal: arrow red
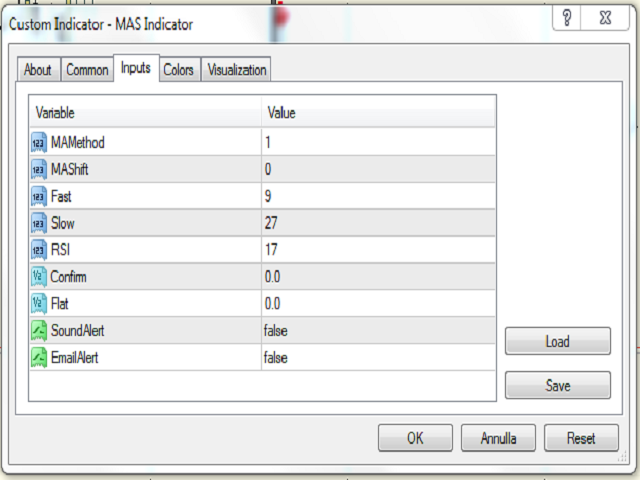
Indicator parameters
- MA Method – type of moving average
- MA Shift – shift moving average
- Fast - fast period moving average
- Slow – slow period moving average
- RSI – value rsi
- Confirm – value confirm
- Flat – value flat
- Colors - colors of arrows
- Visualization - all time frames