• 미리보기
  • 리뷰 (10)
  • 코멘트 (165)
  • 새 소식

X Tick Chart

4.75
  • 지표
  • Artur Zas
  • 버전: 3.22
  • 업데이트됨: 22 7월 2021
  • 활성화: 10

The indicator combines the features of both the Tick charts and Volume Bar charts. The mode can be selected in the indicator's settings.

Tick charts measure the number of transactions per bar. To give you an example if you have a 233 tick chart, each bar measures 233 transactions per bar and a new bar is plotted after 233 transactions. You can choose any number of ticks per bar but most traders choose Fibonacci numbers (1, 2, 3, 5, 8, 13, 21, 34, 55, 89, 144, 233...).

Volume bar charts are designed for use with exchange-traded instruments only (futures, stocks, etc.). Real volume data is needed for the chart to display. If no real volume data is present the chart will fall back to the "tick chart" mode. Real trade volume is used to calculate both live and historical bars. A new bar is formed only after a user-defined number of contracts are traded, aka volume!

For example, on a 4000 volume chart, each completed bar will always encompass a total traded volume of 4000 contracts and a new bar will form once another 4000 contracts are traded. The majority of traders consider volume to be the foundation of technical analysis and the driving force behind price action. Volume bars only print when substantial volume flows into the market, thus volume bars can significantly reduce chop or a sideways market structure. The idea is simple - when there is very little or no volume in the market, a new bar will not print.

Settings

  • Ticks or volume per bar.
  • Show history for a number of days (input the desired number of days (plus the current day) for the amount of history to process).
  • Synchronize the first bar's open on a new day (true/false).
  • Trading session time (HH:mm-HH:mm) - broker's server time is used. Input in the 24H format
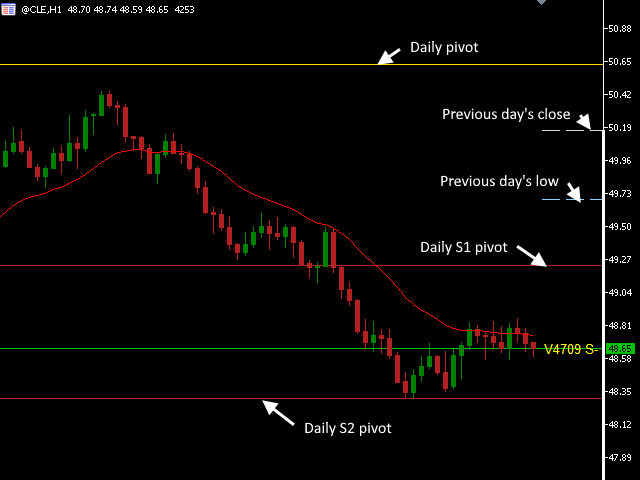
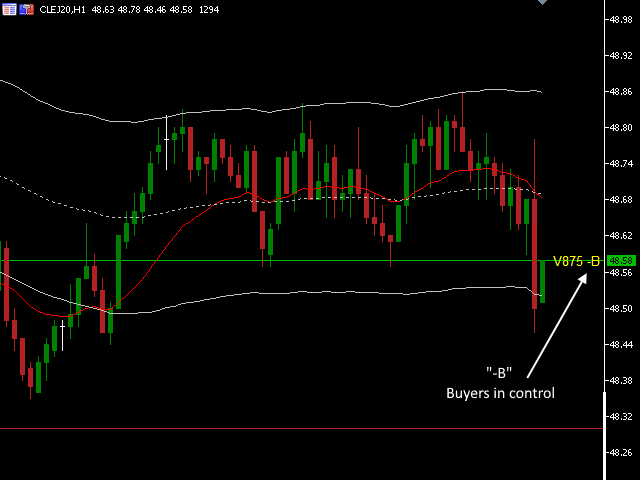
  • Show pivot levels - Show Monthly, Weekly and Daily pivot levels plus Daily R1, R2, R3 & S1, S2, S3 (calculated using Classic or Fibonacci method) as well as previous day's High, Low & Close levels with color definitions.
  • Pivot Point calculation method ( (H+L+C)/3 or (O+H+L+C)/4 ).
  • Pivot & support/resistance color definitions
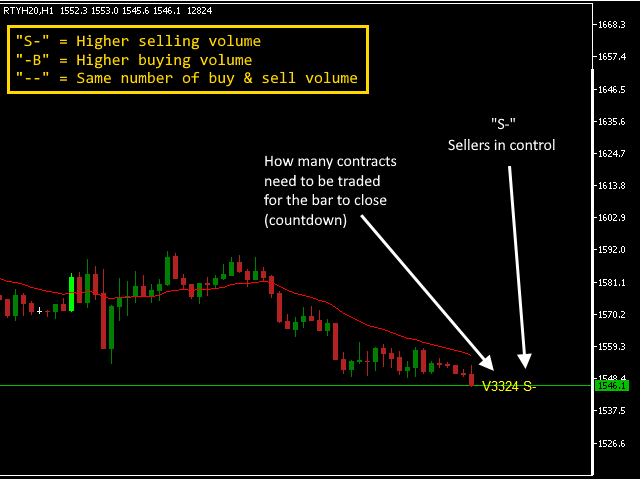
  • Display tick chart info and tick countdown to a new bar (true/false)
  • Alert condition (None / New bar / Reversal bar / MA1 & MA2 crossover / {plus variations})
  • Alert notification type (None /Show in alert box / Play sound / Send push notification / {plus variations})
  • Show MA (Don't show / draw as line / draw as dots)
  • MA period
  • MA method
  • MA apply to
  • MA shift.
  • MA show price label (Yes/No)
  • Show Channel (None, Donchian Channel, Bollinger Bands, Super Trend, Keltner Channel).
  • Channel period.
  • Channel ATR period (used for Keltner Channel only)
  • Channel apply to.
  • Channel multiplier.
  • Channel bands deviations (used for Bullinger Bands only).
  • Channel baands price labels (Yes/No)
  • Channel mid-price label (Yes/No)
  • Indicator used in EA via iCustom() (true/false) - Set this to true only when calling the indicator from an EA, another indicator or Script.
  • Use padding Top/Bottom (0.0 - 1.0) - used to set the margins above and below the visible high & low of the visible tick chart.
  • Show current bar's close projections (true/false) + bullish bar projection color and bearish bar projection color.
  • Use sound file for bullish alerts (.wav sound file located in MetaTrader 5 \Sounds folder).
  • Use sound file for bearish alerts (.wav sound file located in MetaTrader 5 \Sounds folder).
  • Display as a bar chart (true/false).
  • Shift objects with the chart (true/false)

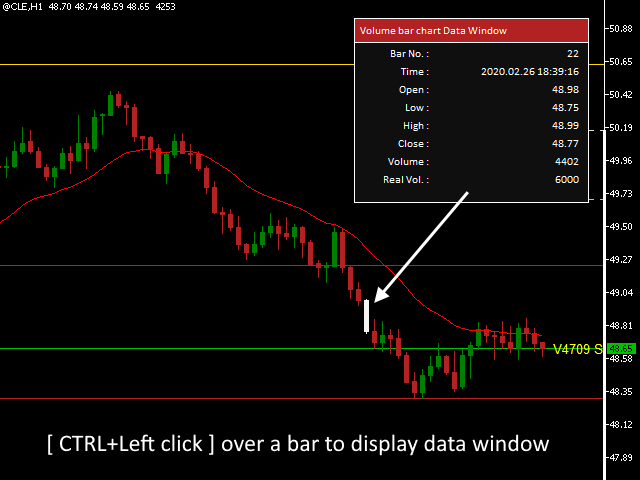
The indicator also features a custom data window where you can inspect each bar's OLHC prices as well as the bar's open time.

The data window is displayed by left-clicking on the selected candle while holding down the Ctrl key on your keyboard.

Chart autoscale feature can be toggled ON/OFF using Ctrl+Q

리뷰 10
nakagawa TOMOHIRO
36
nakagawa TOMOHIRO 2021.07.11 12:53 
 

it's so usuful, used with keltner channel

LIBRADOLAR
28
LIBRADOLAR 2020.08.06 13:09 
 

MUY BUENO, LO MEJOR DE METATRADER 5

Devonish
2938
Devonish 2019.09.06 12:59 
 

Very good. Well thought out and useful with the MA's and Pivot points. Good for candle analysis.

추천 제품
Blahtech Market Profile MT5
Blahtech Limited
5 (8)
Was: $249  Now: $99   Market Profile defines a number of day types that can help the trader to determine market behaviour. A key feature is the Value Area, representing the range of price action where 70% of trading took place. Understanding the Value Area can give traders valuable insight into market direction and establish the higher odds trade. It is an excellent addition to any system you may be using. Inspired by Jim Dalton’s book “Mind Over Markets”, this indicator is designed to suit the
BoxChart MT5
Evgeny Shevtsov
5 (7)
The market is unfair if only because 10% of participants manage 90% of funds. An ordinary trader has slim changes to stand against these "vultures". This problem can be solved. You just need to be among these 10%, learn to predict their intentions and move with them. Volume is the only preemptive factor that faultlessly works on any timeframe and symbol. First, the volume appears and is accumulated, and only then the price moves. The price moves from one volume to another. Areas of volume accumu
This indicator allows you to enjoy the two most popular products for analyzing request volumes and market deals at a favorable price: Actual Depth of Market Chart Actual Tick Footprint Volume Chart This product combines the power of both indicators and is provided as a single file. The functionality of Actual COMBO Depth of Market AND Tick Volume Chart is fully identical to the original indicators. You will enjoy the power of these two products combined into the single super-indicator! Below is
Market Profile MetaTrader System  — is a classic Market Profile implementation that can show the price density over time, outlining the most important price levels, value area, and control value of a given trading session. This indicator can be attached to timeframes between M1 and D1 and will show the Market Profile for daily, weekly, monthly, or even intraday sessions. Lower timeframes offer higher precision. Higher timeframes are recommended for better visibility. It is also possible to use a
Market profile was developed by Peter Steidlmayer in the second half of last century. This is a very effective tool if you understand the nature and usage. It's not like common tools like EMA, RSI, MACD or Bollinger Bands. It operates independently of price, not based on price but its core is volume. The volume is normal, as the instrument is sung everywhere. But the special thing here is that the Market Profile represents the volume at each price level. 1. Price Histogram The Price Histogram
VolumeDeltaBars
Stanislav Korotky
This indicator is a conventional analytical tool for tick volumes changes. It calculates tick volumes for buys and sells separately, and their delta on every bar, and displays volumes by price clusters (cells) within a specified bar (usually the latest one). The algorithm used internally is the same as in the indicator VolumeDeltaMT5 , but results are shown as cumulative volume delta bars (candlesticks). Analogous indicator for MetaTrader 4 exists - CumulativeDeltaBars . This is a limited substi
Trading Utility for Forex Currency Pairs Only not for Gold  Functions Auto Lot Calculation based on Risk Auto stoploss  Auto TakeProfit Breakeven Auto Close Half % Close in percentage with respect to the PIPs Pending Orders BuyLimit Sell Limit with distances BuyStop Sell Stop    with distances Trading Informations Risk in percentage For Multiple trades Combine Takeprofit and Combine Stoplosses
Blahtech Supply Demand MT5
Blahtech Limited
4.57 (14)
Was: $299  Now: $99   Supply Demand uses previous price action to identify potential imbalances between buyers and sellers. The key is to identify the better odds zones, not just the untouched ones. Blahtech Supply Demand indicator delivers functionality previously unavailable on any trading platform. This 4-in-1 indicator not only highlights the higher probability zones using a multi-criteria strength engine, but also combines it with multi-timeframe trend analysis, previously confirmed swings
표시기는 현재 시세를 작성하여 과거 시세와 비교할 수 있으며 이를 바탕으로 가격 변동을 예측합니다. 표시기에는 원하는 날짜로 빠르게 이동할 수 있는 텍스트 필드가 있습니다. 옵션: 기호 - 표시기가 표시할 기호 선택. SymbolPeriod - 지표가 데이터를 가져올 기간 선택. IndicatorColor - 표시기 색상. HorisontalShift - 지시자가 그린 따옴표를 지정된 막대 수만큼 이동합니다. Inverse - true는 인용 부호를 반대로, false - 원래 보기를 반전합니다. ChartVerticalShiftStep - 차트를 수직으로 이동합니다(키보드의 위/아래 화살표). 다음은 날짜를 입력할 수 있는 텍스트 필드의 설정으로, '엔터'를 누르면 즉시 이동할 수 있습니다.
The SafeProfit Market Profile is the most advanced tracking indicator in the Forex Market. It was developed to track the market profile of each session of the day: Asian, European and American. With this indicator you will operate Intraday smiling ... knowing exactly where the Big Players are positioned and the exact moment where they are going to. The indicator is simple, fast and objective, tracking every movement of the Big Players in price. Get out of the 95% statistic that only loses and us
이 표시기의 고유성은 거래량 계산 알고리즘에 있습니다. 누적은 하루의 시작을 참조하지 않고 선택한 기간 동안 직접 발생합니다. 마지막 막대는 계산에서 제외할 수 있습니다. 그러면 현재 데이터가 이전에 형성된 중요한 수준(볼륨)에 미치는 영향이 줄어듭니다. 보다 정확한 계산을 위해 기본적으로 M1 그래프의 데이터가 사용됩니다. 가격 볼륨의 분배 단계가 규제됩니다. 기본적으로 디스플레이의 오른쪽 테두리는 분석에 사용된 데이터의 시작 부분에 해당하는 막대로 설정되어 있지만, 필요한 경우 필요한 막대로 설정할 수 있습니다. 표시된 볼륨 밴드의 길이(오른쪽 테두리)는 계수에 의해 조절되며 왼쪽 또는 오른쪽으로 0(현재) 막대로 이동하거나 현재 막대를 참조하여 미러링할 수도 있습니다. 매개변수: Accumulation period - 부피 누적 계산 기간 Number of excluded last bars - 계산에서 제외된 마지막 막대의 수 Accumulation price step - 가격
Before installing the HeatMap indicator make sure you are using a broker that gives you access to the Depth of market (DOM) !! This indicator creates a heatmap on your chart allowing you to see the buy or sell limit orders easily and in real time. You have the possibility to change the setting and the colors of the HeatMap in order to adapt to all markets and all charts. Here is an example of a setting you can use with the NASDAQ100 on the AMPGlobal broker :  https://www.youtube.com/watch?v=x0
Noize Absorption Index
Ekaterina Saltykova
Noize Absorption Index - is the manual trading system that measures the difference of pressure between bears forces and bulls forces. Green line - is a noize free index that showing curent situation. Zero value of index shows totally choppy/flat market.Values above zero level shows how powerfull bullish wave is and values below zero measures bearish forces.Up arrow appears on bearish market when it's ready to reverse, dn arrow appears on weak bullish market, as a result of reverse expectation.
A "Volume Profile" is an advanced charting indicator that displays total volume traded at every price level over a user specified time period. The main components of the volume profile are POC ( Point Of Control - the price level, at which the maximum number of contracts were executed during a selected period), VAH ( Value Area High - the highest price in the Value Area) and VAL ( Value Area Low - the lowest price in the Value Area). When we settled on the original indicator, we spent a lot o
VolumeProfile MT5
Robert Hess
3.75 (8)
Description: The Volume Profile displays detailed informations of historical trading activities at certain price levels (Market Profile). Locate the areas with the best prices in the market and get an advantage over other market participants. Support: The indicator is constantly being developed and improved. Please do not hesitate to contact me via the MQL5 Platform. I am very grateful about any Bug report, so that i can constantly improve the indicator. I appreciate any public review for this
Bear Bull
Ignacio Agustin Mene Franco
Bear Bull! It is an indicator that marks with Heikin Ashi candles but modified, the sales and purchases long and short trend! with 2 colors green marks the purchase, purple marks the sale, works for any type of temporality, works for forex markets and synthetic indices! ideal for any pair, it also works for crypto pairs, Good profit! World Investor - World Inversor - 
Golden Limit
Renato Fridschtein
There are no limits! Golden Limit is the ultimate indicator to get clear and easy readings of price movements on charts. It projects support and resistance ranges, calculated by statistical models involving Price Action and the Fibonacci sequence, revealing in advance the behavior of prices and the best places to trade and not to trade. It also has two moving averages to help choose the best entries. The Golden Limit method was created from a proven model. In summary: We use the names of preci
Moving VVC mt5
Andriy Sydoruk
The   Visual Volatility Clustering   indicator clusters the market based on volatility. The indicator does not redraw and gives accurate data, does not use closing prices. Uses the opening prices or the highs or lows of the previous completed bar. Therefore, all information will be clear and unambiguous. The essence of the indicator is to divide the price market into certain areas according to a similar type of volatility. This can be done in any way. In this example, the indicator is configure
Horizontal tick volumes (HTV) Horizontal tick volumes - an easy and convenient indicator of the horizontal market profile in a user-selected time interval, now also for MT5. It has fast dynamics of displaying horizontal tick volumes on the chart. Produces a visual image of strong trading levels by maximum peaks past volumes and trading direction by color (sell or buy), and also allows you to detect smaller trading levels by differentiating past volumes. In the "Optimal" mode, when displayed on c
PZ Trend Trading MT5
PZ TRADING SLU
3.67 (3)
Trend Trading is an indicator designed to profit as much as possible from trends taking place in the market, by timing pullbacks and breakouts. It finds trading opportunities by analyzing what the price is doing during established trends. [ Installation Guide | Update Guide | Troubleshooting | FAQ | All Products ] Trade financial markets with confidence and efficiency Profit from established trends without getting whipsawed Recognize profitable pullbacks, breakouts and early reversals The ind
The   Visual Volatility Clustering   indicator clusters the market based on volatility. The indicator does not redraw and gives accurate data, does not use closing prices. Uses the opening prices or the highs or lows of the previous completed bar. Therefore, all information will be clear and unambiguous. The essence of the indicator is to divide the price market into certain areas according to a similar type of volatility. This can be done in any way. In this example, the indicator is configure
Order Book, known also as Market Book, market depth, Level 2, - is a dynamically updated table with current volumes of orders to buy and to sell specific financial instument at price levels near Bid and Ask. MetaTrader 5 provides the means for receiving market book from your broker, but in real time only, without access to its history. The indicator OrderBook Cumulative Indicator accumulates market book data online and visualizes them on the chart. In addition, the indicator can show the market
이 표시기는 차트의 모든 주문에 대해 이미 설정한 TP 및 SL 값(해당 통화로)을 표시하여 모든 주문에 대한 손익을 추정하는 데 많은 도움이 됩니다(거래/주문 라인에 닫힘). 또한 PIP 값도 표시됩니다. 표시된 형식은 "이익 또는 손실 / PIP 값의 통화 값"입니다. TP 값은 녹색으로 표시되고 SL 값은 빨간색으로 표시됩니다.. 질문이나 자세한 내용은 fxlife.asia@hotmail.com  or  fxlife.asia@yahoo.com 으로 판매자에게 언제든지 문의하십시오. (그리고 곧 표시기에 추가될 다음 기능은 "자동 또는 반자동 TP 및 SL 설정"이며 고객은 무료로 업데이트 버전을 받을 것입니다. 감사합니다...) (또는 표시에 일부 기능을 추가해야 한다고 생각하시면 언제든지 말씀해 주십시오...)
Value Chart Candlesticks
Flavio Javier Jarabeck
4.67 (9)
The idea of a Value Chart indicator was presented in the very good book I read back in 2020 , " Dynamic Trading Indicators: Winning with Value Charts and Price Action Profile ", from the authors Mark Helweg and David Stendahl. The idea is simple and the result is pure genius: Present candlestick Price analysis in a detrended way! HOW TO READ THIS INDICATOR Look for Overbought and Oversold levels. Of course, you will need to test the settings a lot to find the "correct" one for your approach.
FREE
Color Histogram Volume Set
Ricardo Almeida Branco
Do you use volume in your reading of the market? Certainly many traders use it, and do not imagine operating without it. The Color Histogram Volume Set indicator allows the user to choose the value that he considers interesting to monitor. When you pass this you will have visual confirmation and if you want you will also have the audible alert that is given by the indicator. Of course, there are other ways to try to find a high volume, such as assessing whether the volume
POC level MT5
Mikhail Nazarenko
The indicator automatically calculates       and displays the level of the maximum       real   volume Point Of Control (POC) of the Market Profile for the   array of candles   highlighted by a rectangular area. This will significantly increase the accuracy of your position entries when trading POC bounces and reversals. Attention when testing the demo version!   In the MT5 strategy tester , there is no possibility of dragging a rectangle and this is a problem of limitations of the MT5 strategy
Premium level Pro
Dmitriy Kashevich
Premium level is a unique indicator with more than 80% accuracy of correct predictions! This indicator has been tested for more than two months by the best Trading Specialists! The author's indicator you will not find anywhere else! From the screenshots you can see for yourself the accuracy of this tool! 1 is great for trading binary options with an expiration time of 1 candle. 2 works on all currency pairs, stocks, commodities, cryptocurrencies Instructions: As soon as the red ar
No Demand No Supply MT5
Trade The Volume Waves Single Member P.C.
No Demand No Supply   This indicator identifies   No Demand –No Supply candles  to your chart and plots volume bars colored according to the signal. It can be applied to all timeframes or to a specific one only. It can also be used as regular volume indicator  with exceptional future of WEIGHTED VOLUME. Furthermore is has an alert notification, sound and email when a signals occurs. The indicator does not repaint but the alert will come on two candles back due to the definition of No Demand No S
The VWAP indicator is our version of the popular Volume-Weighted Average Price indicator. The VWAP is the ratio between the value traded (price multiplied by the number of volume traded) and the total volume traded over a specific time period. As a result, it measures the average price of the instrument much better than the simple moving average. Although there are many ways to use the VWAP, most investors use it to calculate the daily average.  The indicator works in five modes: Moving  - In
이 표시기는 시장 분석을 위한 가장 효과적인 도구 중 하나인 피보나치 지원 및 저항 수준을 자동으로 계산하고 표시합니다. 계산은 선택한 기간 및 기간 동안의 평균 가격 데이터를 사용합니다. 이 기간의 최소값과 최대값은 이동의 시작과 끝으로 간주됩니다. 피보나치 수준을 사용하면 가격 움직임이 느려지거나 역전될 수 있는 잠재적인 기준점을 볼 수 있습니다. 즉, 추가 움직임을 예측하고 정지 및 지정가 주문을 하는 데 사용됩니다. 매개변수: PartsShow - 현재 막대에서 표시된 과거 레벨의 수 CalcPeriod - 가격 평균화 기간 SmoothingMethod - 가격 평균화 방법(26개 옵션) TF - 계산에 사용되는 기간 LevelColor - 레벨 라인의 색상 ZeroLevelColor - 제로 레벨 색상 ShowVerticalLine - 레벨 사이의 수직선 표시 활성화/비활성화 VLineStyle - 수직선의 스타일 VLineColor - 수직선의 색상 ShowInfo - 레
이 제품의 구매자들이 또한 구매함
우선 이 거래 시스템이 리페인팅, 리드로잉 및 레이그 인디케이터가 아니라는 점을 강조하는 것이 중요합니다. 이는 수동 및 로봇 거래 모두에 이상적인 것으로 만듭니다. "스마트 트렌드 트레이딩 시스템 MT5"은 새로운 및 경험이 풍부한 트레이더를 위해 맞춤형으로 제작된 종합적인 거래 솔루션입니다. 10개 이상의 프리미엄 인디케이터를 결합하고 7개 이상의 견고한 거래 전략을 특징으로 하여 다양한 시장 조건에 대한 다목적 선택이 가능합니다. 트렌드 추종 전략: 효과적인 트렌드 추이를 타기 위한 정확한 진입 및 손절 관리를 제공합니다. 반전 전략: 잠재적인 트렌드 반전을 식별하여 트레이더가 범위 시장을 활용할 수 있게 합니다. 스캘핑 전략: 빠르고 정확한 데이 트레이딩 및 단기 거래를 위해 설계되었습니다. 안정성: 모든 인디케이터가 리페인팅, 리드로잉 및 레이그가 아니므로 신뢰할 수 있는 신호를 보장합니다. 맞춤화: 개별 거래 선호도를 고려한 맞춤형 전략을 지원합니다. 최상의 전략을 찾는
Atomic Analyst MT5
Issam Kassas
4.27 (11)
우선적으로 언급할 점은이 거래 지표가 다시 그리지 않고 지연되지 않으며 이를 통해 수동 및 로봇 거래 모두에 이상적이라는 점입니다. Atomic Analyst는 가격의 강도와 모멘텀을 활용하여 시장에서 더 나은 이점을 찾는 PA Price Action Indicator입니다. 고급 필터를 장착하여 잡음과 거짓 신호를 제거하고 거래 잠재력을 높이는 데 도움이 됩니다. 복잡한 지표의 다중 레이어를 사용하여 Atomic Analyst는 차트를 스캔하고 복잡한 수학적 계산을 간단한 신호와 색상으로 변환하여 초보 트레이더가 이해하고 일관된 거래 결정을 내릴 수 있도록합니다. "Atomic Analyst"는 새로운 및 경험이 풍부한 트레이더를위한 종합적인 거래 솔루션입니다. 프리미엄 지표와 최고 수준의 기능을 하나의 거래 전략에 결합하여 모든 종류의 트레이더에 대한 다재다능한 선택지가되었습니다. 인트라데이 거래 및 스캘핑 전략 : 빠르고 정확한 일일 거래 및 단기 거래를 위해 설계
FX Volume MT5
Daniel Stein
4.94 (17)
모닝 브리핑을 통해 세부 정보와 스크린샷으로 매일 시장 업데이트를 받으세요 여기 mql5 및 텔레그램에서 FX 거래량은 브로커의 관점에서 시장 심리에 대한 실제 통찰력을 제공하는 최초이자 유일한 거래량 지표입니다. 브로커와 같은 기관 시장 참여자가 외환 시장에서 어떤 포지션을 취하고 있는지에 대한 훌륭한 통찰력을 COT 보고서보다 훨씬 빠르게 제공합니다. 차트에서 이 정보를 직접 확인하는 것은 트레이딩의 진정한 판도를 바꾸고 획기적인 솔루션입니다. 다음과 같은 고유한 시장 데이터 인사이트의 이점 비율 는 통화의 매수/매도 포지션 비율을 백분율로 표시 비율 변화 는 선택한 기간 내 매수 비율과 비율 변화를 표시 총 거래량 는 해당 통화의 총 거래량(롱 및 숏)을 로트 단위로 보여줍니다 Volumes Long 는 해당 통화의 모든 롱 포지션의 거래량을 보여줍니다 Volumes Short 는 해당 통화의 모든 숏 포지션의 거래량을 보여줍니다 Net Long 는 순 롱 포지션의 거래량
Quantum Trend Sniper
Bogdan Ion Puscasu
5 (37)
소개       Quantum Trend Sniper Indicator는   추세 반전을 식별하고 거래하는 방식을 변화시키는 획기적인 MQL5 지표입니다! 13년 이상의 거래 경험을 가진 숙련된 트레이더 팀이 개발한       Quantum Trend Sniper 표시기       매우 높은 정확도로 추세 반전을 식별하는 혁신적인 방법으로 거래 여정을 새로운 차원으로 끌어올리도록 설계되었습니다. ***Quantum Trend Sniper Indicator를 구입하면 Quantum Breakout Indicator를 무료로 받을 수 있습니다!*** Quantum Trend Sniper Indicator는 추세 반전을 식별하고 세 가지 이익실현 수준을 제안할 때 경고, 신호 화살표를 제공합니다. 초보자 거래자와 전문 거래자 모두에게 적합합니다. Quantum EA 채널:       여기를 클릭하세요 MT4 버전:       여기를 클릭하세요
Gold Stuff mt5
Vasiliy Strukov
4.89 (166)
Gold Stuff mt5는 금을 위해 특별히 설계된 추세 지표이며 모든 금융 상품에서도 사용할 수 있습니다. 표시기가 다시 그려지지 않고 지연되지 않습니다. 권장 기간 H1. 설정 및 개인 보너스를 받으려면 구매 후 즉시 저에게 연락하십시오!   설정 화살표 그리기 - 켜기 끄기. 차트에 화살표 그리기. 경고 - 가청 경고를 끕니다. 이메일 알림 - 켜기 끄기. 이메일 알림. Puch-notification - 켜기 끄기. 푸시 알림. 다음으로 색 영역을 조정합니다. Gold Stuff mt5는 금을 위해 특별히 설계된 추세 지표이며 모든 금융 상품에서도 사용할 수 있습니다. 표시기가 다시 그려지지 않고 지연되지 않습니다. 권장 기간 H1. 설정 및 개인 보너스를 받으려면 구매 후 즉시 저에게 연락하십시오!   설정 화살표 그리기 - 켜기 끄기. 차트에 화살표 그리기. 경고 - 가청 경고를 끕니다. 이메일 알림 - 켜기 끄기. 이메일 알림. Puch-noti
Trend Screener Pro MT5
STE S.S.COMPANY
4.89 (61)
트렌드 표시기, 트렌드 트레이딩 및 필터링을 위한 획기적인 고유 솔루션, 하나의 도구 안에 내장된 모든 중요한 트렌드 기능! Forex, 상품, 암호 화폐, 지수 및 주식과 같은 모든 기호/도구에 사용할 수 있는 100% 다시 칠하지 않는 다중 시간 프레임 및 다중 통화 표시기입니다. Trend Screener는 차트에 점이 있는 화살표 추세 신호를 제공하는 효율적인 지표 추세 추종 지표입니다. 추세 분석기 표시기에서 사용할 수 있는 기능: 1. 트렌드 스캐너. 2. 최대 이익 분석이 있는 추세선. 3. 추세 통화 강도 측정기. 4. 경고가 있는 추세 반전 점. 5. 경고가 있는 강력한 추세 점. 6. 추세 화살표 Trend Screener Indicator가 있는 일일 분석 예, 일일 신호 성능...등은 여기에서 찾을 수 있습니다. 여기를 클릭하십시오. LIMITED TIME OFFER : Trend Screener Indicator는 50$ 및 평생 동안만 사용할 수 있습니다
RelicusRoad Pro MT5
Relicus LLC
4.82 (22)
이제 $ 147 (몇 가지 업데이트 후 $ 499 증가) - 무제한 계정 (PCS 또는 MACS) RelicusRoad 사용 설명서 + 교육 비디오 + 비공개 Discord 그룹 액세스 + VIP 상태 시장을 보는 새로운 방법 RelicusRoad는 외환, 선물, 암호화폐, 주식 및 지수에 대한 세계에서 가장 강력한 거래 지표로서 거래자에게 수익성을 유지하는 데 필요한 모든 정보와 도구를 제공합니다. 우리는 초보자부터 고급까지 모든 거래자가 성공할 수 있도록 기술적 분석 및 거래 계획을 제공합니다. 미래 시장을 예측할 수 있는 충분한 정보를 제공하는 핵심 거래 지표입니다. 우리는 차트에서 말이 안 되는 여러 지표 대신 완전한 솔루션을 믿습니다. 타의 추종을 불허하는 매우 정확한 신호, 화살표 + 가격 조치 정보를 표시하는 올인원 표시기입니다. 강력한 AI를 기반으로 하는 RelicusRoad는 누락된 정보와 도구를 제공하여 교육하고 성공적인 트레이더인 트레이딩 전문
우선적으로, 이 거래 도구는 전문적인 거래에 이상적인 비-다시 그리기 및 지연되지 않는 지표입니다.  스마트 가격 액션 컨셉트 인디케이터는 신규 및 경험 많은 트레이더 모두에게 매우 강력한 도구입니다. Inner Circle Trader Analysis 및 Smart Money Concepts Trading Strategies와 같은 고급 거래 아이디어를 결합하여 20가지 이상의 유용한 지표를 하나로 결합합니다. 이 인디케이터는 스마트 머니 컨셉트에 중점을 두어 대형 기관의 거래 방식을 제공하고 이동을 예측하는 데 도움을 줍니다.  특히 유동성 분석에 뛰어나 기관이 어떻게 거래하는지 이해하는 데 도움을 줍니다. 시장 트렌드를 예측하고 가격 변동을 신중하게 분석하는 데 탁월합니다. 귀하의 거래를 기관 전략에 맞추어 시장의 동향에 대해 더 정확한 예측을 할 수 있습니다. 이 인디케이터는 시장 구조를 분석하고 중요한 주문 블록을 식별하고 다양한 패턴을 인식하는 데 뛰어납니다. 
Entry Points Pro for MT5
Yury Orlov
4.54 (157)
다시 색을 칠하지 않고 거래에 진입할 수 있는 정확한 신호를 제공하는 MT5용 지표입니다. 외환, 암호화폐, 금속, 주식, 지수 등 모든 금융 자산에 적용할 수 있습니다. 매우 정확한 추정값을 제공하고 매수와 매도의 가장 좋은 시점을 알려줍니다. 하나의 시그널로 수익을 내는 지표의 예와 함께 비디오 (6:22)시청하십시오! 대부분의 거래자는 Entry Points Pro 지표의 도움으로 첫 거래 주 동안 트레이딩 결과를 개선합니다. 저희의   Telegram Group 을 구독하세요! Entry Points Pro 지표의 좋은점. 재도색이 없는 진입 신호 신호가 나타나고 확인되면(시그널 캔들이 완성된 경우) 신호는 더 이상 사라지지 않습니다. 여타 보조지표의 경우 신호를 표시한 다음 제거되기 때문에 큰 재정적 손실로 이어집니다. 오류 없는 거래 게시 알고리즘을 통해 트레이드(진입 또는 청산)를 할 이상적인 순간을 찾을 수 있으며, 이를 통해 이를 사용하는 모든 거래자의
FX Power MT5 NG
Daniel Stein
5 (4)
모닝 브리핑 여기 mql5 와 텔레그램에서 FX Power MT5 NG 는 오랫동안 인기 있는 통화 강도 측정기인 FX Power의 차세대 버전입니다. 이 차세대 강도 측정기는 무엇을 제공합니까? 기존 FX Power에서 좋아했던 모든 것 PLUS GOLD/XAU 강도 분석 더욱 정밀한 계산 결과 개별 구성 가능한 분석 기간 더 나은 성능을 위한 사용자 정의 가능한 계산 한도 특별 멀티더 많은 것을보고 싶은 사람들을위한 특별한 다중 인스턴스 설정 모든 차트에서 좋아하는 색상을위한 끝없는 그래픽 설정 수많은 알림 옵션, 중요한 것을 다시는 놓치지 않도록 Windows 11 및 macOS 스타일의 둥근 모서리가 있는 새로운 디자인 마법처럼 움직이는 인디케이터 패널 FX 파워 키 특징 모든 주요 통화의 완전한 강세 이력 모든 시간대에 걸친 통화 강세 이력 모든 브로커 및 차트에서 고유 계산 결과 100% 신뢰할 수있는 실시간100 % 신뢰할 수있는 실시간 계산-> 다시 칠하지 않음
Advanced Supply Demand MT5
Bernhard Schweigert
4.53 (15)
현재 33% 할인! 초보자나 전문 트레이더를 위한 최고의 솔루션! 이 보조지표는 우리가 다수의 독창적 기능과 새로운 공식을 통합한 독특하고 고품질이며 저렴한 거래 도구입니다. 이 업데이트를 통해 이중 시간대를 표시할 수 있습니다. 더 높은 TF를 표시할 수 있을 뿐만 아니라 차트 TF와 더 높은 TF 모두를 표시할 수 있습니다: 중첩 영역 표시. 모든 Supply Demand 트레이더들이 좋아할 것입니다. :) 중요한 정보 공개 Advanced Supply Demand의 잠재력을 극대화하려면 다음을 방문하십시오. https://www.mql5.com/ko/blogs/post/720245   진입 또는 목표의 명확한 트리거 포인트를 정확히 찾아냄으로 해서 거래가 어떻게 개선될지 상상해 보십시오. 새로운 알고리즘을 기반으로 매수자와 매도자 간의 잠재적인 불균형을 훨씬 더 쉽게 분간할 수 있습니다. 왜냐하면 가장 강한 공급영역과 가장 강한 수요 영역과 과거에 어떻게 진행 되었는지를(이
Auto Order Block with break of structure based on ICT and Smart Money Concepts Futures Break of Structure ( BoS )             Order block ( OB )            Higher time frame Order block / Point of Interest ( POI )    shown on current chart           Fair value Gap ( FVG ) / Imbalance   ,  MTF      ( Multi Time Frame )    Volume Imbalance     ,  MTF          vIMB Gap’s Equal High / Low’s     ,  MTF             EQH / EQL Liquidity               Current Day High / Low           HOD /
XQ Indicator MetaTrader 5
Marzena Maria Szmit
5 (1)
Step into the realm of Forex trading with confidence and precision using XQ, a cutting-edge Forex indicator designed to elevate your trading game to unprecedented heights. Whether you're a seasoned trader or just stepping into the world of currency exchange, XQ Forex Indicator empowers you with the insights and signals needed to make informed trading decisions. The signal conditions are a combination of three indicators, and XQ Forex Indicator only display  medium and long-term trends . The ind
ICT, SMC, SMART MONEY CONCEPTS, SMART MONEY, Smart Money Concept, Support and Resistance, Trend Analysis, Price Action, Market Structure, Order Blocks, BOS/CHoCH,   Breaker Blocks ,  Momentum Shift,   Supply&Demand Zone/Order Blocks , Strong Imbalance,   HH/LL/HL/LH,    Fair Value Gap, FVG,  Premium  &   Discount   Zones, Fibonacci Retracement, OTE, Buy Side Liquidity, Sell Side Liquidity, BSL/SSL Taken, Equal Highs & Lows, MTF Dashboard, Multiple Time Frame, BigBar, HTF OB, HTF Market Structure
가격이 역전되고 후퇴함에 따라 시장 구조가 변경됩니다. 시장 구조 반전 경고 표시기는 추세 또는 가격 움직임이 고갈에 가까워지고 반전할 준비가 되었음을 식별합니다. 일반적으로 반전이나 큰 하락이 일어나려고 할 때 발생하는 시장 구조의 변화를 알려줍니다. 지표는 가능한 고갈 지점 근처에서 새로운 고점 또는 저점이 형성될 때마다 초기에 돌파와 가격 모멘텀을 식별합니다. 표시기는 반대쪽에 있는 마지막 촛불에 직사각형을 그립니다. 그런 다음 현재의 단기 추세에서 계속 움직이기 때문에 가격과 함께 직사각형을 따라갈 것입니다. 가격이 사각형 위나 아래로 다시 닫힐 정도로 약해지면 시장 구조에 잠재적인 변화가 일어나고 있음을 나타냅니다. 그런 다음 표시기는 방향의 잠재적인 이동과 추세 또는 주요 하락의 가능한 반전 시작에 대해 경고합니다. 작동 방식을 보려면 아래의 작동 표시기를 참조하십시오! 모든 쌍 및 주요 기간을 모니터링하는 대시보드: https://www.mql5.com/
ON Trade Gann Squares MT5
Abdullah Alrai
5 (1)
간 스퀘어 지표는 W.D. 간이 쓴 "시장 예측을 위한 수학적 공식" 기사에 기반한 강력한 시장 분석 도구입니다. 이 도구는 수학적 개념과 간 이론을 사용하여 정확한 시장 분석을 수행합니다. 144, 90, 52의 제곱과 9의 제곱을 사용합니다. 또한 의 9의 제곱근 및 해당 제곱의 채널 및 스타 패턴과의 관련성을 통합합니다. 사용자 메뉴얼 및 적용: 이 지표를 사용하기 전에 사용자 메뉴얼을 읽고 질문이 있을 경우 문의하시기 바랍니다. 전체 메뉴얼은 웹사이트에서 제공됩니다. MT5의 전체 버전을 구매하거나 MT4의 무료 버전을 테스트할 수 있습니다. 두 버전 모두 링크에서 확인하실 수 있습니다. 주요 기능 및 기능: 간 스퀘어 지표는 정확한 결정을 위해 기하학적 개념과 간 이론을 활용하는 시장 분석을 위한 포괄적인 도구 집합을 제공합니다. 주요 기능은 다음과 같습니다. 9의 제곱 분석:   이 지표는 9의 제곱에 대한 수평 선, 스타 패턴, 그리드 및 간 팬을 그릴 수 있습니다. 간
AW Trend Predictor MT5
AW Trading Software Limited
4.76 (54)
하나의 시스템에서 추세와 고장 수준의 조합입니다. 고급 지표 알고리즘은 시장 노이즈를 필터링하고 추세, 진입점 및 가능한 출구 수준을 결정합니다. 표시기 신호는 통계 모듈에 기록되어 가장 적합한 도구를 선택하여 신호 기록의 효율성을 보여줍니다. 이 표시기는 이익 실현 및 손절매 표시를 계산합니다. 매뉴얼 및 지침 ->   HERE   / MT4 버전 ->   HERE 지표로 거래하는 방법: Trend Predictor로 거래하는 것은 3단계로 간단합니다. 1단계 - 포지션 열기 70% 이상의 성공률로 매수 신호를 받았습니다. 2단계 - StopLoss 결정 반대 신호로 트렁크 선택 3단계 - 이익 실현 전략 정의 전략 1: TP1 도달 시 전체 포지션 청산 전략 2: TP1 도달 시 포지션의 50% 청산 및 TP2 도달 시 나머지 50% 청산 전략 3: 추세 반전 시 전체 포지션 청산 이익: 결과를 다시 그리지 않음, 신호는 엄격하게 양초가 닫힐 때 어드바이저에서 사용할 수 있습니
Volume by Price MT5
Brian Collard
5 (3)
The Volume by Price Indicator for MetaTrader 5 features Volume Profile and Market Profile TPO (Time Price Opportunity). Get valuable insights out of currencies, equities and commodities data. Gain an edge trading financial markets. Volume and TPO histogram bar and line charts. Volume Footprint charts. TPO letter and block marker charts including split structures. Versatile segmentation and compositing methods. Static, dynamic and flexible ranges with relative and/or absolute visualizations. Lay
TrendLine PRO MT5
Evgenii Aksenov
4.78 (49)
The Trend Line PRO indicator is an independent trading strategy. It shows the trend change, the entry point to the transaction, as well as automatically calculates three levels of Take Profit and Stop Loss protection Trend Line PRO is perfect for all Meta Trader symbols: currencies, metals, cryptocurrencies, stocks and indices Advantages of Trend Line PRO Never redraws its signals The possibility of using it as an independent strategy It has three automatic levels Take Profit and Stop Loss lev
MetaBands M5
Vahidreza Heidar Gholami
4.67 (3)
MetaBands uses powerful and unique algorithms to draw channels and detect trends so that it can provide traders with potential points for entering and exiting trades. It’s a channel indicator plus a powerful trend indicator. It includes different types of channels which can be merged to create new channels simply by using the input parameters. MetaBands uses all types of alerts to notify users about market events. Features Supports most of the channel algorithms Powerful trend detection algorith
소개       Quantum Breakout PRO   , 브레이크아웃 존 거래 방식을 변화시키는 획기적인 MQL5 지표! 13년 이상의 거래 경험을 가진 숙련된 트레이더 팀이 개발한       퀀텀 브레이크아웃 PRO       혁신적이고 역동적인 브레이크아웃 존 전략으로 거래 여정을 새로운 차원으로 끌어올리도록 설계되었습니다. Quantum Breakout Indicator는 5개의 이익 목표 영역이 있는 브레이크아웃 영역의 신호 화살표와 브레이크아웃 상자를 기반으로 한 손절 제안을 제공합니다. 초보자 거래자와 전문 거래자 모두에게 적합합니다. Quantum EA 채널:       여기를 클릭하세요 중요한! 구매 후 설치 매뉴얼을 받으려면 개인 메시지를 보내주십시오. 추천: 기간: M15 통화쌍: GBPJPY, EURJPY, USDJPY,NZDUSD, XAUUSD 계정 유형: 스프레드가 매우 낮은 ECN, Raw 또는 Razor 브로커 시간: GM
Owl Smart Levels MT5
Sergey Ermolov
4.47 (36)
MT4 버전  |  FAQ Owl Smart Levels Indicator 는 Bill Williams 의 고급 프랙탈, 시장의 올바른 파동 구조를 구축하는 Valable ZigZag, 정확한 진입 수준을 표시하는 피보나치 수준과 같은 인기 있는 시장 분석 도구를 포함하는 하나의 지표 내에서 완전한 거래 시스템입니다. 시장과 이익을 취하는 장소로. 전략에 대한 자세한 설명 표시기 작업에 대한 지침 고문-거래 올빼미 도우미의 조수 개인 사용자 채팅 ->구입 후 나에게 쓰기,나는 개인 채팅에 당신을 추가하고 거기에 모든 보너스를 다운로드 할 수 있습니다 힘은 단순함에 있습니다! Owl Smart Levels 거래 시스템은 사용하기 매우 쉽기 때문에 전문가와 이제 막 시장을 연구하고 스스로 거래 전략을 선택하기 시작한 사람들 모두에게 적합합니다. 전략 및 지표에는 눈에 보이지 않는 비밀 공식 및 계산 방법이 없으며 모든 전략 지표는 공개되어 있습니다. Owl Smart Levels를
Gartley Hunter Multi
Siarhei Vashchylka
5 (5)
Gartley Hunter Multi - An indicator for searching for harmonic patterns simultaneously on dozens of trading instruments and on all classic timeframes: (m1, m5, m15, m30, H1, H4, D1, Wk, Mn). Manual (Be sure to read before purchasing) | Version for MT4 Advantages 1. Patterns: Gartley, Butterfly, Shark, Crab. Bat, Alternate Bat, Deep Crab, Cypher 2. Simultaneous search for patterns on dozens of trading instruments and on all classic timeframes 3. Search for patterns of all possible sizes. Fr
Trend Line Map Pro MT5
STE S.S.COMPANY
4.67 (9)
트렌드 라인 맵 표시기는 트렌드 스크리너 표시기의 애드온입니다. Trend screener(Trend Line Signals)에 의해 생성된 모든 신호에 대한 스캐너로 작동합니다. Trend Screener Indicator 기반의 Trend Line Scanner입니다. Trend Screener Pro 표시기가 없으면 Trend Line Map Pro가 작동하지 않습니다. It's a Trend Line Scanner based on Trend Screener Indicator. If you don't have Trend Screener Pro Indicator,     the Trend Line Map Pro will not work . MQL5 블로그에 액세스하여 추세선 지도 표시기의 무료 버전을 다운로드할 수 있습니다. Metatrader Tester 제한 없이 구매하기 전에 사용해 보십시오. : 여기를 클릭하세요 1. 쉽게 얻을 수 있는 이점 통화 및
TrendDecoder Premium MT5
Christophe, Pa Trouillas
5 (1)
이제 메타트레이더에서 사용 가능 범위 및 다음 가능한 움직임 식별       |      추세의 초기 신호와 강도를 확인하세요       |      반전 전 명확한 출구 확보       |      가격이 테스트 할 피보 레벨 파악 비추적, 비지연 지표 - 수동 및 자동 거래에 이상적 - 모든 자산 및 모든 시간 단위에 적합 - 출시 시 50% 할인   - 이후 >> $149로 복귀 구매 후   이 채널로 문의 하여 권장 설정을 확인하세요. MT4 버전:   여기를 클릭하세요 BladeSCALPER 및 PowerZONES 로 전체 방법을 확인하세요. 어떤 서비스인가요? 트렌드디코더는 추세 모니터링을 간단하고 쉽게 하기 위한 여러 혁신 기술의 집약체입니다. 투영 추세선(투영 추세선)   - 다가오는 추세의 속도 기준 실시간 추세선과 투영 추세선 비교   - 시장이 이전과 같은 방향으로 움직이고 있는지, 아니면 둔화되고 있는지? 실시간 추세선 교차   - 추세가 궤
TPSproTREND PrO MT5
Roman Podpora
5 (5)
TPSpro TRENDPRO  - is a trend indicator that automatically analyzes the market and provides information about the trend and each of its changes, as well as giving signals for entering trades without redrawing! The indicator uses each candle, analyzing them separately. referring to different impulses - up or down impulse. Exact entry points into transactions for currencies, crypto, metals, stocks, indices!  -  Version MT4                  DETAILED DESCRIPTION        /       TRADING SETUPS       
Golden Spikes Detector
Batsirayi L Marango
5 (1)
Golden Spikes Detector This indicator is based on an advanced strategy primarily for trading spikes on Boom and Crash Indices. Complex algorithms were implemented to detect high probability entries only. It alerts on potential Buy and Sell entries. To trade spikes on the Deriv or Binary broker, only take Buy Boom and Sell Cash alerts. It was optimised to be loaded on 5-minute timeframe although multiple timeframe analysis is done in the background. Features ·             Desktop pop up and sound
Matrix Arrow Indicator MT5
Juvenille Emperor Limited
5 (14)
매트릭스 화살표 표시기 MT5 는 외환, 상품, 암호 화폐, 지수, 주식과 같은 모든 기호/도구에 사용할 수 있는 100% 다시 칠하지 않는 다중 기간 표시기를 따르는 고유한 10 in 1 추세입니다.  Matrix Arrow Indicator MT5 는 다음과 같은 최대 10개의 표준 지표에서 정보와 데이터를 수집하여 초기 단계에서 현재 추세를 결정합니다. 평균 방향 이동 지수(ADX) 상품 채널 지수(CCI) 클래식 하이켄 아시 캔들 이동 평균 이동 평균 수렴 발산(MACD) 상대 활력 지수(RVI) 상대 강도 지수(RSI) 포물선 SAR 스토캐스틱 오실레이터 윌리엄스의 백분율 범위 모든 지표가 유효한 매수 또는 매도 신호를 제공하면 강력한 상승/하락 추세를 나타내는 다음 캔들/막대가 시작될 때 해당 화살표가 차트에 인쇄됩니다. 사용자는 사용할 표시기를 선택하고 각 표시기의 매개변수를 개별적으로 조정할 수 있습니다. 매트릭스 화살표 표시기 MT5는 선택한 표시기에서만 정보를 수
IX Power MT5
Daniel Stein
5 (2)
IX Power는   마침내 FX Power의 탁월한 정밀도를 외환이 아닌 기호에도 적용했습니다. 좋아하는 지수, 주식, 원자재, ETF, 심지어 암호화폐까지 단기, 중기, 장기 추세의 강도를 정확하게 파악할 수 있습니다. 단말기가 제공하는   모든 것을 분석할   수 있습니다. 사용해 보고 트레이딩   타이밍이 크게 향상되는   것을 경험해 보세요. IX Power 주요 특징 단말기에서 사용 가능한 모든 거래 심볼에 대해 100% 정확한 비재도장 계산 결과 제공 사전 구성 및 추가적으로 개별 구성 가능한 강도 분석 기간의 드롭다운 선택 가능 이메일, 메시지, 모바일 알림을 통한 다양한 알림 옵션 제공 EA 요청을 위한 액세스 가능한 버퍼 더 나은 성능을 위한 사용자 지정 가능한 계산 한도 더 많은 것을 보고 싶은 사용자를 위한 특별 다중 인스턴스 설정 모든 차트에서 좋아하는 색상을 위한 무한한 그래픽 설정 가능 Windows 11 및 macOS 스타일의 둥
Strong Support mt5
Vasiliy Strukov
5 (9)
지원 및 저항 수준은 오랫동안 시장 분석을위한 강력한 도구였습니다. 강력한 지원 지표는 현지 가격 최소값을 기반으로 한 지원 수준과 현지 가격 최대값을 기반으로 한 저항 수준을 나타냅니다. 내 다른 개발은 여기에서 볼 수 있습니다 추세 표시기와 함께 사용하는 것이 좋습니다(예:금 물건)-추세에 따라 거래하고 동시에 통합 또는 추세 반전 영역을 결정할 수있을뿐만 아니라 정지 손실을 설정하고 지원 및 저항 수준에서 이익을 얻을 수 있습니다. 설정 및 개인 보너스를 받기 위해 구입 후 즉시 저에게 연락하십시오! 들어오는 매개 변수 - 이 표시기에는 복잡한 설정이 필요하지 않으며 주요 매개 변수는 색상 스케일 조정입니다. 지원 및 저항 수준은 오랫동안 시장 분석을위한 강력한 도구였습니다. 강력한 지원 지표는 현지 가격 최소값을 기반으로 한 지원 수준과 현지 가격 최대값을 기반으로 한 저항 수준을 나타냅니다. 내 다른 개발은 여기에서 볼 수 있습니다 추세 표
제작자의 제품 더 보기
Ultimate Renko
Artur Zas
4.58 (12)
Ultimate Renko is a full implementation of a robust Renko style charting solution for MT4. It enables creating custom live charts resembling Median Renko , Mean Renko , Turbo Renko , and Better Renko candles as well as Vanilla Renko and Renko with wicks , PointO charts, and many more. This all-in-one package provides all of the signals needed by day traders, scalpers, and even long-term traders. You can apply all of the standard and custom indicators and technical studies as well as templates to
Robust median Renko style indicator for creating custom charts resembling Median Renko, Mean Renko, Turbo Renko and Better Renko candles as well as vanilla Renko with wicks plus Point-O charts. This all in one package provides all of the signals needed by day traders, scalpers, and even long-term traders. Main characteristics The indicator is an overlay on the main chart so it is possible to utilize one-click trading and order manipulation directly on the custom charts. Visual order placement
Robust trading panel for use on any symbol (including RangeBars or Renko custom symbols). The tool can be placed anywhere on the chart and offers the following array of features: One-click instant order entry. Pending order entry using horizontal lines on the chart Pending order entry using keys in Entry price (E/P) and optional Stop Loss (S/L) and/or Take Profit (T/P) A choice between fixed trading volume or risk-based volume calculation based on the available account equity, entry price, and t
A utility used to create custom Tick or Volume bar charts and provide real-time updates. This is an MT4 "offline" chart equivalent which is very simple to use. You can attach any MT5 compatible indicator or template to the tick chart and perform your technical analysis. Tick charts measure the number of transactions per bar. You can choose any number of ticks per bar but most traders choose Fibonacci numbers (1, 2, 3, 5, 8, 13, 21, 34, 55, 89, 144, 233...). The generator uses tick data to plot
Range Bars
Artur Zas
4 (4)
The robust charting solution enables creating custom live range bar charts on the MetaTrader 4 trading platform. You can apply all of the standard and custom indicators and technical studies directly to the range bar charts and you can run EAs directly on these charts as well* (for details see text below the input summary). To create a range bar chart you need to attach the Range Bar indicator to a standard time frame (1 minute is recommended) and use the indicator's settings to generate a live
Professional range bar charting on a custom symbol chart accurate pricing to the tick  accurate timeline (no future date projections) very responsive charts An Expert Advisor (EA) is used to create a RangeBar custom chart and provide real-time updates. It is an MT4 "offline" range bars chart equivalent. The simplicity of use - Attach the EA to any time-based chart that you wish to see Range Bars for, input your desired parameters and you are ready to go! You can attach any MT5 compatible indicat
Professional renko charting on a custom symbol chart accurate pricing to the tick  accurate timeline (no future date projections ) every renko variation in a single package very responsive charts optional display of live trade levels on the chart An Expert Advisor (EA) used to create custom Renko charts and provide real-time updates. This is an MT4 "offline" chart equivalent which is very simple to use. All historical renkos are constructed using real tick data from the broker's server.
A countdown timer for the  Volume bar chart generator  and  Tick chart generator  products, which are available for download from the MQL5 Market: Tick chart generator: https://www.mql5.com/en/market/product/29215 Volume bar chart generator: https://www.mql5.com/en/market/product/47197 The counter conveniently displays the number of ticks or transactions (depending on the chart) that need to pass for a new bar to start printing. The user can set the following indicator inputs. Volume type
FREE
The extreme volume indicator helps identify turning points in the market by pinpointing spots of higher than average volume. Such points usually indicate the start of a trend or a turning point in the market. The indicator averages out volume readings over an extended period of time and calculates a volume threshold level. When this level is breached, it identifies the most likely trend direction using the trend of the candle that breached the volume threshold. The direction indicator (red or gr
CMI - Profit from trending and ranging markets. The CMI indicator is a two-part system used to trigger both trend and counter-trend trades, that has been introduced by Daniel Fernandez in an article published in Currency Trading Magazine (August 2011 issue). It is a simple, yet effective indicator, which gauges whether the market has behaved in a choppy (non-directional) manner or trending (directional) manner. CMI calculates the difference between the most recent bar's close and the close n bar
The trend scalper candles are used to identify short-term trends based on the readings of the MACD, RSI and ATR indicators. All indicator calculations are visualized by candle colors which are overlapped on the chart. The indicator uses gray , green and red colors to paint individual candles, which gives you a lot of useful and easy to read information. Gray candles Gray candles indicate a range bound period and the information can be used to trade breakouts. Simply mark the high and low of th
The professional line break chart generator is used to create live line break charts (i.e. 3 line break ). The chart is plotted using MT4's offline charging facility thus making it possible to trade* directly from the chart as well as attach any of the standard or custom indicators to perform technical analysis. The line break chart can be displayed as the most widely used 3 line break chart or a custom variation such as 2 or 5 line break chart . Wicks can be displayed or hidden on the chart - t
Range Bars Charting
Artur Zas
2.5 (4)
Range Bars for MetaTrader 5 is a unique tool for conducting technical analysis directly on the charts, as the indicator is an overlay on the main chart and range bars are calculated using real tick data. The trader can place and modify orders directly on the range bar chart (even with the use of one-click trading). Apart from range candles, the indicator also includes the most commonly used technical studies which are 3 moving averages (Simple, Exponential, Smooth, Linear-weighted, Volume-weight
A professional line break chart which is displayed directly in the chart window thus making it possible to trade directly from the MetaTrader 5 charts. The line break chart can be displayed as the most widely used 3 line break chart or a custom variation such as 2 or 5 line break chart . Wicks can be displayed or hidden on the chart - they give a lot of additional information regarding the underlying price action. The indicator's settings include: Line break number - determines the number of lin
Create and trade timeframes in seconds. The bar time duration is freely adjustable from 1 second and up. The chart is accurately constructed using real ticks from the broker's server. Main characteristics The indicator is an overlay on the main chart, making it possible to utilize one-click trading and on-chart order manipulation. History calculated using real tick data. Built-in technical studies: 4 moving averages (Simple, Exponential, Smooth, Linear-weighted, Volume-weighted using tick or rea
The Trade Tracker Library is used to automatically detect and display trade levels on custom charts. It is an especially useful add-on for EAs that trade on custom charts in MT5. With the use of this library, the EA users can see trades as they are placed via the EA (Entry, SL & TP levels) in real-time. The header file and two examples of EA skeleton files are attached in the comments section (first comment). The library will automatically detect the tradable symbol for the following custom
필터:
gabrielp40
19
gabrielp40 2023.05.04 04:13 
 

olá a média de 20 que aparece é a do de 5min e nao do grafico de ticks

nakagawa TOMOHIRO
36
nakagawa TOMOHIRO 2021.07.11 12:53 
 

it's so usuful, used with keltner channel

LIBRADOLAR
28
LIBRADOLAR 2020.08.06 13:09 
 

MUY BUENO, LO MEJOR DE METATRADER 5

traderx4 Fred
309
traderx4 Fred 2020.02.18 10:15 
 

Is it possible to be able to change the colours of the candles in the next update?

eliseexige
2057
eliseexige 2019.12.16 16:05 
 

Inaccurate data on futures exchange. The charts will repaint. I've been attempting to get this resolved with the developer for months now to no avail. Promises have been made but nothing delivered. Very frustrating and very costly to my business this year. I will change this review if the problems are fixed. Edit - after multiple attempts during live markets, this is just like the rest of Artur's products. It will freeze, it will refresh the data and screw up custom indicators, and it will cost you because of it. I'd give this a 0 or negative star rating if it were possible. AVOID if you are a serious trader and need stability in fast markets, because you won't get it here. EDIT 2: Artur is working with me on all products to solve issues and I have adjusted the feedback accordingly.

Devonish
2938
Devonish 2019.09.06 12:59 
 

Very good. Well thought out and useful with the MA's and Pivot points. Good for candle analysis.

syltrade
92
syltrade 2019.06.08 12:41 
 

the best tick chart indicator good job

bubenbuben
98
bubenbuben 2019.01.20 14:48 
 

Very practical and easy to use tool to do a Tick Chart in MT5. I could not find a better one so far. Highly recommended. Maybe it has a Volume Chat later on as well.

Zentrader2015
1470
Zentrader2015 2019.01.10 06:07 
 

사용자가 평가에 대한 코멘트를 남기지 않았습니다

Carlos Ignacio Rincones Pons
371
Carlos Ignacio Rincones Pons 2018.12.13 10:36 
 

Very useful to do momentum trading, the best tick chart alternative for metatrader 5 so far.

리뷰 답변
버전 3.22 2021.07.22
Code maintenance release
버전 3.21 2021.07.07
Chart synchronization bug fix
버전 3.19 2021.05.11
Code refactoring and optimization
버전 3.18 2021.05.07
Fixed compatibility with StereoTrader when "Shift objects with chart" is set to YES.
버전 3.17 2021.05.06
Fixed MA cross alert bug when the MAs used the shift parameter
버전 3.16 2021.04.28
Added "Volume bar" mode.
Cumulative bug fixes
버전 3.13 2020.09.24
Added alerts for bearish or bullish only reversals
Fixed compatibility issues with the latest MT5 builds
버전 3.12 2020.07.07
Fixed LWMA indicator bug
Removed "H1" timeframe restriction.
버전 3.11 2020.06.16
Recompiled for better compatibility with the latest MT5 builds
버전 3.10 2020.03.26
Fixed alert handler
버전 3.9 2020.03.25
Memory usage optimization
버전 3.8 2020.03.21
Optimizations
버전 3.7 2020.03.17
Code maintenance update
버전 3.6 2020.03.11
Minor bug fixes
버전 3.5 2020.02.24
Minor bug fixes
버전 3.4 2020.02.23
Maintenance update
버전 3.3 2020.02.17
Fixed bug with broker feeds having incorrect "chart plot" value in symbol characteristics.
버전 3.2 2020.02.13
Consolidated alert setting inputs from 6 to 2 variables
Added tick data download optimizer
Minor bug fixes
버전 3.1 2020.02.12
Bug fixes
버전 3.0 2020.02.09
Completely rewritten tick data engine (fixed all known and reported bugs found in the previous version)
Added 4th MA
Added Linear regression to the available MA types
Added Keltner Channel to the available channel types
Added tick countdown
Added optional trading session timespan with optional gray out of the after-hours zone
Added more settings to the "Show pivot settings" dropdown
Added optional price labels for MAs and Channel lines
Minor bug fixes
버전 2.25 2019.09.05
Bugfix for last bar refresh problem found in previous version
버전 2.24 2019.09.03
Fixed "duplicate tick" processing problem on the extremely fast-moving charts.
Fixed problem with brokers having an incorrect symbol specification info.
Added various optimizations and improvements.
버전 2.23 2019.08.29
Fixed problem with "invisible bars" when backtesting with latest MT5 builds.
버전 2.22 2019.08.23
Critical bug fix (fixed calculation of historical bars at certain conditions).
버전 2.21 2019.05.24
Bugfix - fixes a problem with certain tick chert settings.
버전 2.20 2019.05.13
Bug fix: Fixed backtesting bug
버전 2.19 2019.04.24
Small enhancements & code cleanup
버전 2.18 2019.03.28
Added signal candle's close price to alerts;
Code cleanup.
버전 2.17 2018.12.19
Bug fix & maintenance update
버전 2.16 2018.12.12
Bug fixes
버전 2.15 2018.11.23
Maintenance release
버전 2.14 2018.06.29
Maintenance release - code optimization
버전 2.13 2018.05.15
Bug fixes.
Added: 2 MA cross alert (MA1 = fastMA, MA2 = slowMA)
Changed: Alert settings
버전 2.12 2018.03.08
Maintenance release
버전 2.11 2018.01.24
Bug fix.
버전 2.10 2017.11.21
Added: Real tick volume (with Buy/Sell breakdown) is presented where available
Added: Classic or Fibonacci pivot lines plus support (S1,S2,S3) & resistance (R1, R2, R3) levels
Added: Previous sessions High, Low and Close levels
Added: Third moving average
Added: Volume weighted moving average method (using tick volume or real volume)
Added: Optional display as bar chart (useful when using with Heiken Ashi indicator)

All known bugs in version 2.00 have been fixed.
버전 2.0 2017.09.04
Added optional sound and push notification alerts on each new bar or only reversal bars
Added two moving averages with 100% user customizable settings
Added VWAP indicator
Added channels (Donchian, Bollinger Bands, Super Trend)