Turn MT5
- 지표
- Pavel Verveyko
- 버전: 1.4
- 업데이트됨: 3 1월 2021
- 활성화: 5
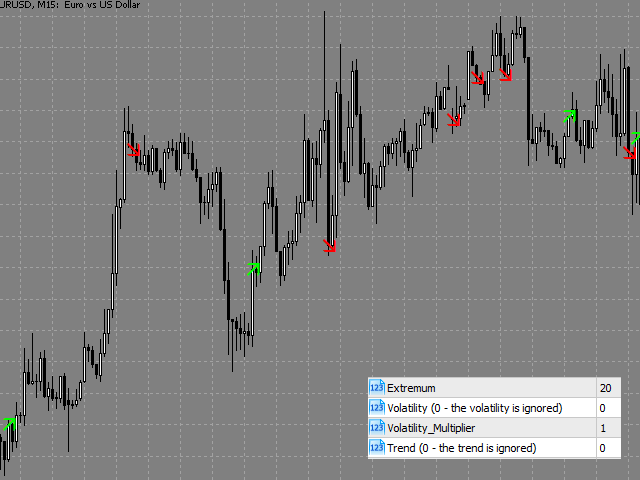
The indicator shows the market turning points (entry points).
Reversals allow you to track rebound/breakout/testing from the reverse side of the lines of graphical analysis or indicators.
Reversals can be an independent signal.
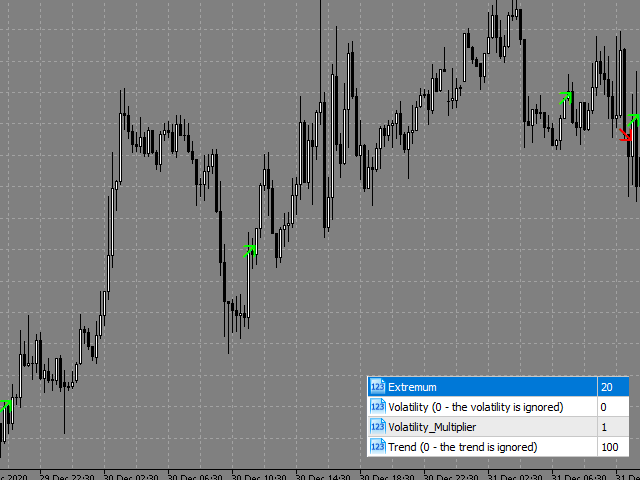
- The indicator allows you to determine reversals taking into account the trend and without it.
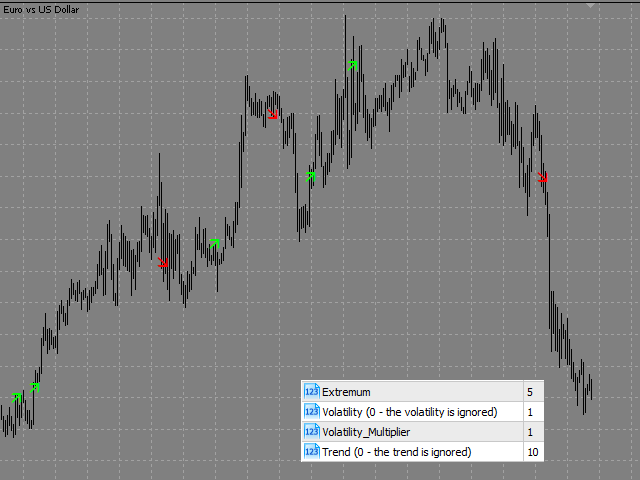
- You can choose a different period for the movement preceding the reversal, as well as the volatility coefficient.
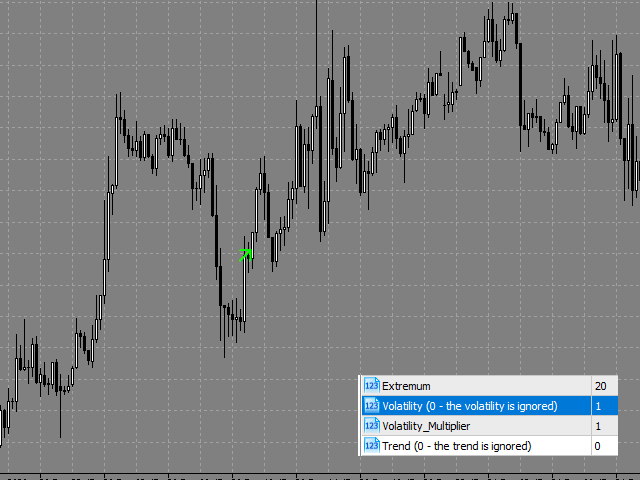
- When plotting reversals, the indicator takes into account volatility.
The indicator is not redrawn.
Settings
- History_Size - size of the calculated history.
- Extremum - the number of candles for calculating the extremum.
- Volatility - period of volatility (if Volatility = 0, then volatility is not taken into account).
- Volatility_Multiplier - the coefficient of volatility.
- Trend - trend period (if Trend = 0, the trend is not taken into account).
- Trend_Type - the method of trend.
- Trend_Price - the type of price at which the trend is built.
- Type_Arrows_Turn - label style.
- Send_Sound - sound alert.
- Send_Mail - send an email notification.
- Send_Notification - send a mobile notification.
- Send_Alert - standard terminal alert.