• 미리보기
  • 리뷰 (2)
  • 코멘트 (8)
  • 새 소식

PZ 123 Pattern MT5

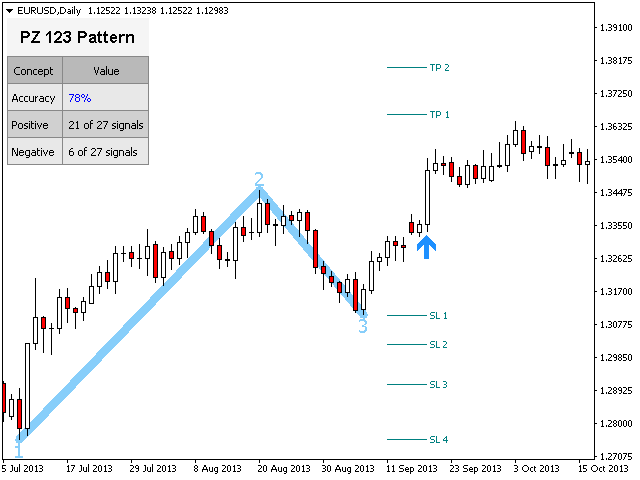
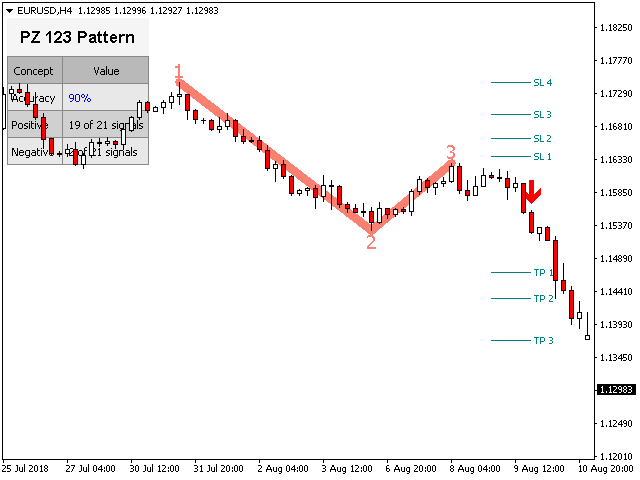
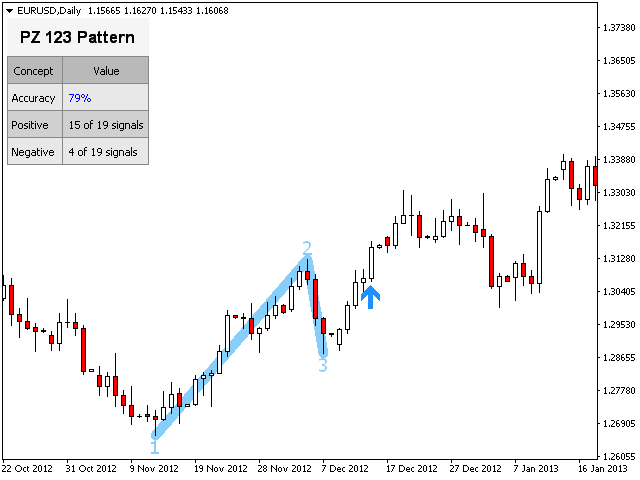
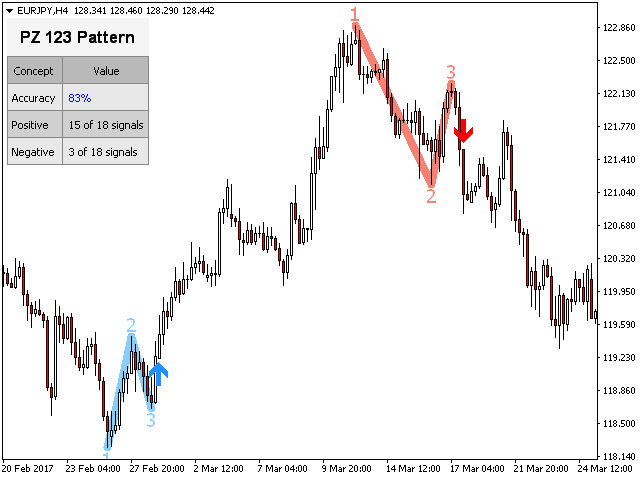
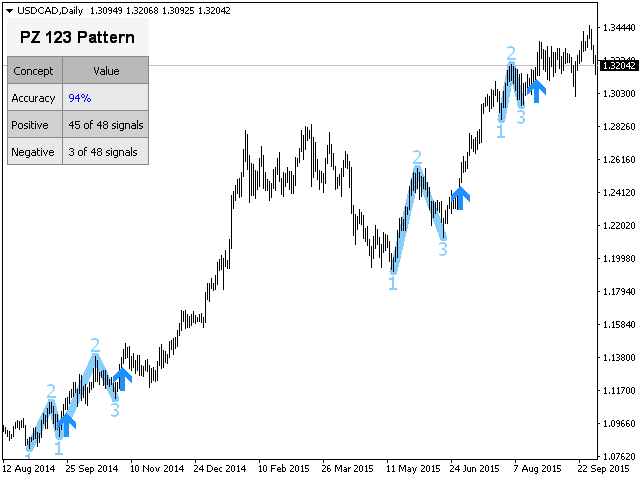
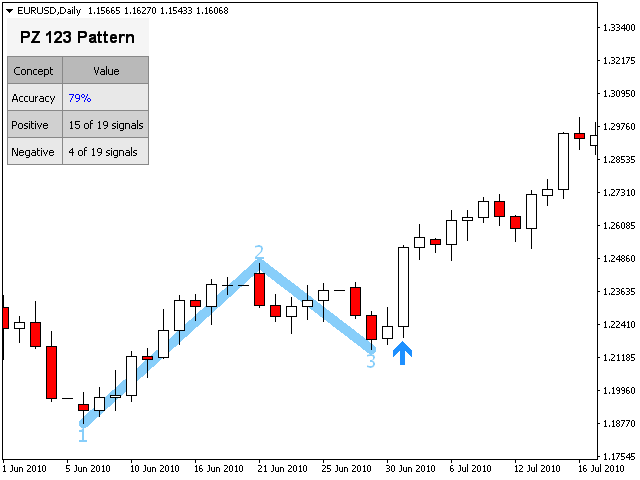
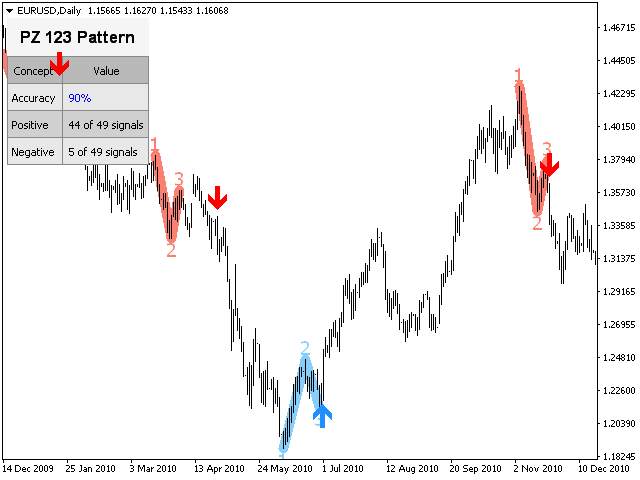
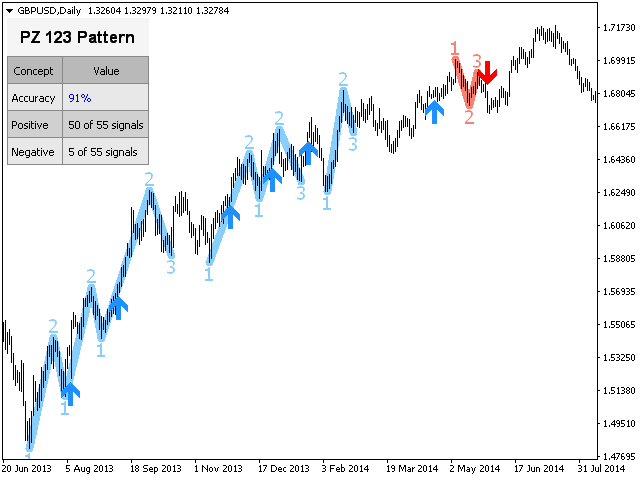
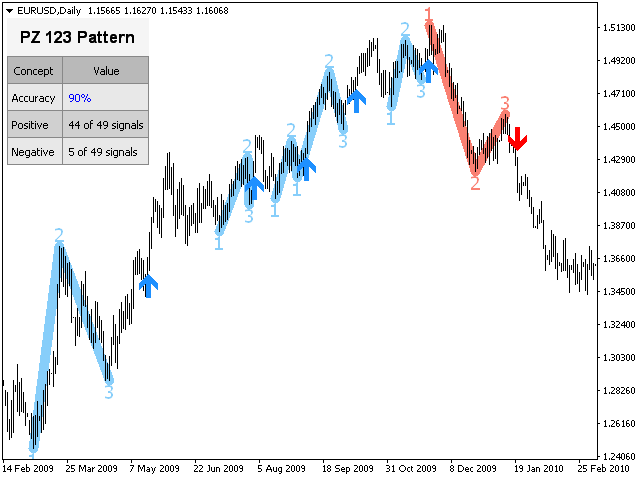
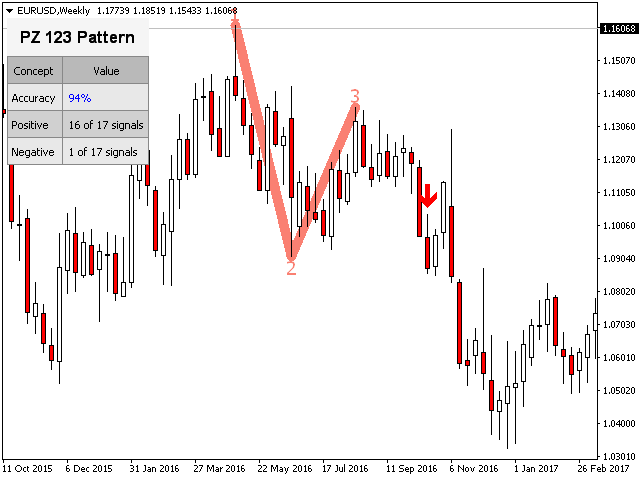
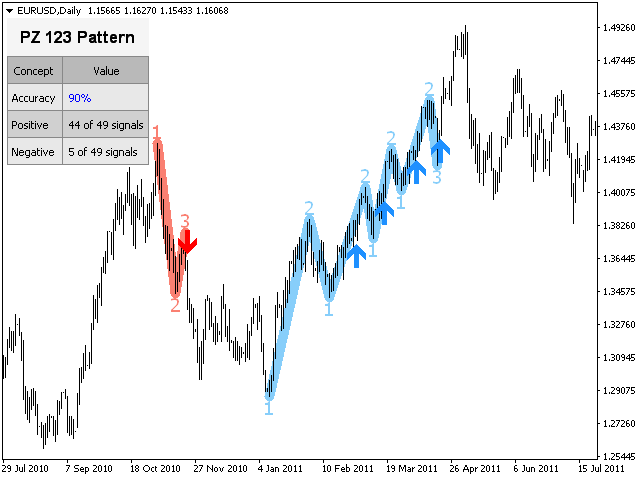
The 123 Pattern is one of the most popular, powerful and flexible chart patterns. The pattern is made up of three price points: a bottom, a peak or valley, and a Fibonacci retracement between 38.2% and 71.8%. A pattern is considered valid when the price breaks beyond the last peak or valley, moment at which the indicator plots an arrow, rises an alert, and the trade can be placed.

[ Installation Guide | Update Guide | Troubleshooting | FAQ | All Products ]

  • Clear trading signals
  • Customizable colors and sizes
  • Implements performance statistics
  • Customizable Fibonacci retracement levels
  • Displays suitable stop-loss and take-profit levels
  • The indicator can be used to find continuation or reversal patterns
  • It is non-repainting and non-backpainting
  • It implements email/sound/visual alerts

123 Patterns can present themselves as continuation or reversal patterns. To make things easier, the indicator allows you to choose which type of patterns to look for, making it a fantastic tool for trend or reversal traders.


Settings

When loading the indicator to any chart, you will be presented with a set of options as input parameters. Don't despair if you think they are too many, because parameters are grouped into self-explanatory blocks. This is what each block of parameters does.

  • Amplitude - The amplitude represents the minimum amount of bars between alternative price points. To find big patterns, increase the amplitude parameter. To find smaller patterns, decrease the amplitude parameter.
  • Min. Retracement - The minimum Fibonacci retracement needed in a pattern. Set to zero not to evaluate it.
  • Max. Retracement - The maximum Fibonacci retracement possible in a pattern. Set to zero not to evaluate it.
  • Pattern Type - The indicator can look for reversal patterns, continuation patterns or both. Your choice.
  • Max History Bars - Amount of past bars to evaluate when the indicator loads in the chart.
  • Display Stats - Show or hide the statistics dashboard and performance data.
  • Display SL/TP Levels - Show or hide suitable SL and TP levels for each signal.
  • Drawing Options - Colors and sizes for bullish or bearish lines and labels, as well as font sizes.
  • Breakouts - Colors and sizes for breakout arrows.
  • Alerts - Enable or disable alerts at will.


Author

Arturo López Pérez, private investor and speculator, software engineer and founder of Point Zero Trading Solutions.


추천 제품
The indicator detects and displays М. Gartley's Butterfly pattern. The pattern is plotted by the extreme values of the ZigZag indicator (included in the resources, no need to install). After detecting the pattern, the indicator notifies of that by the pop-up window, a mobile notification and an email. The pattern and wave parameters are displayed on the screenshots. The default parameters are used for demonstration purposes only in order to increase the amount of detected patterns. Parameters
30 USD
Introduction to X3 Chart Pattern Scanner X3 Cherart Pattern Scanner is the non-repainting and non-lagging indicator detecting X3 chart patterns including Harmonic pattern, Elliott Wave pattern, X3 patterns, and Japanese Candlestick patterns. Historical patterns match with signal patterns. Hence, you can readily develop the solid trading strategy in your chart. More importantly, this superb pattern scanner can detect the optimal pattern of its kind. In addition, you can switch on and off individu
250 USD
이 표시기는 시장 분석을 위한 가장 효과적인 도구 중 하나인 피보나치 지원 및 저항 수준을 자동으로 계산하고 표시합니다. 계산은 선택한 기간 및 기간 동안의 평균 가격 데이터를 사용합니다. 이 기간의 최소값과 최대값은 이동의 시작과 끝으로 간주됩니다. 피보나치 수준을 사용하면 가격 움직임이 느려지거나 역전될 수 있는 잠재적인 기준점을 볼 수 있습니다. 즉, 추가 움직임을 예측하고 정지 및 지정가 주문을 하는 데 사용됩니다. 매개변수: PartsShow - 현재 막대에서 표시된 과거 레벨의 수 CalcPeriod - 가격 평균화 기간 SmoothingMethod - 가격 평균화 방법(26개 옵션) TF - 계산에 사용되는 기간 LevelColor - 레벨 라인의 색상 ZeroLevelColor - 제로 레벨 색상 ShowVerticalLine - 레벨 사이의 수직선 표시 활성화/비활성화 VLineStyle - 수직선의 스타일 VLineColor - 수직선의 색상 ShowInfo - 레
30 USD
All Harmonics 26
Alexey Isavnin
3.8 (5)
Harmonic patterns are characteristic series of price movements with respect to Fibonacci levels, which statistically precede price reversals. This indicator searches for harmonic patterns. It is capable of recognising 26 classical and non-classical harmonic patterns : Classical Gartley Butterfly Alternate Butterfly Bat Alternate Bat Crab Deep Crab Three Drives Non-classical Shark Alternate Shark Cypher 5-0 Anti Gartley Anti Butterfly Anti Alternate Butterfly Anti Bat Anti Alternate Bat Anti Crab
90 USD
Noize Absorption Index
Ekaterina Saltykova
Noize Absorption Index - is the manual trading system that measures the difference of pressure between bears forces and bulls forces. Green line - is a noize free index that showing curent situation. Zero value of index shows totally choppy/flat market.Values above zero level shows how powerfull bullish wave is and values below zero measures bearish forces.Up arrow appears on bearish market when it's ready to reverse, dn arrow appears on weak bullish market, as a result of reverse expectation.
199 USD
Double HMA MTF for MT5
Pavel Zamoshnikov
5 (2)
This is an advanced multi-timeframe version of the popular Hull Moving Average (HMA) Features Two lines of the Hull indicator of different timeframes on the same chart. The HMA line of the higher timeframe defines the trend, and the HMA line of the current timeframe defines the short-term price movements. A graphical panel with HMA indicator data from all timeframes at the same time . If the HMA switched its direction on any timeframe, the panel displays a question or exclamation mark with a tex
30 USD
Premium level Pro
Dmitriy Kashevich
Premium level is a unique indicator with more than 80% accuracy of correct predictions! This indicator has been tested for more than two months by the best Trading Specialists! The author's indicator you will not find anywhere else! From the screenshots you can see for yourself the accuracy of this tool! 1 is great for trading binary options with an expiration time of 1 candle. 2 works on all currency pairs, stocks, commodities, cryptocurrencies Instructions: As soon as the red ar
1 100 USD
You can download the Full version with more features here . Introduction Harmonic Patterns are best used to predict turning point. Harmonic Patterns give you high win rate and high opportunities for trade in during one day. This indicator detects the best and successful patterns base on Harmonic Trading books by Mr. Scott M.. Main Features Detect the best and   most successful patterns : Gartley, Bat, Crab, Butterfly, Cypher, Shark, Alt_Bat, Deep_Crab Easy-to-use and user friendly indicator Sca
FREE
Ultimate Candle Patterns
Wojciech Daniel Knoff
This is a multi-symbol and multi-timeframe table-based indicator designed for a candlestick patterns detection with 46 patterns for META TRADER 5. Each formation has own image for easier recognition. Here you find most popular formations such as "Engulfing", "Hammer", "Three Line Strike", "Piercing" or Doji - like candles. Check my full list of patterns on my screenshots below. Also you can not only switch all bearish or bullish patterns from input, but also select formation for a specified symb
30 USD
Candle hunter
Ruslan Khasanov
5 (1)
그래픽 분석을 위한 지표입니다. 차트에 주요 일본 촛대 패턴을 표시합니다. 현재 거래자는 다음 패턴 세트를 사용할 수 있습니다.  - Bearish/Bullish Abandoned Baby;  - Bearish Advance Block;  - Bearish Deliberation;  - Bearish/Bullish Belt Hold;  - Bearish/Bullish Engulfing;  - Bearish Shooting Star;  - Bearish Evening Star;  - Bearish Evening Doji Star;  - Bearish/Bullish Doji Star;    - Bearish/Bullish Tri-Star;  - Bearish Hanging Man;  - Bearish/Bullish Harami;  - Bearish/Bullish Harami Cross;  - Bearish Two Crows;  - Bearish Identical Three Crows;
50 USD
Price Breakout pattern Scanner is the automatic scanner for traders and investors. It can detect following patterns automatically from your chart. Head and Shoulder - Common tradable pattern. Reverse Head and Shoulder - This pattern is the reverse formation of the Head and Shoulder. Double Top - When the price hits resistance level twice and decline toward the support level, the trader can anticipate sudden bearish breakout through the support level. Double Bottom - The double bottom pattern is
100 USD
Cumulative Delta NG
Anton Polkovnikov
Cumulative delta indicator As most traders believe, the price moves under the pressure of market buying or selling. When someone redeems an offer standing in the cup, the deal is a "buy". If someone pours into the bid standing in the cup - the deal goes with the direction of "sale". The delta is the difference between purchases and sales. A cumulative delta - the difference between the cumulative sum of purchases and sales for a certain period of time. It allows you to see who is currently contr
50 USD
Gartley Projections D
Oleksandr Medviediev
3 (2)
The indicator identifies the harmonic patterns (XABCD) according to developments of H.M.Gartley ( "Profits in the Stock Market" , 1935г). It projects D-point as a point in the perspective projection (specify ProjectionD_Mode = true in the settings). Does not redraw. When a bar of the working timeframe closes, if the identified pattern point has not moved during Patterns_Fractal_Bars bars, an arrow appears on the chart (in the direction of the expected price movement). From this moment on, the ar
200 USD
Renko Plus
Eadvisors Software Inc.
With Renko Plus you can use the features in the Indicator functionality, just add it to the Metatrader5 chart.             The Renko chart is a type of chart, developed by the Japanese, that is constructed using price movement rather than standardized prices and time intervals like most charts. It is believed to be named after the Japanese word for bricks, "renga", as the graphic looks like a series of bricks.             A new brick is created when the price moves a specified p
70 USD
Matreshka
Dimitr Trifonov
Matreshka self-testing and self-optimizing indicator: 1. Is an interpretation of the Elliott Wave Analysis Theory. 2. Based on the principle of the indicator type ZigZag, and the waves are based on the principle of interpretation of the theory of DeMark. 3. Filters waves in length and height. 4. Draws up to six levels of ZigZag at the same time, tracking waves of different orders. 5. Marks Pulsed and Recoil Waves. 6. Draws arrows to open positions 7. Draws three channels. 8. Notes support and re
245 USD
Tunafish EA
Ismaele Daniele Lodetti
Tunafish EA is the most efficient EA on my profile. I spent a lot of time and effort to make this software sophisticated with possibilities of high potential returns while keeping the drawdown below 25%. The algorithms of the robot provide investors of any level of training with an investment opportunity that is both safe and aggressive. Tunafish EA imitating the work of the brain, capable of learning and adapting to changing conditions and predicting situations. When applied to trading in fina
69 USD
PipFinite Exit EDGE MT5
Karlo Wilson Vendiola
4.88 (34)
Did You Have A Profitable Trade But Suddenly Reversed? In a solid strategy, exiting a trade is equally important as entering. Exit EDGE helps maximize your current trade profit and avoid turning winning trades to losers. Never Miss An Exit Signal Again Monitor all pairs and timeframes in just 1 chart www.mql5.com/en/blogs/post/726558 How To Trade You can close your open trades as soon as you receive a signal Close your Buy orders if you receive an Exit Buy Signal. Close your Sell orde
88 USD
An indicator of pattern #31 ("Long Island") from Encyclopedia of Chart Patterns by Thomas N. Bulkowski. The second gap is in the opposite direction. Parameters: Alerts - show alert when an arrow appears   Push - send a push notification when an arrow appears (requires configuration in the terminal) GapSize - minimum gap size in points ArrowType - a symbol from 1 to 17 ArrowVShift - vertical shift of arrows in points   ShowLevels - show levels ColUp - color of an upward line ColDn - color of a
30 USD
AW Candle Patterns
Alexander Nechaev
AW 양초 패턴 표시기는 강력한 양초 패턴 스캐너와 결합된 고급 추세 표시기의 조합입니다. 가장 신뢰할 수 있는 30개의 촛대 패턴을 인식하고 강조 표시하는 데 유용한 도구입니다. 또한 색상 막대를 기반으로 하는 현재 추세 분석기입니다.       크기를 조정하고 위치를 지정할 수 있는 플러그인 다중 시간 프레임 추세 패널. 트렌드 필터링에 따라 패턴 표시를 조정하는 고유한 기능. 장점: 캔들 패턴을 쉽게 식별 결과를 다시 그리지 않습니다 내장된 다중 시간 추세 패널 비활성화된 패턴 유형(1, 2, 3 촛불) 패턴 표시 시 트렌드 필터링 조정 MT4 version  표시된 패턴 목록: 망치 패턴 핀 업 / 핀 다운 약세 하라미 / 강세 하라미 Bearish Harami Cross / Bullish Harami Cross 피벗 포인트 반전 업 / 피벗 포인트 반전 다운 더 높은 종가와 함께 낮은 더블 바 / 더 낮은 종가와 함께 낮은 더블 바 종가 반전 업 / 종가 반전 다운 중립 막
145 USD
표시기는 현재 시세를 작성하여 과거 시세와 비교할 수 있으며 이를 바탕으로 가격 변동을 예측합니다. 표시기에는 원하는 날짜로 빠르게 이동할 수 있는 텍스트 필드가 있습니다. 옵션: 기호 - 표시기가 표시할 기호 선택. SymbolPeriod - 지표가 데이터를 가져올 기간 선택. IndicatorColor - 표시기 색상. HorisontalShift - 지시자가 그린 따옴표를 지정된 막대 수만큼 이동합니다. Inverse - true는 인용 부호를 반대로, false - 원래 보기를 반전합니다. ChartVerticalShiftStep - 차트를 수직으로 이동합니다(키보드의 위/아래 화살표). 다음은 날짜를 입력할 수 있는 텍스트 필드의 설정으로, '엔터'를 누르면 즉시 이동할 수 있습니다.
55 USD
표시기는 가능한 최소 지연으로   다시 칠하지 않고   차트의 고조파 패턴을 보여줍니다. 지표 상단 검색은 가격 분석의 파동 원리를 기반으로 합니다. 고급 설정을 통해 거래 스타일에 대한 매개변수를 선택할 수 있습니다. 양초(막대)가 열릴 때 새로운 패턴이 형성되면 가격 변동의 가능성이 있는 방향의 화살표가 고정되어 변경되지 않습니다. 표시기는 ABCD, Gartley(Butterfly, Crab, Bat), 3Drives, 5-0, Batman, SHS, One2One, Camel, Triangles, WXY, Fibo, Vibrations와 같은 패턴과 그 종류를 인식합니다. 기본적으로 ABCD 및 Gartley 수치만 설정에 표시됩니다. 많은 추가 구성 가능한 매개변수. 주요 매개변수: ShowUpDnArrows - 가능한 방향 화살표 표시/숨기기 ArrowUpCode - 위쪽 화살표 코드 ArrowDnCode - 아래쪽 화살표 코드 Show old history pattern
50 USD
Renko Gold
Ignacio Agustin Mene Franco
Renko Gold! clearly indicates the floors and ceilings where it goes from 4 lines, the line below that marks the floor in green confirming with the thinnest line clarifies the purchase entry, the same is for sale, the top line marks the ceiling and the thinnest red line marks the sale, This indicator works for all temporalities! For Forex and Synthetic Indices markets! It also works for crypto markets! Good profit! World Investor.
40 USD
KT Renko Patterns MT5
KEENBASE SOFTWARE SOLUTIONS
KT Renko Patterns scans the Renko chart brick by brick to find some famous chart patterns that are frequently used by traders across the various financial markets. Compared to the time-based charts, patterns based trading is easier and more evident on Renko charts due to their uncluttered appearance. KT Renko Patterns features multiple Renko patterns, and many of these patterns are extensively explained in the book titled Profitable Trading with Renko Charts by Prashant Shah. A 100% automate
145 USD
The   Supply and Demand Zones indicator   is one of the best tools we have ever made. This great tool automatically draws supply and demand zones, the best places for opening and closing positions. It has many advanced features such as multi timeframe zones support, displaying the width of zones, alert notifications for retouched zones, and much more. Because of market fractality, this indicator can be used for any kind of trading. Whether you are a positional, swing, or intraday trader does no
99 USD
Good Time
Sergey Sapozhnikov
5 (1)
Indicator for Highlighting Any Time Periods such as Trade Sessions or Week Days We do we need it? Looking through the operation results of my favorite Expert Advisor in the strategy tester I noticed that most deals it opened during the Asian session were unprofitable. It would be a great idea to see it on a graph, I thought. And that was the time I bumped into the first problem - viewing only the Asian session on a chart. And hiding all the others. It is not a problem to find the work schedule o
30 USD
Accelerator Oscillator by Bill Williams   with the ability to fine-tune and replace the averaging algorithms of the indicator, which significantly expands the possibilities of using this oscillator in algorithmic trading and brings it closer in its properties to such an indicator as MACD. To reduce price noise, the final indicator is processed with an additional Smooth averaging.  The indicator has the ability to give alerts, send mail messages and push signals when the direction of movement
40 USD
Time And Sales Delta
Evgeny Shevtsov
5 (1)
The indicator displays the delta and the cumulative delta based on the "Time & Sales" deals list data. In addition to the standard timeframes, the indicator displays data regarding the seconds timeframes (S5, S10, S15, S20, S30) to choose from. Using the rectangle, user can select an arbitrary area in the indicator subwindow to view the ratio of the volumes of deals of buyers and sellers within this area. Indicator features: The indicator works correctly only on those trading symbols for whi
30 USD
FanTracer
Syed Oarasul Islam
This Indicator draws Fibonacci Fan levels in two different ways. You can select whether to draw Fibonacci Fan levels based on your favourite ZigZag settings or you can let the indicator to draw Fan levels based on given number of bars or candles.  You can also set Mobile and Email notification for your favourite Fan  levels individually. With this indicator you will not have to feel lonely as the it can generate Voice alerts, which will keep you focused on your trading and remove boredom.  Prod
60 USD
Trend Monitor MT5
Pavel Zamoshnikov
4 (4)
The indicator generates early signals basing on ADX reading data combined with elements of price patterns. Works on all symbols and timeframes. The indicator does not redraw its signals. You see the same things on history and in real time. For better visual perception signals are displayed as arrows (in order not to overload the chart). Features The best results are obtained when the indicator works on two timeframes. For example: M30 – the indicator shows the main trend; M5 – the indicator ge
30 USD
DALA Forecast
Grigorii Matsnev
About the indicator: DALA Forecast is a universal tool for predicting the dynamics of time series of any nature. For prediction, modified methods of nonlinear dynamics analysis are used, on the basis of which a predictive model is built using machine learning methods.  To get the trial version of the indicator, you can contact me in private messages. How to use the indicator: Apply the indicator to your chosen financial instrument or indicator with the settings you need. The prediction will b
30 USD
이 제품의 구매자들이 또한 구매함
Entry Points Pro for MT5
Yury Orlov
4.59 (126)
다시 색을 칠하지 않고 거래에 진입할 수 있는 정확한 신호를 제공하는 MT5용 지표입니다. 외환, 암호화폐, 금속, 주식, 지수 등 모든 금융 자산에 적용할 수 있습니다. 매우 정확한 추정값을 제공하고 매수와 매도의 가장 좋은 시점을 알려줍니다. 하나의 시그널로 수익을 내는 지표의 예와 함께 비디오 (6:22)시청하십시오! 대부분의 거래자는 Entry Points Pro 지표의 도움으로 첫 거래 주 동안 트레이딩 결과를 개선합니다. 저희의   Telegram Group 을 구독하세요! Entry Points Pro 지표의 좋은점. 재도색이 없는 진입 신호 신호가 나타나고 확인되면(시그널 캔들이 완성된 경우) 신호는 더 이상 사라지지 않습니다. 여타 보조지표의 경우 신호를 표시한 다음 제거되기 때문에 큰 재정적 손실로 이어집니다. 오류 없는 거래 게시 알고리즘을 통해 트레이드(진입 또는 청산)를 할 이상적인 순간을 찾을 수 있으며, 이를 통해 이를 사용하는 모든 거래자의
125 USD
Owl Smart Levels MT5
Sergey Ermolov
5 (7)
표시기 매뉴얼  |   Owl Smart Levels 전략  |    MT4 버전  |  설치하는 방법?   |   FAQ Owl Smart Levels Indicator 는 Bill Williams 의 고급 프랙탈, 시장의 올바른 파동 구조를 구축하는 Valable ZigZag, 정확한 진입 수준을 표시하는 피보나치 수준과 같은 인기 있는 시장 분석 도구를 포함하는 하나의 지표 내에서 완전한 거래 시스템입니다. 시장과 이익을 취하는 장소로. 거래 시스템에 대한 자세한 설명은 Owl Trend Strategy - Smart Levels 기사를 참조하십시오.  힘은 단순함에 있습니다! Owl Smart Levels 거래 시스템은 사용하기 매우 쉽기 때문에 전문가와 이제 막 시장을 연구하고 스스로 거래 전략을 선택하기 시작한 사람들 모두에게 적합합니다. 전략 및 지표에는 눈에 보이지 않는 비밀 공식 및 계산 방법이 없으며 모든 전략 지표는 공개되어 있습니다. Owl Smart Lev
97 USD
XQ Indicator MT5
Marzena Maria Szmit
5 (1)
The signal conditions are a combination of three indicators, and XQ Forex Indicators only display  medium and long-term trends . The indicator's efficacy has been improved with the addition of a filter that blocks out false signals. The XQ Forex Indicator can be used on  FX pairs, CFDs, and Cryptocurrencies . There are two type of signals:  Buy or Sell and Big Long or Big Short It is possible to enable sending emails when a major trend-change signal is detected, as well as to display the alerts
189 USD
MetaBands M5
Vahidreza Heidar Gholami
5 (2)
MetaBands uses powerful and unique algorithms to draw channels and detect trends so that it can provide traders with potential points for entering and exiting trades. It’s a channel indicator plus a powerful trend indicator. It includes different types of channels which can be merged to create new channels simply by using the input parameters. MetaBands uses all types of alerts to notify users about market events. Features Supports most of the channel algorithms Powerful trend detection algorith
129 USD
Advanced Supply Demand MT5
Bernhard Schweigert
4.36 (11)
현재 33% 할인! 초보자나 전문 트레이더를 위한 최고의 솔루션! 이 보조지표는 우리가 다수의 독창적 기능과 새로운 공식을 통합한 독특하고 고품질이며 저렴한 거래 도구입니다. 이 업데이트를 통해 이중 시간대를 표시할 수 있습니다. 더 높은 TF를 표시할 수 있을 뿐만 아니라 차트 TF와 더 높은 TF 모두를 표시할 수 있습니다: 중첩 영역 표시. 모든 Supply Demand 트레이더들이 좋아할 것입니다. :) 중요한 정보 공개 Advanced Supply Demand의 잠재력을 극대화하려면 다음을 방문하십시오. https://www.mql5.com/ko/blogs/post/720245   진입 또는 목표의 명확한 트리거 포인트를 정확히 찾아냄으로 해서 거래가 어떻게 개선될지 상상해 보십시오. 새로운 알고리즘을 기반으로 매수자와 매도자 간의 잠재적인 불균형을 훨씬 더 쉽게 분간할 수 있습니다. 왜냐하면 가장 강한 공급영역과 가장 강한 수요 영역과 과거에 어떻게 진행 되었는지를(이
199 USD
Blahtech Market Profile MT5
Blahtech Limited
5 (7)
Market Profile defines a number of day types that can help the trader to determine market behaviour. A key feature is the Value Area, representing the range of price action where 70% of trading took place. Understanding the Value Area can give traders valuable insight into market direction and establish the higher odds trade. It is an excellent addition to any system you may be using. Blahtech Limited presents their Market Profile indicator for the MetaTrader community. Inspired by Jim Dalton’s
99 USD
Royal Scalping Indicator M5
Vahidreza Heidar Gholami
5 (8)
Royal Scalping Indicator is an advanced price adaptive indicator designed to generate high-quality trading signals. Built-in multi-timeframe and multi-currency capabilities make it even more powerful to have configurations based on different symbols and timeframes. This indicator is perfect for scalp trades as well as swing trades. Royal Scalping is not just an indicator, but a trading strategy itself. Features Price Adaptive Trend Detector Algorithm Multi-Timeframe and Multi-Currency Trend Low
149 USD
TPA True Price Action indicator reveals the true price action of the market makers through 100% non-repainting signals strictly at the close of a candle! TPA shows entries and re-entries, every time the bulls are definitely stronger than the bears and vice versa. Not to confuse with red/green candles. The shift of power gets confirmed at the earliest stage and is ONE exit strategy of several. There are available now two free parts of the TPA User Guide for our customers. The first "The Basics"
168 USD
MACD Intraday Trend PRO는 1960년대 Gerald Appel이 만든 원본 MACD를 개조하여 개발한 지표입니다. 수년간의 거래를 통해 MACD의 매개변수를 피보나치 비율로 변경함으로써 추세 움직임의 연속성을 더 잘 표현함으로써 가격 추세의 시작과 끝을 보다 효율적으로 감지할 수 있다는 것이 관찰되었습니다. 가격 추세를 감지하는 효율성으로 인해 상단과 하단의 차이를 매우 명확하게 식별하여 거래 기회를 더 잘 활용할 수도 있습니다. 특징 표시기 MACD Intraday Trend PRO는 모든 통화 쌍, 모든 시간대 및 Renko 차트에서 작동합니다. 5가지 모드를 선택하여 추세 감지 속도를 설정할 수 있습니다. 가장 빠른 빠른 정상 느린 가장 느림 자원 6개의 구성 가능한 경고가 있습니다. MACD는 신호 라인에서 후퇴 MACD가 신호선을 넘다 MACD는 레벨 0을 교차 신호선이 레벨 0을 넘습니다. MACD 변경 트렌드 색상 신호선 변경 TRE
77 USD
Blahtech Supply Demand MT5
Blahtech Limited
4.45 (11)
Supply Demand uses previous price action to identify potential imbalances between buyers and sellers. The key is to identify the better odds zones, not just the untouched ones. Blahtech Supply Demand indicator delivers functionality previously unavailable on any trading platform. This 4-in-1 indicator not only highlights the higher probability zones using a multi-criteria strength engine, but also combines it with multi-timeframe trend analysis, previously confirmed swings and engulfing detecto
99.10 USD
PZ Swing Trading MT5
PZ TRADING SLU
5 (4)
Swing Trading is the first indicator designed to detect swings in the direction of the trend and possible reversal swings. It uses the baseline swing trading approach, widely described in trading literature. The indicator studies several price and time vectors to track the aggregate trend direction and detects situations in which the market is oversold or overbought and ready to correct. [ Installation Guide | Update Guide | Troubleshooting | FAQ | All Products ] Profit for market swings with
175 USD
Setups 9 Larry Williams
Luigi Nunes Labigalini
Buy and sell signals based on Larry Williams's exponential moving average strategies 9.1, 9.2, 9.3 and 9.4 for trend reversals and continuations. To understand the logic and how to trade the signals, please check: Setup 9.1:  https://www.mql5.com/pt/market/product/50986 Setup 9.2:  https://www.mql5.com/pt/market/product/52268 Setup 9.3:  https://www.mql5.com/pt/market/product/52269 Setup 9.4:  https://www.mql5.com/pt/market/product/52273 Notices:  - This indicator displays a lot of signals.
199 USD
Stargogs Spike Catcher
Lorenzo Edward Beukes
5 (6)
Stargogs Spike Catcher V3.11 This Indicator is Developed To milk the BOOM and CRASH indices . Send me Message if you need any help with the indicator.  CHECK OUT THE STARGOGS SPIKE CATCHER EA/ROBOT V3: CLICK HERE ALSO CHECK OUT SECOND TO NONEFX SPIKE CATCHER:   CLICK HERE STARGOGS SPIKE CATCHER V3.11 WHATS NEW! Brand New Strategy. This is the Indicator you need for 2023. The Indicator Gives you an Entry at a time when conditions are met and you should use TP & SL. New Trendline that changes col
100 USD
Introduction to Fractal Pattern Scanner Fractal Indicator refers to the technical indicator that makes use of the fractal geometry found in the financial market. Fractal Pattern Scanner is the advanced Fractal Indicator that brings the latest trading technology after the extensive research and development work in the fractal geometry in the financial market. The most important feature in Fractal Pattern Scanner is the ability to measure the turning point probability as well as the trend probabil
185 USD
Introduction to EFW Analytics EFW Analytics was designed to accomplish the statement "We trade because there are regularities in the financial market". EFW Analytics is a set of tools designed to maximize your trading performance by capturing the repeating fractal geometry, known as the fifth regularity in the financial market. The functionality of EFW Analytics consists of three parts. Firstly, Equilibrium Fractal Wave Index is an exploratory tool to support your trading logic to choose which r
200 USD
PZ Trend Trading MT5
PZ TRADING SLU
3.67 (3)
Trend Trading is an indicator designed to profit as much as possible from trends taking place in the market, by timing pullbacks and breakouts. It finds trading opportunities by analyzing what the price is doing during established trends. [ Installation Guide | Update Guide | Troubleshooting | FAQ | All Products ] Trade financial markets with confidence and efficiency Profit from established trends without getting whipsawed Recognize profitable pullbacks, breakouts and early reversals The ind
175 USD
The Volume Spread Analysis indicator is based on the original Volume Spread Analysis method. It was designed for quick and easy recognition of VSA patterns. Even though this indicator looks very simple, it is the most sophisticated tool we've ever made. It is a really powerful analytical tool that generates very reliable trading signals. Because it is very user-friendly and understandable, it is suitable for every type of trader, regardless of his experience. What is VSA? VSA - Volume Spread
199 USD
Trade system "PAX Multi TMA/HMA 8" for MT5 It is a ready-made trading system for trading on any instrument and any timeframe. An experienced trader on one instrument can get a profit   from 100% to 400% per week . Completely ready for manual trading and use in robots. Not redrawn signals ( See the picture ) It is convenient to work on any timeframe. Tested on metals, currency pairs, oil, international stocks, Russian stocks, cryptocurrencies, monetary and cryptocurrency indices.
144 USD
Royal Wave Pro M5
Vahidreza Heidar Gholami
5 (2)
Royal Wave is a Trend-Power oscillator which has been programmed to locate and signal low-risk entry and exit zones. Its core algorithm statistically analyzes the market and generates trading signals for overbought, oversold and low volatile areas. By using a well-designed alerting system, this indicator makes it easier to make proper decisions regarding where to enter and where to exit trades. Features Trend-Power Algorithm Low risk Entry Zones and Exit Zones Predictions for Overbought and Over
129 USD
PZ Support Resistance MT5
PZ TRADING SLU
4 (5)
Tired of plotting support and resistance lines? This is a multi-timeframe indicator that detects and plots supports and resistance lines in the chart with the same precision as a human eye would. As price levels are tested over time and its importance increases, the lines become thicker and darker, making price leves easy to glance and evaluate. [ Installation Guide | Update Guide | Troubleshooting | FAQ | All Products ] Boost your technical analysis Customizable timeframe selection Read pri
125 USD
Price Action Finder MT5
Siarhei Vashchylka
5 (9)
The Price Action finder indicator displays Price action patterns on the price chart. Pattern List: Pin Bar (Pin) Outside bar (OB) Inside bar (IB) PPR Force bar The hanged man (HM) Inverted hammer (HR) Filter For novice traders, in the new version of the indicator, we have added a trend filter taken from Elder's Three Screens system. Now it can be enabled in the external parameters of the indicator. The trend filter is configured for each price range separately. External parameters: FB  -  Dis
99 USD
- 50% OFF - Telegram group : https://t.me/+5RIceImV_OJmNDA0 MT4 version : https://www.mql5.com/en/market/product/84526?source=Unknown%3Ahttps%3A%2F%2Fwww.mql5.com%2Fen%2Fmarket%2Fmy Master Pullback is a complete system that gives unique trading opportunities and a clear indication of the market: trend, signals as well as stop loss and take profit levels. This system has been designed to be as simple as possible and detects extreme overbought and oversold zones, support and resistance levels,
99.99 USD
KT Candlestick Patterns MT5
KEENBASE SOFTWARE SOLUTIONS
KT Candlestick Patterns finds and marks the 24 most dependable Japanese candlestick patterns in real-time. Japanese traders have been using the candlestick patterns to predict the price direction since the 18th century. It's true that not every candlestick pattern can be equally trusted to predict the price direction reliably. However, when combined with other technical analysis methods like Support and Resistance, they provide an exact and unfolding market situation. KT Candlestick Patterns
120 USD
Point of Interest MT5
Scott Edward Merritt
What is a Point of Interest? Traders who follow Smart Money Concepts may call this a Liquidity Point, or areas pools of liquidity have been built up by retail traders for for Big Banks to target to create large price movements in the market. As we all know, retail traders that use outdated and unreliable methods of trading like using trendlines, support and resistance, RSI, MACD, and many others to place trades and put their stop losses at keys points in the market. The "Big Banks" know these me
99.99 USD
ToolBox 360 is the swiss knife of all indicators. It is full packed with useful tools to help you with your trading. It can be used to find best entry and exit points and help you to decide if you should open a trade or not. It shows market trends, candlestick formations outside / inside bars and you can sett time based allerts. Main features: Time based Fibonacci lines Choose a start and end time and the indicator shows you Fibonacci lines within the selected time range including range high
399 USD
Mega Spikes Max
Niccyril Chirindo
The best Tool to Catch Boom and Crash Spikes like a Pro!!! You want to become a constantly Boom and Crash Trader This is an advanced indicator used to catch Boom and Crash Indices spikes beforehand. It alerts on high probability entries with an amazing success rate. We recommend using a Virtual Private Server for receiving 24/7 notifications via email or phone How to trade with Mega Spikes Max 1.7 ? When arrow is displayed on the chart wait for audible alert or push notification to be sen
130 USD
PipFinite Strength Meter MT5
Karlo Wilson Vendiola
5 (1)
How To Determine If The Market is Strong Or Weak? Strength Meter uses an Adaptive Algorithm That Detect Price Action Strength In 4 Important Levels! This powerful filter gives you the ability to determine setups with the best probability. Features Universal compatibility to different trading systems Advance analysis categorized in 4 levels Level 1 (Weak) - Indicates us to WAIT. This will help avoid false moves Weak Bullish - Early signs bullish pressure Weak Bearish - Early signs bearish pre
88 USD
(FOR MT5)  Divergence Scanner Multi Pair And Multi Time Frame :   This indicator has been designed to automatically identify when a divergence occurs between price and an oscillator. It can identify both bull and bear divergence and it is already loaded with four of the most popular oscillators. You can choose from RSI, MACD, Stochastics and CCI. IMPORTANT FACTORS TO KEEP IN MIND: When a divergence occurs, it means that price and momentum are not in agreement. And divergence signals are widel
79 USD
PZ Harmonacci Patterns MT5
PZ TRADING SLU
3.25 (4)
This is arguably the most complete harmonic price formation auto-recognition indicator you can find for the MetaTrader Platform. It detects 19 different patterns, takes fibonacci projections as seriously as you do, displays the Potential Reversal Zone (PRZ) and finds suitable stop-loss and take-profit levels. [ Installation Guide | Update Guide | Troubleshooting | FAQ | All Products ] It detects 19 different harmonic price formations It plots primary, derived and complementary Fibonacci p
249 USD
PipFinite Energy Beam MT5
Karlo Wilson Vendiola
Pipfinite creates unique, high quality and affordable trading tools. Our tools may or may not work for you, so we strongly suggest to try the Demo Version for MT4 first. Please test the indicator prior to purchasing to determine if it works for you. We want your good reviews, so hurry up and test it for free...we hope you will find it useful. Combo Energy Beam with Swing Control Strategy: Confirm swing pullback signals Watch Video: (Click Here) Energy Beam with Trend Laser Strategy: Confirm Tr
88 USD
제작자의 제품 더 보기
PZ Trend Trading
PZ TRADING SLU
4.75 (4)
Trend Trading is an indicator designed to profit as much as possible from trends taking place in the market, by timing pullbacks and breakouts. It finds trading opportunities by analyzing what the price is doing during established trends. [ Installation Guide | Update Guide | Troubleshooting | FAQ | All Products ] Trade financial markets with confidence and efficiency Profit from established trends without getting whipsawed Recognize profitable pullbacks, breakouts and early reversals The ind
175 USD
PZ Harmonacci Patterns
PZ TRADING SLU
3.43 (7)
This is arguably the most complete harmonic price formation auto-recognition indicator you can find for the MetaTrader Platform. It detects 19 different patterns, takes fibonacci projections as seriously as you do, displays the Potential Reversal Zone (PRZ) and finds suitable stop-loss and take-profit levels. [ Installation Guide | Update Guide | Troubleshooting | FAQ | All Products ] It detects 19 different harmonic price formations It plots primary, derived and complementary Fibonacci pro
249 USD
PZ Swing Trading MT5
PZ TRADING SLU
5 (4)
Swing Trading is the first indicator designed to detect swings in the direction of the trend and possible reversal swings. It uses the baseline swing trading approach, widely described in trading literature. The indicator studies several price and time vectors to track the aggregate trend direction and detects situations in which the market is oversold or overbought and ready to correct. [ Installation Guide | Update Guide | Troubleshooting | FAQ | All Products ] Profit for market swings with
175 USD
PZ Trend Trading MT5
PZ TRADING SLU
3.67 (3)
Trend Trading is an indicator designed to profit as much as possible from trends taking place in the market, by timing pullbacks and breakouts. It finds trading opportunities by analyzing what the price is doing during established trends. [ Installation Guide | Update Guide | Troubleshooting | FAQ | All Products ] Trade financial markets with confidence and efficiency Profit from established trends without getting whipsawed Recognize profitable pullbacks, breakouts and early reversals The ind
175 USD
PZ Support Resistance MT5
PZ TRADING SLU
4 (5)
Tired of plotting support and resistance lines? This is a multi-timeframe indicator that detects and plots supports and resistance lines in the chart with the same precision as a human eye would. As price levels are tested over time and its importance increases, the lines become thicker and darker, making price leves easy to glance and evaluate. [ Installation Guide | Update Guide | Troubleshooting | FAQ | All Products ] Boost your technical analysis Customizable timeframe selection Read pri
125 USD
PZ Harmonacci Patterns MT5
PZ TRADING SLU
3.25 (4)
This is arguably the most complete harmonic price formation auto-recognition indicator you can find for the MetaTrader Platform. It detects 19 different patterns, takes fibonacci projections as seriously as you do, displays the Potential Reversal Zone (PRZ) and finds suitable stop-loss and take-profit levels. [ Installation Guide | Update Guide | Troubleshooting | FAQ | All Products ] It detects 19 different harmonic price formations It plots primary, derived and complementary Fibonacci p
249 USD
PZ Goldfinch Scalper EA MT5
PZ TRADING SLU
3.49 (35)
This is the latest iteration of my famous scalper, Goldfinch EA, published for the first time almost a decade ago. It scalps the market on sudden volatility expansions that take place in short periods of time: it assumes and tries to capitalize of inertia in price movement after a sudden price acceleration. This new version has been simplified to allow the trader use the optimization feature of the tester easily to find the best trading parameters. [ Installation Guide | Update Guide | Troublesh
FREE
PZ Support Resistance
PZ TRADING SLU
3.33 (3)
Tired of plotting support and resistance lines? This is a multi-timeframe indicator that detects and plots supports and resistance lines in the chart with the same precision as a human eye would. As price levels are tested over time and its importance increases, the lines become thicker and darker, making price leves easy to glance and evaluate. [ Installation Guide | Update Guide | Troubleshooting | FAQ | All Products ] Boost your technical analysis Customizable timeframe selection Read pri
125 USD
PZ Wolfe Waves
PZ TRADING SLU
Wolfe Waves are naturally occurring trading patterns present in all financial markets and represent a fight towards an equilibrium price. These patterns can develop over short and long-term time frames and are one of the most reliable predictive reversal patterns in existence, normally preceding strong and long price movements. [ Installation Guide | Update Guide | Troubleshooting | FAQ | All Products ] Clear trading signals Amazingly easy to trade Customizable colors and sizes Implements perfor
125 USD
PZ Reversal Fractals MT5
PZ TRADING SLU
4.59 (29)
This is the latest iteration of my famous indicator, Reversal Fractals, published for the first time almost a decade ago. It examines the price structure of fractals to determine possible reversal points in the market, providing timing to positional traders that already have a fundamental or technical valuation model. [ Installation Guide | Update Guide | Troubleshooting | FAQ | All Products ] Reversal fractals can start long trends The indicator is non repainting It implements alerts of all k
FREE
PZ Goldfinch Scalper EA
PZ TRADING SLU
2.68 (40)
This is the latest iteration of my famous scalper, Goldfinch EA, published for the first time almost a decade ago. It scalps the market on sudden volatility expansions that take place in short periods of time: it assumes and tries to capitalize of inertia in price movement after a sudden price acceleration. This new version has been simplified to allow the trader use the optimization feature of the tester easily to find the best trading parameters. [ Installation Guide | Update Guide | Troublesh
FREE
PZ Day Trading MT5
PZ TRADING SLU
2.6 (5)
This indicator detects price reversals in a zig-zag fashion, using only price action analysis and a donchian channel. It has been specifically designed for short-term trading, without repainting or backpainting at all. It is a fantastic tool for shrewd traders aiming to increase the timing of their operations. [ Installation Guide | Update Guide | Troubleshooting | FAQ | All Products ] Amazingly easy to trade It provides value on every timeframe It displays suitable SL and TP levels It impl
175 USD
PZ Day Trading
PZ TRADING SLU
3.67 (3)
This indicator detects price reversals in a zig-zag fashion, using only price action analysis and a donchian channel. It has been specifically designed for short-term trading, without repainting or backpainting at all. It is a fantastic tool for shrewd traders aiming to increase the timing of their operations. [ Installation Guide | Update Guide | Troubleshooting | FAQ | All Products ] Amazingly easy to trade It provides value on every timeframe It provides suitable SL and TP levels It impl
175 USD
This indicator finds AB=CD retracement patterns. The AB=CD Retracement pattern is a 4-point price structure where the initial price segment is partially retraced and followed by an equidistant move from the completion of the pullback, and is the basic foundation for all harmonic patterns. [ Installation Guide | Update Guide | Troubleshooting | FAQ | All Products ] Customizable pattern sizes Customizable AC and BD ratios Customizable breakout periods Customizable lines, colors and sizes It
75 USD
PZ Pivot Points MT5
PZ TRADING SLU
4.95 (21)
This indicator displays pivot points in the chart, including historical vales, and supports many calculation modes for Pivot Points and S/R levels. [ Installation Guide | Update Guide | Troubleshooting | FAQ | All Products ] It plots historical levels for backtesting purposes It allows you to select the reference timeframe It implements different Pivot Point calculation modes It implements different SR calculation modes It implements customizable colors and sizes Calculation Modes The indi
FREE
PZ Binary Options MT5
PZ TRADING SLU
4.18 (11)
This indicator analyzes price action patterns and helps you to make positive equity decisions in the binary options market. [ Installation Guide | Update Guide | Troubleshooting | FAQ | All Products ] Easy to trade Trade both call and put options No crystal ball and no predictions The indicator is non-repainting The only strategy suitable for binary options is applying a mathematical approach, like professional gamblers do. It is based on the following principles: Every binary option represents
FREE
PZ Trendlines MT5
PZ TRADING SLU
4.8 (5)
Tired of plotting trendlines? The PZ TrendLines MT5 indicator applies a mechanical approach to the construction of trend lines for you!  [ Installation Guide | Update Guide | Troubleshooting | FAQ | All Products ] It can draw up to 18 trendlines Trendlines can be optionally based on fractals Each line represents a breakout level Each trendline can be broken or rejected Configurable amount of lines Configurable colors Support I am happy to provide free products but given my limited time, they com
FREE
Wolfe Waves are naturally occurring trading patterns present in all financial markets and represent a fight towards an equilibrium price. These patterns can develop over short and long-term time frames and are one of the most reliable predictive reversal patterns in existence, normally preceding strong and long price movements. [ Installation Guide | Update Guide | Troubleshooting | FAQ | All Products ] Clear trading signals Amazingly easy to trade Customizable colors and sizes Implements perfo
125 USD
PZ Inside Bars MT5
PZ TRADING SLU
4.5 (8)
This indicator detects inside bars of several ranges, making it very easy for price action traders to spot and act on inside bar breakouts. [ Installation Guide | Update Guide | Troubleshooting | FAQ | All Products ] Easy to use and understand Customizable color selections The indicator implements visual/mail/push/sound alerts The indicator does not repaint or backpaint An inside bar is a bar or series of bars which is/are completely contained within the range of the preceding bar. A blue box is
FREE
PZ Swing Trading
PZ TRADING SLU
5 (4)
Swing Trading is the first indicator designed to detect swings in the direction of the trend and possible reversal swings. It uses the baseline swing trading approach, widely described in trading literature. The indicator studies several price and time vectors to track the aggregate trend direction and detects situations in which the market is oversold or overbought and ready to correct. [ Installation Guide | Update Guide | Troubleshooting | FAQ | All Products ] Profit for market swings with
175 USD
PZ Turtle Trading MT5
PZ TRADING SLU
4.43 (7)
The Turtle Trading Indicator implements the original Dennis Richards and Bill Eckhart trading system, commonly known as The Turtle Trader. This trend following system relies on breakouts of historical highs and lows to take and close trades: it is the complete opposite to the "buy low and sell high" approach. The main rule is "Trade an N-day breakout and take profits when an M-day high or low is breached (N must me above M)".  [ Installation Guide | Update Guide | Troubleshooting | FAQ | All Pr
FREE
This indicator recognizes over 30 Japanese Candlestick Patterns and highlights them beautifully on the chart. It is simply one of those indicators price action traders can't live without. Boost your technical analysis overnight Detect japanese candlestick patterns easily Trade reliable and universal reversal patterns Hop onto established trends safely using continuation patterns The indicator is non-repainting and implements alerts The indicator implements a multi-timeframe dashboard It detects
99 USD
PZ Pivot Points
PZ TRADING SLU
4.62 (13)
This indicator displays pivot points in the chart, including historical vales, and supports many calculation modes for Pivot Points and S/R levels.  [ Installation Guide | Update Guide | Troubleshooting | FAQ | All Products ] It plots historical levels for backtesting purposes It allows you to select the reference timeframe It implements different Pivot Point calculation modes It implements different SR calculation modes It implements customizable colors and sizes Calculation Modes The indi
FREE
PZ Trendlines
PZ TRADING SLU
4.6 (10)
Tired of plotting trendlines? The PZ TrendLines indicator applies a mechanical approach to the construction of trend lines for you!  [ Installation Guide | Update Guide | Troubleshooting | FAQ | All Products ] It can draw up to 18 trendlines Trendlines can be optionally based on fractals Each line represents a breakout level Each trendline can be broken or rejected Configurable amount of lines Configurable colors Support I am happy to provide free products but given my limited time, they come
FREE
PZ Market Profile
PZ TRADING SLU
4.2 (10)
The market profile indicator provides with an X-Ray vision into market activity, outlining the most important price levels, value area and control value of the daily trading session. [ Installation Guide | Update Guide | Troubleshooting | FAQ | All Products ] Easy to understand and use Understand market dynamics easily Automatic timeframe selection Identify zones of trading value and discard others It is useful in all market conditions Effective for any trading strategy It implements three color
FREE
PZ Lopez Flow MT5
PZ TRADING SLU
5 (3)
This indicator studies price action as an aggregation of price and time vectors, and uses the average vector to determine the direction and strength of the market. This indicator highlights the short-term directionality and strength of the market, and can be used to capitalize from short-term price movements by trading breakouts or binary options.  [ Installation Guide | Update Guide | Troubleshooting | FAQ | All Products ] Find market direction easily Confirm with breakouts or other indicators
FREE
PZ Sandwich Bars MT5
PZ TRADING SLU
5 (2)
This indicator detects Sandwich Bars of several ranges, an extremely reliable breakout pattern. A sandwich setup consists on a single bar that engulfs several past bars, breaking and rejecting the complete price range. [ Installation Guide | Update Guide | Troubleshooting | FAQ | All Products ] Easy and effective usage Customizable bar ranges Customizable color selections The indicator implements visual/mail/push/sound alerts The indicator does not repaint or backpaint The indicator could not b
FREE
PZ Oscillator MT5
PZ TRADING SLU
4 (7)
This is a smooth and responsive accelerometer which reveals the market trend and strength. [ Installation Guide | Update Guide | Troubleshooting | FAQ | All Products ] Two moving averages indicate trend direction The histogram represents strength of the price movement It draws buy and sell zones as colored vertical lines Should be used as a confirmation indicator Customizable line widths and colors It implements alerts of all kinds This indicator is similar to MACD but aims to react faster t
FREE
PZ Three Drives
PZ TRADING SLU
4 (3)
This indicator finds Three Drives patterns. The Three Drives pattern is a 6-point reversal pattern characterised by a series of higher highs or lower lows that complete at a 127% or 161.8% Fibonacci extension. It signals that the market is exhausted and a reversal can happen. [ Installation Guide | Update Guide | Troubleshooting | FAQ | All Products ] Customizable pattern sizes Customizable colors and sizes Customizable breakout periods Customizable 1-2-3 and 0-A-B ratios It implements visua
FREE
PZ Binary Options
PZ TRADING SLU
4 (2)
This indicator analyzes price action patterns and helps you to make positive equity decisions in the binary options market. [ Installation Guide | Update Guide | Troubleshooting | FAQ | All Products ] Easy to trade Trade both call and put options No crystal ball and no predictions The indicator is non-repainting The only strategy suitable for binary options is applying a mathematical approach, like professional gamblers do. It is based on the following principles: Every binary option represents
FREE
필터:
Eduardo Gregório
113
Eduardo Gregório 2022.07.05 00:29 
 

Muito ruim. Não comprem. Vão jogar dinheiro na lata do lixo.

marcofi
86
marcofi 2021.10.02 11:54 
 

Realmente o indicador falha, abrindo setas de compra e venda e quando vc atualiza o gráfico elas somem, mostrando um sinal errado da ferramenta a cada sinal você tem que atualizar o gráfico para saber se esta correto a informação na tela, fora que é impossível utilizar num EA a ferramenta através da função copybuffer, sendo que o ndicador utiliza -1 nos buffers, não existe copybuffers de compra e venda nesse indicador, impossível utilizar a função copybuffer neste indicador.

리뷰 답변
버전 6.1 2022.01.31
- Recompiled
버전 6.0 2019.04.16
- Drawing bug fix
버전 5.4 2019.04.16
- Bug fix on DeInit.
버전 5.2 2019.04.14
- Added fibo ratios for SL / TP
버전 5.0 2019.04.14
- Added profit targets and stop loss
버전 4.0 2018.06.29
- Added type of signal to find
- Added Fibo ratios
- Added stats