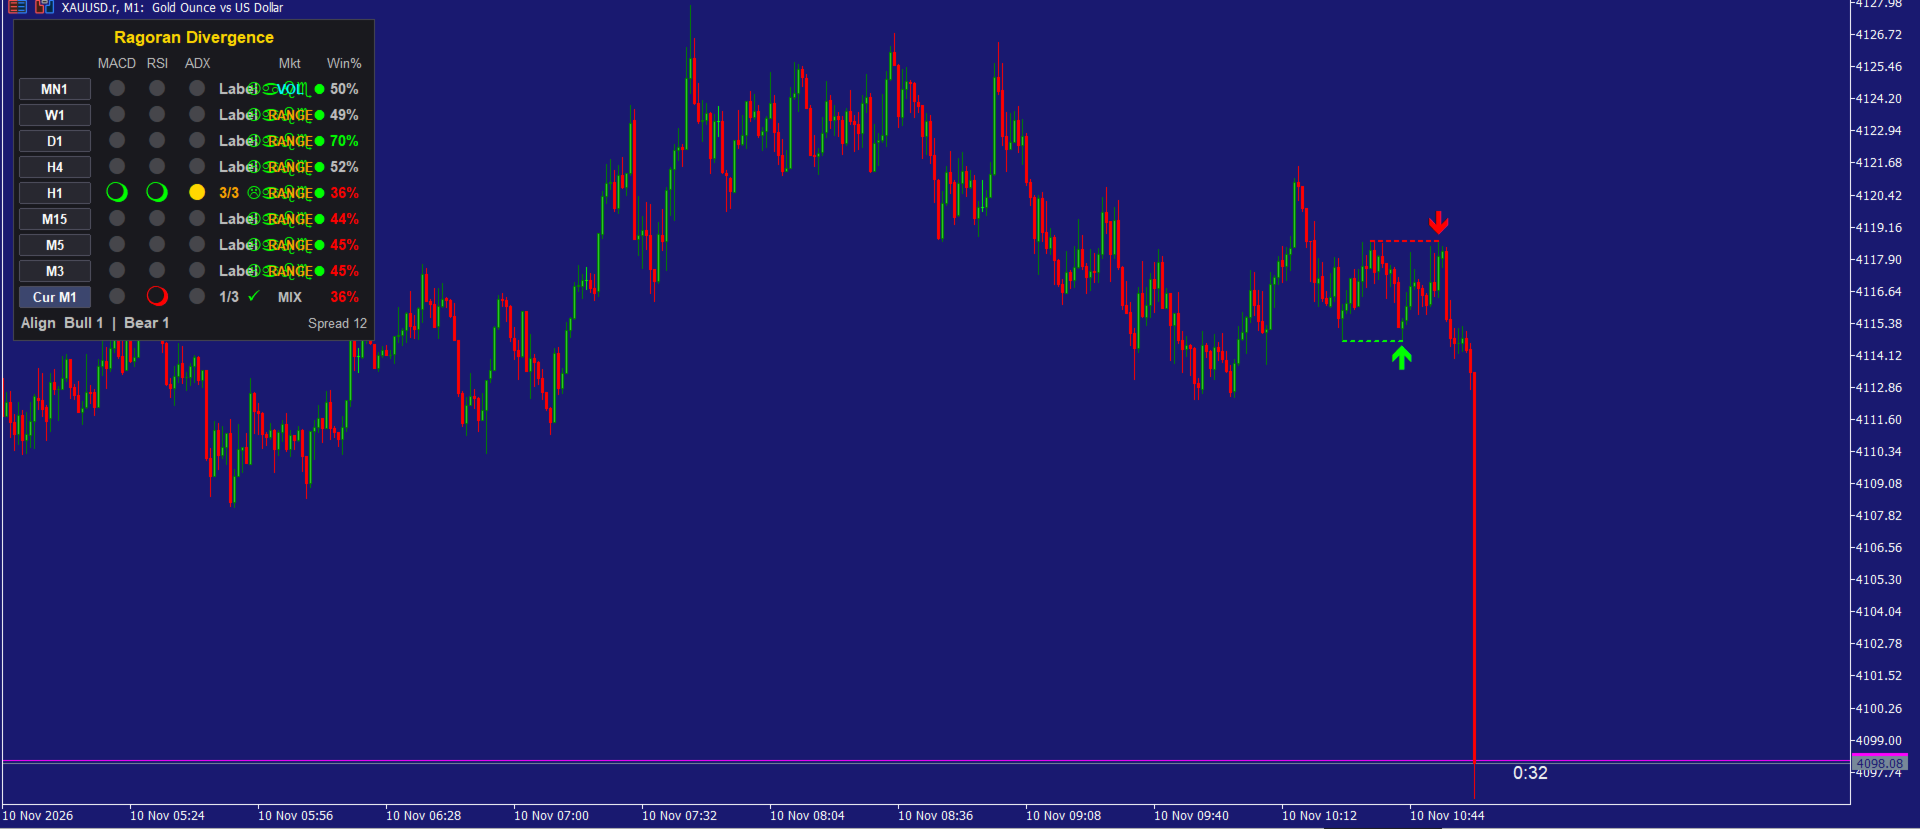
Ragoran Divergence
- 지표
- 버전: 2.50

SHORT DESCRIPTION
---------------------------------------------------------------------
Multi-timeframe MACD / RSI / ADX divergence ALERT dashboard: signal
lifecycle, momentum, market state, historical hit rate and clean push alerts.
---------------------------------------------------------------------
FULL DESCRIPTION
---------------------------------------------------------------------
WHAT IT IS
Ragoran Divergence is a market-monitoring and ALERT tool. It watches up
to nine timeframes at the same time, detects MACD, RSI and ADX
divergences on each of them, and condenses everything into one compact
panel and a clean mobile push message. One chart, one panel, instead of
nine charts and dozens of separate indicator windows.
IMPORTANT: THIS IS AN ALERT TOOL, NOT A TRADING SYSTEM
- It does not open, close or manage trades.
- It does not guarantee profit and it does not guarantee that losses
will be avoided. A divergence is a warning that momentum is changing;
price can and often does continue in the original direction.
- Every statistic shown (Hit%) describes past signals only.
- You remain fully responsible for your own analysis, entries, stop
losses and risk management.
HOW IT WORKS
For every timeframe row the indicator finds price pivots (swing highs
and swing lows). It compares the last two pivots with the same points on
MACD, RSI and ADX. Where price and the indicator disagree, the matching
light turns on:
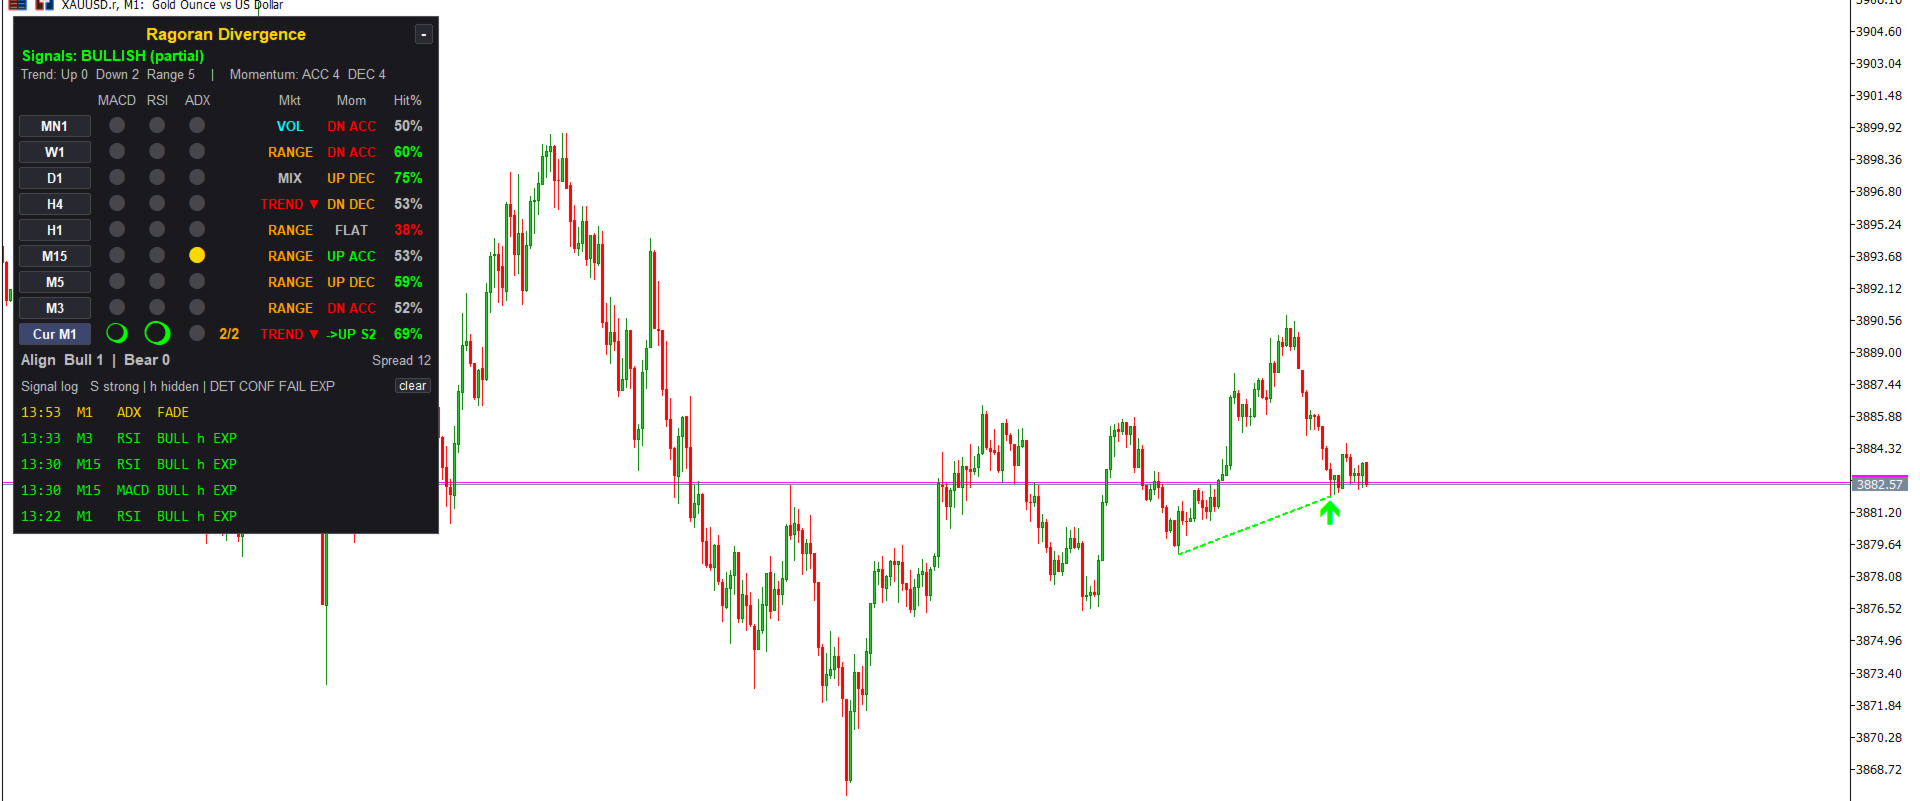
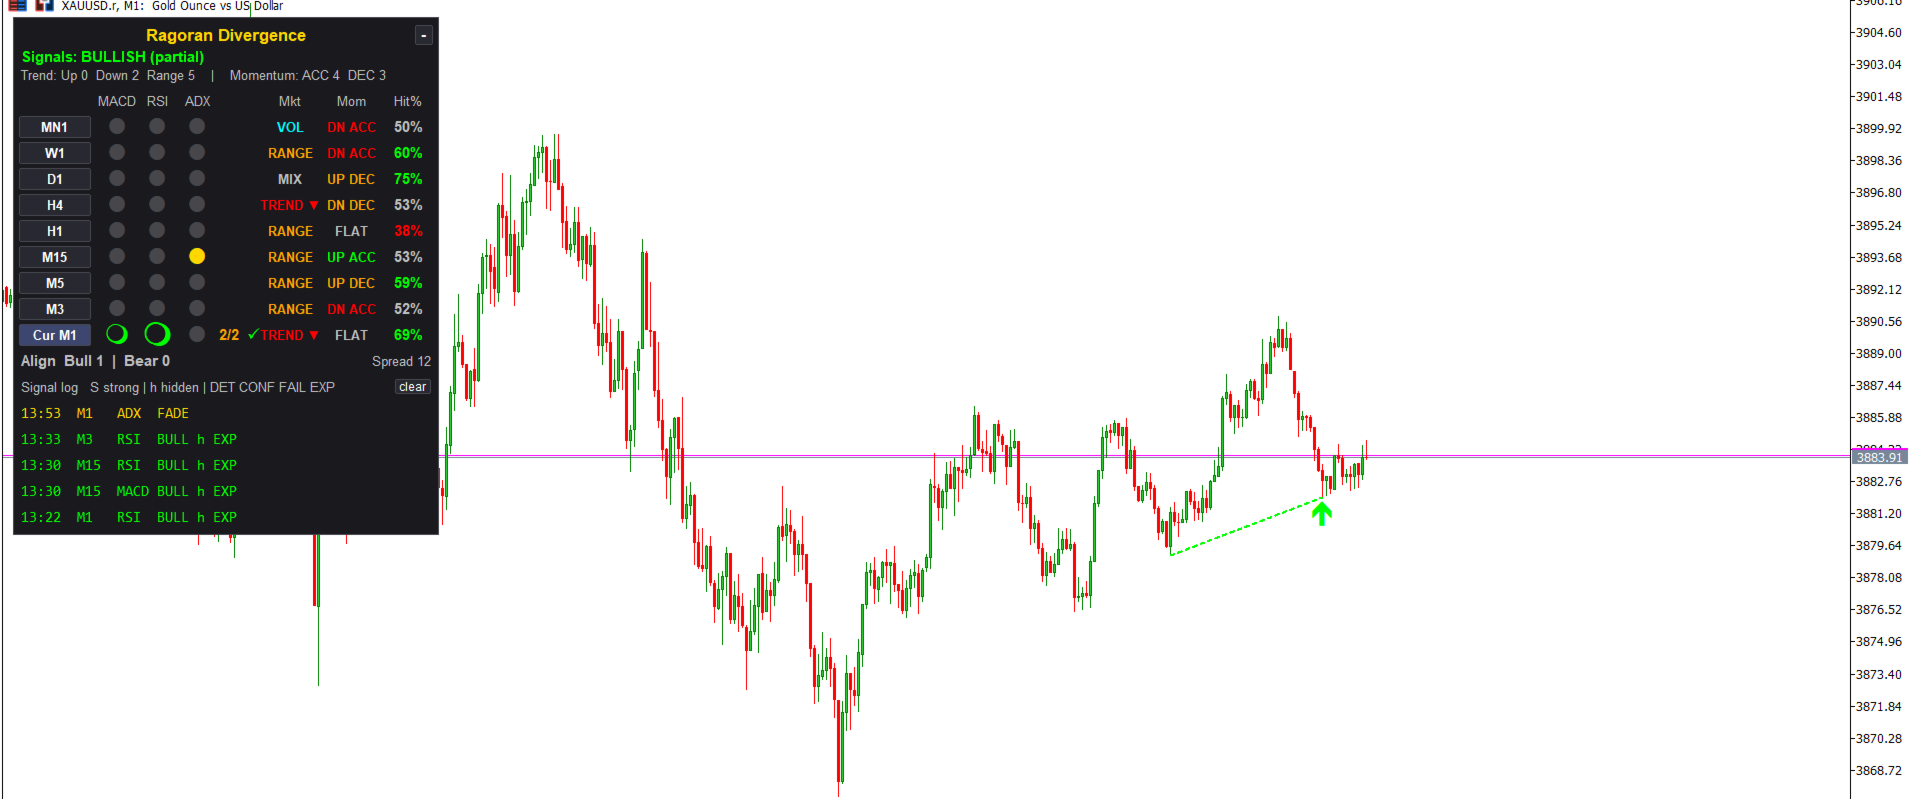
Green light = bullish divergence
Red light = bearish divergence
Yellow light = ADX is fading while price makes a new extreme
(trend strength is weakening; ADX has no direction)
Gray light = no signal
The shape and size of a light carry extra meaning:
Filled circle = regular divergence (possible reversal)
Ring = hidden divergence (possible trend continuation)
Larger circle = strong divergence
Dimmed circle = failed signal (price broke through the pivot)
All calculations use closed candles. A pivot needs a few candles on its
right side to be confirmed (5 by default), so signals and alerts arrive
with a delay by design. This delay is inherent to divergence detection.
READING THE PANEL (TOP TO BOTTOM)
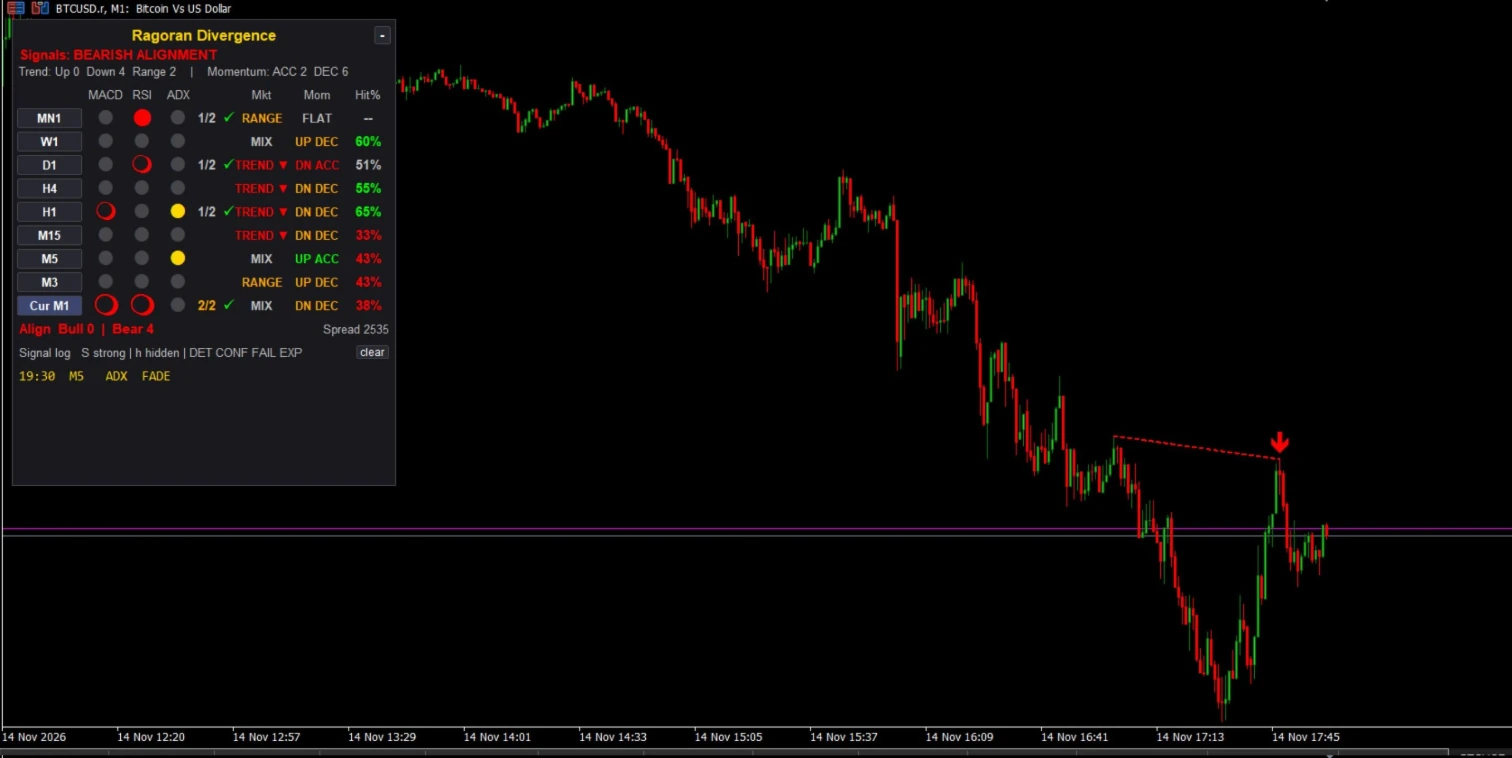
1) Title bar
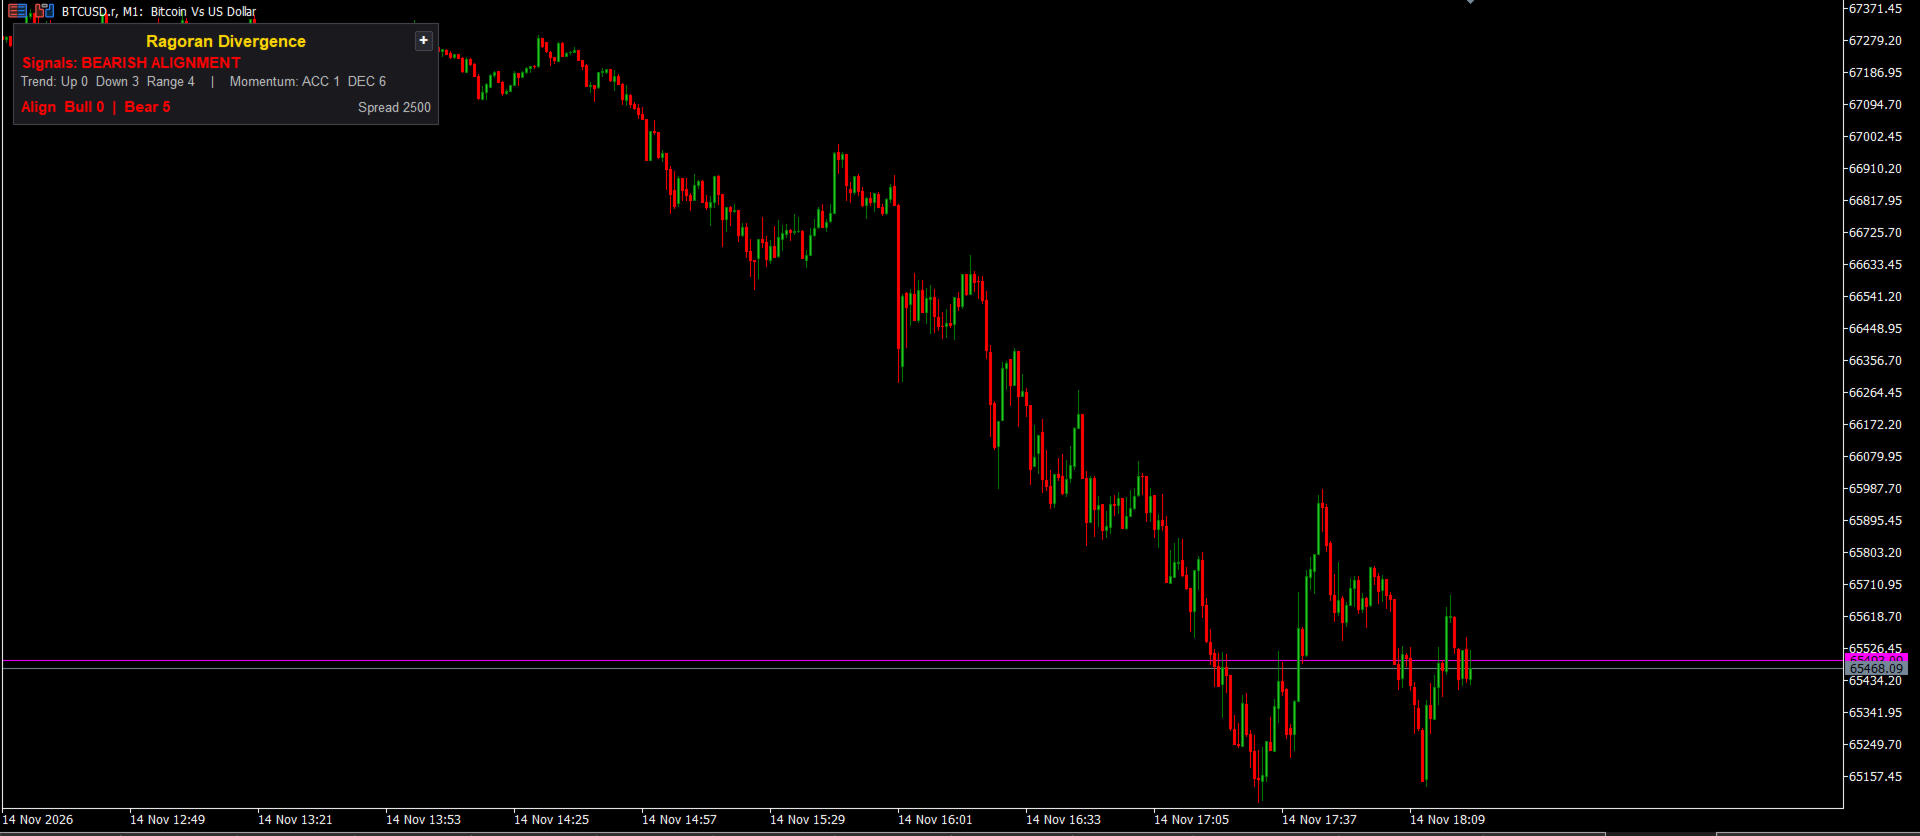
The "-" button collapses the panel to the title, the overview strip and
the alignment line. Click again to expand. The state is remembered.
2) Overview strip (always visible)
Line 1 - "Signals": the verdict of all timeframe rows, based only on
MACD/RSI divergence signals:
NO SIGNALS, BULLISH / BEARISH (partial), BULLISH / BEARISH ALIGNMENT
(enough rows agree), or MIXED SIGNALS when timeframes disagree.
Line 2: how many timeframes are in an up trend, a down trend or a
range, and how many have accelerating (ACC) or decelerating (DEC)
momentum. This is context only and never changes the signal lights.
3) Timeframe rows (one per timeframe, plus one "Cur" row for the chart
timeframe)
- Timeframe button: click it to switch the chart to that timeframe.
- MACD / RSI / ADX lights as described above.
- Score: "1/2" or "2/2" = how many of MACD and RSI agree in direction.
ADX is never counted in this score because it has no direction.
"MIX" = MACD and RSI point in opposite directions.
- Check mark: at least one signal in the row is confirmed.
- Mkt (market state): TREND with an up or down arrow, RANGE, VOL
(volatile) or MIX, calculated from Efficiency Ratio, relative ATR
and ADX. The arrow is shown only when price change and DI+/DI- agree.
- Mom (momentum): UP or DN = direction of the MACD histogram;
ACC or DEC = the histogram is growing or shrinking; FLAT = near zero.
When a momentum shift is developing against the current momentum, the
cell shows "->UP S2" or "->DN S3" (shift stage, see below).
- Hit%: historical hit rate of past signals on that timeframe.
"--" means there are not enough past events yet.
- Hover the mouse over any light or cell for a detailed tooltip.
4) Alignment line
"Align Bull n | Bear m" = number of timeframe rows whose signals point
up and down. The current spread is shown on the right.
5) Signal log
The most recent signals, newest first, for example:
"07:39 M5 MACD BULL h FAIL"
Time (your computer clock), timeframe, indicator, direction, flags and
lifecycle state. S = strong, h = hidden. The "clear" button empties the
log. The log survives timeframe switches and indicator reloads.
SIGNAL LIFECYCLE
Every divergence goes through a defined life cycle:
DET Detected: the pivot is confirmed, but price has not yet closed
beyond the pivot candle.
CONF Confirmed: a candle closed beyond the pivot candle in the signal
direction.
FAIL Failed: price closed through the pivot extreme against the
signal. Failed signals are dimmed and are NOT counted in the
score, in the alignment or in alerts.
EXP Expired: the signal is older than the active window.
The tooltip of every light also shows freshness: Fresh, Active or Aging
(thresholds adjustable).
MOMENTUM AND SHIFT STAGES
Momentum is read from the MACD histogram. A "momentum shift" is tracked in
stages, always against the current momentum:
S1 Momentum is decelerating.
S2 Decelerating AND a live divergence in the opposite direction.
S3 Decelerating AND that opposite divergence is confirmed.
Stages are descriptive conditions, not predictions.
SIGNAL STRENGTH
MACD and RSI signals are classified as strong or weak from the price
extension between the two pivots (in ATR) and the size of the indicator
difference. Thresholds are adjustable. You can choose to count only strong
signals in alerts.
ALERTS
- Push notification through your MetaTrader terminal.
- Pop-up alert (off by default) and sound alert, with separate sound
files for bullish, bearish and other alerts (any .wav file placed in
MQL5\Sounds).
- One merged message for several simultaneous signals, with cooldown
between alerts for the same row.
- Four priority levels, highest first inside a message:
NORMAL one of MACD / RSI
IMPORTANT MACD and RSI agree
VERY IMPORTANT MACD and RSI agree and enough timeframe rows agree
URGENT very important, plus a momentum shift (S2 or S3)
in the same direction
A minimum priority can be set.
- Separate alerts for "new signal" and "signal confirmed".
- Alert when N timeframe rows agree on direction.
- Higher-timeframe context inside the message, for example
"H1 trend UP aligned" or "H1 RANGE".
- Optional alert when the market state changes (TREND / RANGE / VOL),
only after the new state has persisted for several closed candles
(off by default).
- Fully customizable text: prefix and template with the placeholders
{sym} {tf} {prio} {agree} {dir} {ind} {tag} {mkt} {mom} {htf}.
Example message:
Ragoran | XAUUSD | M15 VERY IMPORTANT BEAR 2/2 (MACD+RSI) NEW | H1 trend UP opposed
CHART DRAWING (CURRENT TIMEFRAME ONLY)
At most one trend line and one arrow per indicator, drawn between the two
pivots of the latest divergence. A new signal replaces the previous one of
that indicator. Nothing is drawn on other timeframes and no history is
drawn, so your chart stays clean and fast.
HOW TO USE IT - STEP BY STEP
1. Attach the indicator to any chart and symbol. Wait a few seconds while
the terminal loads history for the higher timeframes. Rows stay gray
until their data is ready.
2. Choose your timeframes. Each of the 8 rows can be set to any timeframe
from M1 to MN1 or to OFF. The extra "Cur" row follows the chart. A
good starting point is the default set, or for intraday use for example
H4, H1, M15, M5, M1.
3. Read the panel from the top down:
a) Overview strip: is there alignment, or do timeframes disagree?
b) Higher timeframe rows (D1, H4, H1): what is the background?
Is the market in TREND (with direction), RANGE or VOL?
c) Lower timeframe rows (M15, M5, M3): are there fresh, strong,
confirmed signals? Check the Mom column for DEC and shift stages.
d) Hit%: how have signals on this timeframe worked recently on this
symbol? Treat it as information, not as a promise.
4. Prefer clearer situations. Signals are generally more meaningful when
MACD and RSI agree (2/2), the light is large (strong), the signal is
Fresh and CONF (confirmed), several timeframes agree, and the
higher-timeframe context does not strongly contradict the signal.
When timeframes disagree (MIXED SIGNALS), the picture is unclear.
5. Let it alert you. Enable push notifications in the terminal
(Tools > Options > Notifications, enter your MetaQuotes ID), keep the
Alerts options you want, choose your sound files, and let the indicator
run. When a message arrives, open the chart, click the timeframe button
named in the message, hover over the lights, and decide for yourself.
6. Tune the noise level to your style.
- Fewer alerts: require MACD and RSI to agree (default), count only
strong signals, raise the minimum priority, increase the cooldown.
- More alerts: allow a single indicator, lower the minimum priority.
- Different behavior per timeframe: use the per-row override fields,
for example "8,21,5,9,10,75,25,20" gives a faster configuration for
one row (macdFast, macdSlow, macdSignal, rsiPeriod, adxPeriod,
rsiOB, rsiOS, adxLevel). Empty values fall back to the global ones.
- Light theme and panel position are in the Panel inputs.
7. Always combine the information with your own analysis, and always use
a stop loss and sound risk management. The indicator cannot know your
strategy, your risk limits or the news.
MAIN INPUT GROUPS
Timeframe rows 8 configurable rows + current-timeframe row
Pivots Left/right bars, min/max distance, active window,
hidden divergence on/off
Indicators MACD (fast, slow, signal, main line or histogram),
RSI (period, levels, zone filter), ADX (period,
level)
Per-row overrides Separate periods and levels for any row
Divergence strength Thresholds for strong signals, strong-only alerts
Market state Efficiency Ratio, ATR and volatility thresholds
Statistics (Hit%) Enable, history length, horizon, target and stop
in ATR, minimum events
Alerts Minimum agreement, priority, confirmation alert,
alignment alert, cooldown, popup, push, sound
files, text prefix and template
Momentum Histogram acceleration and flat thresholds
Market-state alerts On/off and persistence
Signal lifecycle Freshness thresholds
Chart drawing On/off, clear when light turns off
Signal log Number of rows
Panel Refresh interval, position, size, theme
HIT% - WHAT IT MEANS AND WHAT IT DOES NOT
For each timeframe the indicator scans recent history and shows the
percentage of past MACD/RSI divergence events that reached +1 ATR in the
signal direction before -1 ATR against it, within 10 candles (all three
values are adjustable). Each divergence event is counted once. Strong
signals are shown separately in the tooltip.
It is a historical SIGNAL success rate under a fixed ATR rule. It is NOT a
strategy win rate. It does not include spread, commission, slippage, trade
management or your entry and exit rules. Results can differ strongly
between symbols, timeframes and market periods, and past results do not
predict future results.
PERFORMANCE
- Each timeframe is recalculated only when a new candle closes on that
timeframe.
- Heavy calculations are spread across timer ticks.
- Only one line and one arrow per indicator are ever drawn, and only on
the current timeframe.
REQUIREMENTS AND NOTES
- MetaTrader 5, any symbol, any chart timeframe.
- Higher timeframes need enough history in the terminal.
- Push notifications need a MetaQuotes ID in the terminal settings;
MetaTrader limits the number of notifications per minute.
- The indicator uses a timer to refresh the panel and does not need
ticks on every timeframe.
FREQUENTLY ASKED QUESTIONS
Does it repaint?
Signals are calculated from closed candles and a pivot is accepted only
after its confirmation candles have closed. The indicator does not trade.
Does it give buy and sell signals?
No. It reports divergence conditions, momentum and market context so
that you can decide. It is an alert tool.
Does it guarantee profits or protect me from losses?
No. No indicator can. Divergences often fail, especially in strong
trends. Use your own analysis and risk management.
Why are all lights gray?
Either there is currently no divergence on those timeframes, or the
terminal is still loading history for them.
Why does a row show MIX?
MACD and RSI currently point in opposite directions on that timeframe.
Why do I see "--" in Hit%?
There are fewer past events than the minimum set in the inputs.
Can I change the alert sounds and the message text?
Yes. Use any .wav file in MQL5\Sounds and edit the prefix and template
in the Alerts inputs.
Can I use it on several charts?
Yes. Each chart runs its own panel. The signal log is stored per chart.
RISK DISCLAIMER
Trading leveraged products such as forex, metals and CFDs carries a high
level of risk and may not be suitable for every investor. Ragoran
Divergence is a technical analysis and alert tool. It is provided for
information only, does not constitute financial advice, and does not
guarantee profit or protection from loss. Statistics such as Hit% describe
past signals only and are not a forecast. You alone are responsible for
your trading decisions and results.
---------------------------------------------------------------------
WHAT'S NEW - VERSION 2.50
---------------------------------------------------------------------
- Overview strip with signal verdict, trend counts and momentum counts.
- Mom column: histogram-based momentum (UP/DN, ACC/DEC, FLAT) and momentum
shift stages S1 to S3.
- Signal lifecycle (DET, CONF, FAIL, EXP) with freshness; failed signals
are dimmed and excluded from scores, alignment and alerts.
- Directional agreement of MACD and RSI (n/2); ADX shown separately.
- Alert priorities NORMAL to URGENT, higher-timeframe context in messages,
optional market-state change alerts.
- Trend direction (arrow and colour) in the Mkt column.
- Persistent signal log with a clear button.
- Divergence strength (strong/weak), Hit% statistics, light theme,
collapsible panel, per-row indicator settings, custom alert text.
---------------------------------------------------------------------
SUGGESTED KEYWORDS
---------------------------------------------------------------------
divergence, MACD, RSI, ADX, multi-timeframe, dashboard, alert, push
notification, hidden divergence, momentum, market state, signal log