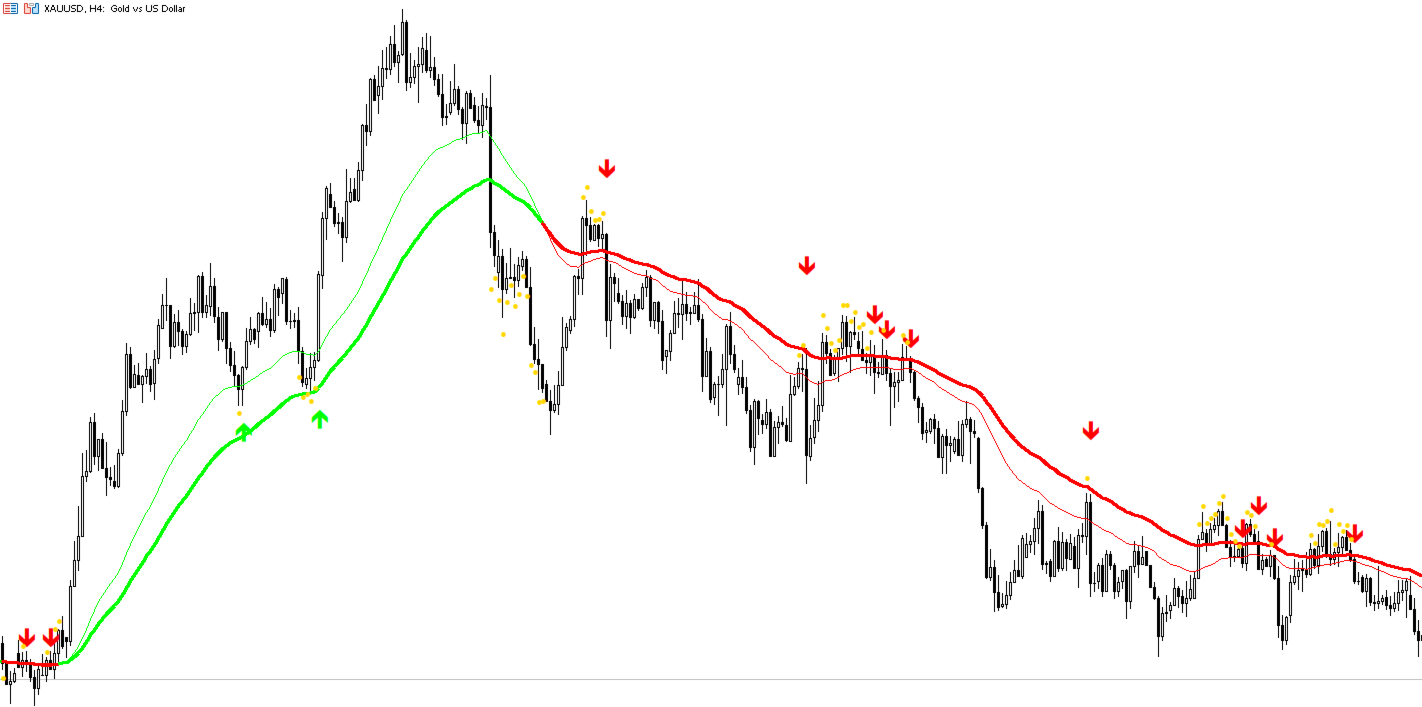
TrendSling Pullback Signals
- 지표
- 버전: 1.0
- 활성화: 5

TrendSling Pullback Signals: trade pullbacks in the direction of the trend
TrendSling Pullback Signals is a clean, easy-to-read indicator that helps you stay on the right side of the market. Two exponential moving averages define the trend, and the indicator highlights pullbacks and entry points in that direction only. It does not try to catch tops and bottoms.
How it works
- Trend detection. When the Fast EMA is above the Slow EMA, the trend is up and both lines turn green. When the Fast EMA is below the Slow EMA, the trend is down and both lines turn red.
- Pullback alert. Gold dots appear when price pulls back against the trend, closing on the wrong side of the Fast EMA. This is an early warning to prepare for a possible entry.
- Entry signal. A green arrow (buy) or red arrow (sell) appears when price closes back across the Fast EMA in the direction of the trend.
Key features
- Works on any symbol and any timeframe (Forex, metals, indices, crypto, stocks)
- Clear trend coloring on the chart, no clutter
- Two signal levels: early pullback alert and confirmed entry arrow
- Optional minimum EMA distance filter to avoid flat, low-momentum markets
- Alerts on closed bars: terminal popup, mobile push notification and email
- Fully adjustable EMA periods and applied price
- Lightweight and fast, suitable for multiple charts at once
- Signals on closed bars do not repaint
Input parameters
| Parameter | Description |
|---|---|
| Slow EMA period | Period of the slow EMA that defines the trend (default 62) |
| Fast EMA period | Period of the fast EMA used for pullbacks and entries (default 38) |
| Applied price | Price used for the EMA calculation |
| Show pullback dots | Show or hide early pullback alerts |
| Show entry arrows | Show or hide entry arrows |
| Min EMA distance (points) | Ignore signals when the EMAs are closer than this value, 0 = off |
| Alert: terminal popup | Enable popup alerts |
| Alert: push notification | Enable mobile push alerts |
| Alert: email | Enable email alerts |
How to use
- Attach the indicator to any chart.
- Trade only in the direction of the colored EMAs.
- Treat gold dots as a warning that a pullback is in progress.
- Consider an entry when an arrow appears. Place your stop beyond the recent swing or the Slow EMA, and manage risk according to your own strategy.
- For best results, combine it with higher-timeframe trend confirmation and support/resistance levels.
Recommendations
- Works best in trending markets, so use the minimum EMA distance filter on ranging instruments.
- Test different EMA periods on your preferred symbol and timeframe.
- Always use proper risk management.
Risk disclaimer. This indicator is a decision-support tool and does not guarantee profits. Trading involves significant risk of loss. Past performance is not indicative of future results.