• 미리보기
  • 리뷰 (348)
  • 코멘트 (1115)
  • 새 소식

Advanced Supply Demand

4.92

현재 33% 할인!

초보자나 전문 트레이더를 위한 최고의 솔루션!

이 보조지표는 우리가 다수의 독창적 기능과 새로운 공식을 통합한 독특하고 고품질이며 저렴한 거래 도구입니다. 이 업데이트를 통해 이중 시간대를 표시할 수 있습니다. 더 높은 TF를 표시할 수 있을 뿐만 아니라 차트 TF와 더 높은 TF 모두를 표시할 수 있습니다: 중첩 영역 표시. 모든 Supply Demand 트레이더들이 좋아할 것입니다. :)


중요한 정보 공개

Advanced Supply Demand의 잠재력을 극대화하려면 다음을 방문하십시오.https://www.mql5.com/ko/blogs/post/720245 

진입 또는 목표의 명확한 트리거 포인트를 정확히 찾아냄으로 해서 거래가 어떻게 개선될지 상상해 보십시오. 새로운 알고리즘을 기반으로 매수자와 매도자 간의 잠재적인 불균형을 훨씬 더 쉽게 분간할 수 있습니다. 왜냐하면 가장 강한 공급영역과 가장 강한 수요 영역과 과거에 어떻게 진행 되었는지를(이전 영역 표시) 그래픽으로 표시하기 때문입니다. 이러한 기능은 최적의 진입 구역과 레벨을 쉽게 찾을 수 있도록 돕습니다.

사용자는 심볼과 시간대에 대한 영역 강도를 최적화하고 편집할 수 있습니다!

Advanced Supply Demand Indicator는 모든 제품과 기간에서 작동합니다. 새로운 기능으로는 새로운 공식을 포함하며 사용자 입력으로 조정 가능한 2개의 영역 강도 기능이 있습니다. 이러한 기능은 트레이딩에 많은 이점을 줍니다. 가격 이동의 최소 X-팩터가 있는 구역 강도와 같은 독창적인 기능을 사용하는 방법을 익히면 구역이 얼마나 강한지 여부를 알 수 있습니다.

The supply and demand zones은 알림용으로도 사용 가능합니다. 3가지 종류의 알림 방식이 있습니다. 가격이 1) 영역에 진입할 경우 2) 영역을 벗어날 경우) 영역에서 반전 캔들이 형성된 경우. MetaTrader 4 푸시 또는 이메일에서 사운드 알림과 함께 팝업 알림을 사용할 수 있습니다. 알림을 받으면 트레이더로서 무엇을 해야 하는지 알게 될 것입니다.

얼마나 많은 수요 구역이 연속으로 깨졌는지 알려주는 메시지가 표시되므로 추세를 따르고 지속적인 추세를 찾게 됩니다.

표시기는 중첩된 S/D 영역을 감지할 수 있습니다!

강력한 기능! 알림을 통해 S/D 영역이 더 높은 시간 프레임 S/D 영역 내에 중첩되어 있는지 여부를 알려줍니다! 중첩 영역에 대해 모든 알림을 필터링할 수 있습니다.


패러미터

공급 수요 세팅

  • Min candles before a zone is printed (라이브 차트에서 사용됨).
  • Min X-factor of price travel away (ATR) (숫자가 클수록 더 강한 영역). OPTIMIZE HERE FOR YOUR SYMBOL AND TIME FRAME!
  • Min Y-factor of price travel away (영역 사이즈) 2nd Input: 숫자가 클수록 더 강한 영역. OPTIMIZE HERE FOR YOUR SYMBOL AND TIME FRAME!
  • Limited size of a big zone. Max factor (ATR) (확대된 큰 영역이 작아집니다. 숫자가 클수록 더 큰 영역이 생깁니다).

다중 시간 프레임 세팅:

  • Add higher TF
  • Higher TF period (만약 여러 시간 프레임이(MTF) 차트 시간 프레임보다 같거나 작으면 더 큰 타임 시간 프레임이 사용됨)
  • min HTF!-candles before a zone is printed
  • min X-factor of price travel away (ATR) MTF
  • min Y-factor of price travel away (zone size) MTF
  • Limited size of a big zone. Max factor (ATR) MTF (확대된 큰 영역이 작아집니다) 숫자가 클수록 더 큰 영역이 생깁니다).
  • Show inner price labels MTF
  • Show outer price labels MTF

Chart settings:

  • Show inner price labels.
  • Show outer price labels.
  • Show old zones (Sup/Dem counter용으로 필요합니다, 아래를 참조하세요).
  • Show yesterdays high/low
  • Show todays pivot
  • Show number of broken Sup/Dem in a row (counter)
  • Show above in corner
  • draw rectangle extended over live candle

알림 세팅:

  • Alert zone hit
  • Alert zone break
  • Alert reverse candle from zone
  • alert only NESTED zones! (within MTF)
  • Alert Fake Breakout
  • FBO min bar Size Point
  • FBO bar close back % (20-90)
  • FBO pattern bar count (1-3)
  • Popup Alerts (MT4 popup and sound)
  • Send email alerts
  • Send push alerts

컬러세팅:

  • 어떻게 사용하는지 아실 겁니다 각 영역에는 고유한 색상이 있습니다.
    전체 목록을 보려면여기를 클릭 하세요.

이외 설정:

  • PIN 사용(EA용)
  • supply zones의 최대 수 보이기
  • demand zones의 최대 수 보이기
  • 전체 목록을 보려면<a1>여기를 클릭</a1> 하세요.

Tips:

  1. 유저 매뉴얼: 여기를 클릭 하세요.
  2. 제가 만든 템플릿을 사용하십시오(댓글 참조).
  3. 귀하의 심볼과 기간에 대해 영역의 강도를 최적화하십시오.
  4. 추세를 따라 가십시오. 지표는 주로 제가 만든 통화 강도와 관련한 다른 보조 지표 중 하나와 함께 사용됩니다.
  5. 거래 시스템 및 거래 예는 프로필의 저의 뉴스와 블로그에서 확인하십시오.

질문이 있으면 항상 도와 드리겠습니다.

Bernhard 배상

리뷰 20
MILLION MONEY
24
MILLION MONEY 2024.06.11 12:40 
 

hi thanks for support and your indicator i am waiting for your gift for 1 indicator Strength currency and gold for MT4 if you give 1 month gift i will buy after test thanks

Darryl Brown
218
Darryl Brown 2024.05.26 16:48 
 

This indicator is the best on MQL5 in my opinion. The reason why I believe that is because when you can combine it with other indicators it will improve your trading. If you want accurate entries and exits this is the indicator for you. Bravo Bernhard.....Bravo.

Ferrari888
593
Ferrari888 2024.04.10 23:15 
 

Отличная поддержка, Bernhard спасибо за хорошие индикаторы. Я являюсь постоянным клиентом. Все супер

추천 제품
The indicator detects and displays 3 Drives harmonic pattern (see the screenshot). The pattern is plotted by the extreme values of the ZigZag indicator (included in the resources, no need to install). After detecting the pattern, the indicator notifies of that by a pop-up window, a mobile notification and an email. The indicator highlights the process of the pattern formation and not just the complete pattern. In the former case, it is displayed in the contour triangles. After the pattern is com
이 표시기는 시장 분석을 위한 가장 효과적인 도구 중 하나인 피보나치 지원 및 저항 수준을 자동으로 계산하고 표시합니다. 계산은 선택한 기간 및 기간 동안의 평균 가격 데이터를 사용합니다. 이 기간의 최소값과 최대값은 이동의 시작과 끝으로 간주됩니다. 피보나치 수준을 사용하면 가격 움직임이 느려지거나 역전될 수 있는 잠재적인 기준점을 볼 수 있습니다. 즉, 추가 움직임을 예측하고 정지 및 지정가 주문을 하는 데 사용됩니다. 매개변수: PartsShow - 현재 막대에서 표시된 과거 레벨의 수 CalcPeriod - 가격 평균화 기간 SmoothingMethod - 가격 평균화 방법(26개 옵션) TF - 계산에 사용되는 기간 LevelColor - 레벨 라인의 색상 ZeroLevelColor - 제로 레벨 색상 ShowVerticalLine - 레벨 사이의 수직선 표시 활성화/비활성화 VLineStyle - 수직선의 스타일 VLineColor - 수직선의 색상 ShowInfo - 레
Supply and Demand Monster MT4
Tsog Erdene Borjigon Enkhkhudulmur
Supply and demand zones are at the heart of   supply and demand trading . These zones are areas that show  liquidity at a specific price.  The supply zone is also called the distribution zone, while the demand zone is called the accumulation zone.   Our indicator automatically draw supply and demand zones in Metatrader 5. It give opportunity to understand trading zone and avoiding risk.
Trend Ray
Andriy Sydoruk
The indicator shows the potential trend direction by cyclical-wave dependence. Thus, all the rays of the intersection will be optimal rays, in the direction of which the price is expected to move, taking into account the indicator period. Rays can be used as a direction for potential market movement. But we must not forget that the approach must be comprehensive, the indicator signals require additional information to enter the market.
REX complete 3in1
Christophe Godart
This is the complete REX package. It consists of the lite, pro and ULTRA version.  Perfect for beginners and intermediates. REX complete is 100% non repaint. The strategy is based on a mix of different strategies, statistics, including pivot points, oscillators and patterns.  As the trading idea consists of a variety of some classic indicators like Momentum, Williams Percent Range, CCI, Force Index, WPR, DeMarker, CCI, RSI and Stochastic, it is clear that the fundamental indicators have being
Trend Catcher with Alert
Issam Kassas
4.85 (59)
트렌드 캐쳐: 알림 인디케이터와 함께 하는 트렌드 캐쳐 전략은 시장 트렌드와 잠재적인 진입 및 체크 포인트를 식별하는 데 도움이 되는 다목적 기술 분석 도구입니다. 이는 시장 상황에 적응하여 트렌드 방향을 명확하게 시각적으로 표현하는 동적 트렌드 캐쳐 전략을 제공합니다. 트레이더는 선호도와 위험 허용도에 맞게 매개변수를 사용자 정의할 수 있습니다. 이 인디케이터는 트렌드 식별을 지원하고 잠재적인 반전을 신호로 제공하며 트레일링 스탑 메커니즘으로 작동하며 실시간 경고를 제공하여 신속한 시장 대응을 돕습니다. 특징: - 트렌드 식별: 상승 트렌드와 하락 트렌드를 신호합니다. - 트렌드 반전: 양봉 색상이 상승에서 하락으로 변경되거나 그 반대의 경우 잠재적인 반전을 경고합니다. - 실시간 경고: 새로운 트렌드 식별을 위한 경고를 생성합니다. 추천사항: - 통화 및 페어: EURUSD, AUDUSD, XAUUSD 등... - 시간 프레임: H1. - 계정 유형: 모든 E
FREE
Diamond Trend
Segundo Calvo Munoz
Indicator which identifies Trend and also buy/sell opportunities. Use for entries aligned to the Trend.  Although Diamond Trend is very accurate identifying entry points, it is always recommended to use a support indicator in order to reconfirm the operation. Remind to look for those Assets and Timeframes which best fit to your trader behavior/need... Valid for Scalping and Long Term operations. Please, set up a Bars Chart to be able to visualize the indicator properly...  ...And remind to give
COG LR Osc AM
Andriy Matviyevs'kyy
The presented indicator allows you to determine potential entry points into the market and set protective orders at reasonable levels. This product can be useful for both beginners and experienced traders. The indicator is based on calculation methods proven by time and practicing traders. The indicator is calculated in two stages: At the first stage, linear regression (LR) of the selected price type is determined for a given number of chart periods. At the second stage, the obtained data is p
FiboRec
Alfred Kamal
This indicator depends on Fibonacci lines but there is a secret lines i used them, by using FiboRec indicator you will be able to know a lot of important information in the market such as: Features You can avoid entry during market turbulence. You can enter orders in general trend only. You will know if the trend is strong or weak. Signal Types and Frame used You can use this indicator just on H1 frame. Enter buy order in case Candle break out the square area and closed over it, at least 20
Strong Retracement Points Pro demo edition! SRP (Strong Retracement/Reversal Points) is a powerful and unique support and resistance indicator. It displays the closest important levels which we expect the price retracement/reversal! If all level are broken from one side, it recalculates and draws new support and resistance levels, so the levels might be valid for several days depending on the market! If you are still hesitating to start using this wonderful tool, you can check this link to see h
BPSPanel
Remi Passanello
BPS Panel Breakout Pro Scalper Solution Panel This indicator is part of the   RPTrade Pro Solutions  systems. BPS Panel   is a daily trend indicator using Price Action, Dynamic Support and Resistances. It's designed to be used by anyone, even the absolute beginner in trading can use it. NEVER repaints . Indications are given   from close to close . Designed to   be used alone , no other indicators are required. Gives you the trend and potential Take Profit at the beginning of the day. How
WanaScalper MT4
Isaac Wanasolo
1 (1)
A scalping indicator based on mathematical patterns, which on average gives signals with relatively small SL, and also occasionally helps to catch big moves in the markets (more information in the video) This indicator has three main types of notifications: The first type warns of a possible/upcoming signal on the next bar The second type indicates the presence of a ready signal to enter the market/open a position The third type is for SL and TP levels - you will be notified every time price r
Atomic Analyst
Issam Kassas
5 (3)
우선적으로 언급할 점은이 거래 지표가 다시 그리지 않고 지연되지 않으며 이를 통해 수동 및 로봇 거래 모두에 이상적이라는 점입니다. 사용자 매뉴얼: 설정, 입력 및 전략. Atomic Analyst는 가격의 강도와 모멘텀을 활용하여 시장에서 더 나은 이점을 찾는 PA Price Action Indicator입니다. 고급 필터를 장착하여 잡음과 거짓 신호를 제거하고 거래 잠재력을 높이는 데 도움이 됩니다. 복잡한 지표의 다중 레이어를 사용하여 Atomic Analyst는 차트를 스캔하고 복잡한 수학적 계산을 간단한 신호와 색상으로 변환하여 초보 트레이더가 이해하고 일관된 거래 결정을 내릴 수 있도록합니다. "Atomic Analyst"는 새로운 및 경험이 풍부한 트레이더를위한 종합적인 거래 솔루션입니다. 프리미엄 지표와 최고 수준의 기능을 하나의 거래 전략에 결합하여 모든 종류의 트레이더에 대한 다재다능한 선택지가되었습니다. 인트라데이 거래 및 스캘핑 전략 : 빠르고 정확한
Laser Trend
Nicolas Zouein
The trend is your friend! This is what this indicator is all about. Follow this famous saying and be safe. Characteristics: Buy/Sell signals fixed on the close of a bar. Works on all symbols and all timeframes. Clear visual market trend laser line, Buy/Sell signal arrows, market strength meter, TP1 & TP2 boxes. Visual signals when to enter, when to exit the market. No repainting. Compatible with Flexible EA for trading automation. (Ask for a free set file optimized to perform 2010-2018) Para
VR Cub
Vladimir Pastushak
VR Cub 은 고품질 진입점을 얻는 지표입니다. 이 지표는 수학적 계산을 용이하게 하고 포지션 진입점 검색을 단순화하기 위해 개발되었습니다. 지표가 작성된 거래 전략은 수년 동안 그 효율성을 입증해 왔습니다. 거래 전략의 단순성은 초보 거래자라도 성공적으로 거래할 수 있다는 큰 장점입니다. VR Cub은 포지션 개시 지점과 이익 실현 및 손절매 목표 수준을 계산하여 효율성과 사용 편의성을 크게 높입니다. 간단한 거래 규칙을 이해하려면 아래 전략을 사용한 거래 스크린샷을 살펴보세요. 설정, 세트 파일, 데모 버전, 지침, 문제 해결 등은 다음에서 얻을 수 있습니다. [블로그] 다음에서 리뷰를 읽거나 작성할 수 있습니다. [링크] 버전 [MetaTrader 5] 진입점 계산 규칙 포지션 개설 진입점을 계산하려면 VR Cub 도구를 마지막 최고점에서 마지막 최저점까지 늘려야 합니다. 첫 번째 지점이 두 번째 지점보다 빠른 경우, 거래자는 막대가 중간선 위에서 마감될 때까지 기다립
Indicator. "Indicator wave or Indicator Ma". Using 23 standard indicators and the author's algorithm, the levels of purchases (from 0 to +100) and sales (from 0 to -100) are calculated. Then, using the calculated levels, the "Wave Indicator" draws a wave with 21 moving averages. The wave number is equal to the averaging period of the calculated levels. Waves # 1 - 7 Fast Moving Averages Waves from No. 8 -14 moving averages Waves from No. 15-21 slow moving averages Looking at the figu
This is a new strategy for SUPPLY DEMAND areas It is based on a calculation using the tick volume to detect the big price action in market for both bear /bull actions this smart volume action candles are used to determine the supply and demand areas prices in between main supply and demand lines indicate sideway market  up arrows will be shown when prices moves above the main supply and the secondary supply lines Down arrows will be shown when prices moves below the main demand and the secondary
The indicator detects and displays Shark harmonic pattern (see the screenshot). The pattern is plotted by the extreme values of the ZigZag indicator (included in the resources, no need to install). After detecting the pattern, the indicator notifies of that by a pop-up window, a mobile notification and an email. The indicator highlights the process of the pattern formation and not just the complete pattern. In the former case, it is displayed in the contour triangles. After the pattern is comple
RTSPattern
Tomas Belak
The indicator provides a superior alternative to price action analysis. It enables the identification of normalized patterns, which are then transformed into a graphical representation to forecast future steps within a time series. In the top-left corner, you'll find information regarding the expected prediction accuracy, determined through a complex MSQE calculation. You have the flexibility to adjust the time window, making it easy to validate the indicator's performance. Additionally, you can
Trendiness Index
Libertas LLC
5 (3)
"The trend is your friend" is one of the best known sayings in investing, because capturing large trendy price movements can be extremely profitable. However, trading with the trend is often easier said than done, because many indicators are based on price reversals not trends. These aren't very effective at identifying trendy periods, or predicting whether trends will continue. We developed the Trendiness Index to help address this problem by indicating the strength and direction of price trend
Owl smart levels
Sergey Ermolov
4.63 (54)
MT5 버전  |   FAQ Owl Smart Levels Indicator 는   Bill Williams 의 고급 프랙탈, 시장의 올바른 파동 구조를 구축하는 Valable ZigZag, 정확한 진입 수준을 표시하는 피보나치 수준과 같은 인기 있는 시장 분석 도구를 포함하는 하나의 지표 내에서 완전한 거래 시스템입니다. 시장과 이익을 취하는 장소로. 전략에 대한 자세한 설명 표시기 작업에 대한 지침 고문-거래 올빼미 도우미의 조수 개인 사용자 채팅 ->구입 후 나에게 쓰기,나는 개인 채팅에 당신을 추가하고 거기에 모든 보너스를 다운로드 할 수 있습니다 힘은 단순함에 있습니다! Owl Smart Levels   거래 시스템은 사용하기 매우 쉽기 때문에 전문가와 이제 막 시장을 연구하고 스스로 거래 전략을 선택하기 시작한 사람들 모두에게 적합합니다. 전략 및 지표에는 눈에 보이지 않는 비밀 공식 및 계산 방법이 없으며 모든 전략 지표는 공개되어 있습니다. Owl Smart Lev
Black series MT4
Dmitriy Kashevich
1 (1)
Black series MT4 - The indicator is designed for trading on binary options with Timeframe M1-M5-M15 Multicurrency (Works on cryptocurrency and currency pairs) The signal appears when the candle opens Up to 90% correct signals There is no signal redrawing at all Can be used with other indicators. Good for scalping! In Settings there is: -Indicator working methods -I Allert Arrow color Red signal down Blue signal up Also watch the video how the indicator works and signals
The Th3Eng PipFinite indicator is based on a very excellent analysis of the right trend direction with perfect custom algorithms. It show the true direction and the best point to start trading. With StopLoss point and Three Take Profit points. Also it show the right pivot of the price and small points to order to replace the dynamic support and resistance channel, Which surrounds the price. And Finally it draws a very helpful Box on the left side on the chart includes (take profits and Stop loss
Fractal Zig Zag
Mikhail Nazarenko
5 (1)
A   professional version of the ZigZag indicator for visualizing the structure of price movements by fractals. Fractal ZigZag fixes the flaws of the standard version of the ZigZag indicator MT4. It uses Price action and a unique filtering algorithm to determine fractals. Suitable for all types of trading. Ideal for trading according to the WM pattern "Sniper" strategy !!! Features Marks the place of price reversal during the formation of a new fractal with specified parameters. Suitable for
이 인디케이터는 수동 및 자동 방법으로 차트에 그려진 조화 패턴을 감지합니다. 사용 후기를 추가하십시오. 참고 사항: 이 인디케이터에는 제어 패널이 있으며 모든 (차트 및 시간대) 설정을 저장합니다. 더 많은 공간을 확보하려면 최소화할 수 있으며 다른 분석 도구와 함께 작업하려면 모든 인디케이터 데이터를 숨기려면 닫기 버튼을 누를 수 있습니다. 이 인디케이터를 사용하고 설정을 변경하면 이동평균이나 볼린저 밴드와 같은 인디케이터를 추가할 때 편집 내용의 템플릿을 자동으로 저장하고 필요할 때 언제든지 로드할 수 있습니다. Windows 10을 사용하는 경우 MetaTrader 아이콘을 마우스 오른쪽 단추로 클릭한 다음 호환성 > 고DPI 설정 변경 > 시스템(개선)을 선택하여 최상의 화면 설정을 사용할 수 있습니다(HD 기기에서 수행되어야 함). 이 인디케이터는 본질적으로 차트에서 조화 거래 이론을 해석하는 것으로 조화 패턴을 감지합니다. 배우고 싶다면 Scott Carney의 "Har
PZ 123 Pattern
PZ TRADING SLU
3.75 (4)
The 123 Pattern is one of the most popular, powerful and flexible chart patterns. The pattern is made up of three price points: a bottom, a peak or valley, and a Fibonacci retracement between 38.2% and 71.8%. A pattern is considered valid when the price breaks beyond the last peak or valley, moment at which the indicator plots an arrow, rises an alert, and the trade can be placed. [ Installation Guide | Update Guide | Troubleshooting | FAQ | All Products ] Clear trading signals Customizable c
Trend Scanner
Vladimir Kalendzhyan
4.38 (8)
By purchasing this indicator, you have the right to receive a free copy of one of   my other indicator's or advisor’s!  (All future updates are included. No limits) . To get it , please contact me by  mql5 message ! The Trend Scanner trend line indicator displays the trend direction and its changes. The indicator works on all currency pairs and  timeframes. The indicator simultaneously displays multiple readings on the price chart: the support and resistance lines of the currency pair, the exist
This indicator is another variant of the famous powerful indicator Fibonacci-SS https://www.mql5.com/en/market/product/10136 but has different behaviour in placing Pending Order and TP Line. Automatically places Fibonacci retracement lines from the last highest and lowest visible bars on the chart with: An auto Pending Order (Buy/Sell). Taking Profit 1, Taking Profit 2 is pivot point and Taking Profit 3 for extended reward opportunity. The best risk and reward ratio. Simple and powerful indica
RenkoMaStoch
Sergey Deev
1 (1)
The indicator displays renko bars on a chart, uses them to plot the fast and slow moving average and Stochastic, as well as it provides buy/sell signals: a buy signal is generated when the fast moving is above the slow one, and the signal line of Stochastic crosses the lower level from bottom up; a sell signal is generated when the fast moving is below the slow one, and the signal line of Stochastic crosses the upper level from top to bottom; Renko is a non-trivial price display method. Instead
Before
Nadiya Mirosh
The Before indicator predicts the most likely short-term price movement based on complex mathematical calculations. Most of the standard indicators commonly used in trading strategies are based on fairly simple calculations. This does not mean that there were no outstanding mathematicians in the world at the time of their creation. It is just that computers did not yet exist in those days, or their power was not enough for the sequential implementation of complex mathematical operations. Nowa
이 제품의 구매자들이 또한 구매함
Scalper Inside PRO
Alexey Minkov
4.74 (58)
An exclusive indicator that utilizes an innovative algorithm to swiftly and accurately determine the market trend. The indicator automatically calculates opening, closing, and profit levels, providing detailed trading statistics. With these features, you can choose the most appropriate trading instrument for the current market conditions. Additionally, you can easily integrate your own arrow indicators into Scalper Inside Pro to quickly evaluate their statistics and profitability. Scalper Inside
현재 20% 할인 ! 초보자 또는 전문가 트레이더를 위한 최고의 솔루션! 이 대시보드 소프트웨어는 28개의 통화 쌍에서 작동합니다. 2가지 주요 지표(Advanced Currency Strength 28 및 Advanced Currency Impulse)를 기반으로 합니다. 전체 Forex 시장에 대한 훌륭한 개요를 제공합니다. 고급 통화 강도 값, 통화 이동 속도 및 모든(9) 시간대의 28 Forex 쌍에 대한 신호를 보여줍니다. 추세 및/또는 스캘핑 기회를 정확히 파악하기 위해 차트의 단일 지표를 사용하여 전체 시장을 볼 수 있을 때 거래가 어떻게 개선될지 상상해 보십시오! 잠재적인 거래를 식별하고 확인하면서 강력한 통화와 약한 통화를 더욱 쉽게 식별할 수 있도록 이 지표에 기능을 내장했습니다. 이 표시기는 통화의 강세 또는 약세가 증가 또는 감소하는지 여부와 모든 시간대에서 수행되는 방식을 그래픽으로 보여줍니다. 추가된 새로운 기능은 현재 시장 조건 변화에 적
TPSproTREND PrO
Roman Podpora
4.78 (18)
TPSpro TRENDPRO  - is a trend indicator that automatically analyzes the market and provides information about the trend and each of its changes, as well as giving signals for entering trades without redrawing! The indicator uses each candle, analyzing them separately. referring to different impulses - up or down impulse. Exact entry points into transactions for currencies, crypto, metals, stocks, indices!  -  Version MT5               DETAILED DESCRIPTION                R ecommended to use with
TPSpro RFI Levels
Roman Podpora
4.83 (18)
Reversal First Impulse levels (RFI)    INSTRUCTIONS        RUS       -       ENG              R ecommended to use with an indicator   -   TREND PRO -  Version MT5 A key element in trading is zones or levels from which decisions to buy or sell a trading instrument are made. Despite attempts by major players to conceal their presence in the market, they inevitably leave traces. Our task was to learn how to identify these traces and interpret them correctly. Main functions: Displaying active zones
Volatility Trend System - a trading system that gives signals for entries. The volatility system gives linear and point signals in the direction of the trend, as well as signals to exit it, without redrawing and delays. The trend indicator monitors the direction of the medium-term trend, shows the direction and its change. The signal indicator is based on changes in volatility and shows market entries. The indicator is equipped with several types of alerts. Can be applied to various trading
NAM Order Blocks
NAM TECH GROUP, CORP.
5 (1)
MT4 Multi-timeframe Order Blocks detection indicator. Features - Fully customizable on chart control panel, provides complete interaction. - Hide and show control panel wherever you want. - Detect OBs on multiple timeframes. - Select OBs quantity to display. - Different OBs user interface. - Different filters on OBs. - OB proximity alert. - ADR High and Low lines. - Notification service (Screen alerts | Push notifications). Summary Order block is a market behavior that indicates order collection
FX Volume
Daniel Stein
4.6 (35)
모닝 브리핑을 통해 세부 정보와 스크린샷으로 매일 시장 업데이트를 받으세요 여기 mql5 및 텔레그램에서 FX 거래량은 브로커의 관점에서 시장 심리에 대한 실제 통찰력을 제공하는 최초이자 유일한 거래량 지표입니다. 브로커와 같은 기관 시장 참여자가 외환 시장에서 어떤 포지션을 취하고 있는지에 대한 훌륭한 통찰력을 COT 보고서보다 훨씬 빠르게 제공합니다. 차트에서 이 정보를 직접 확인하는 것은 트레이딩의 진정한 판도를 바꾸고 획기적인 솔루션입니다. 다음과 같은 고유한 시장 데이터 인사이트의 이점 비율 는 통화의 매수/매도 포지션 비율을 백분율로 표시 비율 변화 는 선택한 기간 내 매수 비율과 비율 변화를 표시 총 거래량 는 해당 통화의 총 거래량(롱 및 숏)을 로트 단위로 보여줍니다 Volumes Long 는 해당 통화의 모든 롱 포지션의 거래량을 보여줍니다 Volumes Short 는 해당 통화의 모든 숏 포지션의 거래량을 보여줍니다 Net Long 는 순 롱 포지션의 거래량
FX Power MT4 NG
Daniel Stein
5 (10)
모닝 브리핑 여기 mql5 와 텔레그램에서 FX Power MT4 NG 는 오랫동안 인기 있는 통화 강도 측정기인 FX Power의 차세대 버전입니다. 이 차세대 강도 측정기는 무엇을 제공합니까? 기존 FX Power에서 좋아했던 모든 것 PLUS GOLD/XAU 강도 분석 더욱 정밀한 계산 결과 개별 구성 가능한 분석 기간 더 나은 성능을 위한 사용자 정의 가능한 계산 한도 특별 멀티더 많은 것을보고 싶은 사람들을위한 특별한 다중 인스턴스 설정 모든 차트에서 좋아하는 색상을위한 끝없는 그래픽 설정 수많은 알림 옵션, 중요한 것을 다시는 놓치지 않도록 Windows 11 및 macOS 스타일의 둥근 모서리가 있는 새로운 디자인 마법처럼 움직이는 인디케이터 패널 FX 파워 키 특징 모든 주요 통화의 완전한 강세 이력 모든 시간대에 걸친 통화 강세 이력 모든 브로커 및 차트에서 고유 계산 결과 100% 신뢰할 수있는 실시간100 % 신뢰할 수있는 실시간 계산-> 다시 칠하지 않음
TrendMaestro
Stefano Frisetti
5 (3)
note: this indicator is for METATRADER4, if you want the version for METATRADER5 this is the link:  https://www.mql5.com/it/market/product/108106 TRENDMAESTRO ver 2.4 TRENDMAESTRO recognizes a new TREND in the bud, he never makes mistakes. The certainty of identifying a new TREND is priceless. DESCRIPTION TRENDMAESTRO identifies a new TREND in the bud, this indicator examines the volatility, volumes and momentum to identify the moment in which there is an explosion of one or more of these data a
Basic Harmonic Patterns Dashboard
Mehran Sepah Mansoor
5 (2)
이 대시보드는 선택한 심볼에 대해 사용 가능한 최신 고조파 패턴을 표시하므로 시간을 절약하고 더 효율적으로 사용할 수 있습니다 / MT5 버전 . 무료 인디케이터: Basic Harmonic Pattern 인디케이터 열 Symbol : 선택한 심볼이 나타납니다 Trend : 강세 또는 약세 Pattern : 패턴 유형(가틀리, 나비, 박쥐, 게, 상어, 사이퍼 또는 ABCD) Entry : 진입 가격 SL: 스톱로스 가격 TP1: 1차 테이크프로핏 가격 TP2: 2차 테이크프로핏 가격 TP3: 3차 테이크프로핏 가격 Current price: 현재 가격 Age (in bars): 마지막으로 그려진 패턴의 나이 주요 입력 Symbols : "28개 주요 통화쌍" 또는 "선택한 심볼" 중에서 선택합니다. Selected Symbols : 쉼표로 구분하여 모니터링하려는 원하는 심볼("EURUSD,GBPUSD,XAUUSD")을 선택합니다. 브로커에 쌍에 접미사 또는 접두사가
Up down v6T
Guner Koca
5 (1)
Thise indicator is up down v6  comes with tradingwiev pinescript. purchased people, after installed on terminal ,contact me on mql5  to get BONUS  TradingView pinescript. up-down indicator is no repaint and works all pairs and lower than weekly time frames charts. it is suitable also 1 m charts for all pairs. and hold long way to signal. dont gives too many signals. when red histogram cross trigger line that is up signal.and price probably will down when blue histogram cross trigger line that
MTF Supply Demand Zones
Georgios Kalomoiropoulos
4.83 (23)
자동화된 수요 및 공급 구역의 차세대. 모든 차트에서 작동하는 새롭고 혁신적인 알고리즘. 모든 구역은 시장의 가격 움직임에 따라 동적으로 생성됩니다. 두 가지 유형의 경고 --> 1)가격이 영역에 도달할 때 2)새로운 영역이 형성될 때 당신은 더 이상 쓸모없는 지표를 얻을 수 없습니다. 입증된 결과로 완벽한 거래 전략을 얻을 수 있습니다.     새로운 기능:     가격이 공급/수요 영역에 도달하면 경고     새로운 공급/수요 구역이 생성되면 알림     푸시 알림 알림     핍의 영역 너비 레이블     기동특무부대에 한 번 더 시간이 주어집니다. 따라서 현재보다 위의 2개의 시간 프레임 대신 현재보다 높은 3개의 시간 프레임을 볼 수 있습니다.     Alerts/Zones/MTF 기능을 활성화/비활성화하는 버튼 당신이 얻는 이점:     거래에서 감정을 제거하십시오.     거래 항목을 객
Quantum Heiken Ashi PRO MT4
Bogdan Ion Puscasu
4.43 (7)
소개       Quantum Heiken Ashi PRO   차트 시장 동향에 대한 명확한 통찰력을 제공하도록 설계된 Heiken Ashi 양초는 노이즈를 필터링하고 잘못된 신호를 제거하는 기능으로 유명합니다. 혼란스러운 가격 변동에 작별을 고하고 더 매끄럽고 신뢰할 수 있는 차트 표현을 만나보세요. Quantum Heiken Ashi PRO를 정말 독특하게 만드는 것은 전통적인 촛대 데이터를 읽기 쉬운 색상 막대로 변환하는 혁신적인 공식입니다. 빨간색과 녹색 막대는 각각 약세와 강세 추세를 우아하게 강조하여 잠재적 진입점과 퇴장점을 매우 정확하게 파악할 수 있습니다. Quantum EA 채널:       여기를 클릭하세요 MT5 버전:       여기를 클릭하세요 이 놀라운 지표는 다음과 같은 몇 가지 주요 이점을 제공합니다. 선명도 향상: Heiken Ashi 바는 가격 변동을 완화하여 시장 추세를 보다 명확하게 나타내므로 유리한 거래 기회를 쉽게 식별할 수 있
Indicator : RealValueIndicator Description : RealValueIndicator is a powerful tool designed specifically for trading on the EURUSD pair. This indicator analyzes all EUR and USD pairs, calculates their real currency strength values, and displays them as a single realistic value to give you a head start on price. This indicator will tell you moves before they happen if you use it right. RealValueIndicator allows you to get a quick and accurate overview of the EURUSD currency pair tops and bottoms,
All in One Trade
Alexey Minkov
4.48 (27)
The All-in-One Trade Indicator (AOTI) determines daily targets for EURUSD, EURJPY, GBPUSD, USDCHF, EURGBP, EURCAD, EURAUD, AUDJPY, GBPAUD, GBPCAD, GBPCHF, GBPJPY, AUDUSD, and USDJPY. All other modules work with any trading instruments. The indicator includes various features, such as Double Channel trend direction, Price channel, MA Bands, Fibo levels, Climax Bar detection, and others. The AOTI indicator is based on several trading strategies, and created to simplify market analysis. All-in-One
Black dragon indicator
Ramil Minniakhmetov
4.88 (130)
추세 감지 표시기는 모든 전략을 보완하며 독립적인 도구로도 사용할 수 있습니다. 표시기 작업에 대한 권장 사항은 댓글 #8 에서 다운로드할 수 있습니다. 장점 사용하기 쉽고 불필요한 정보로 차트에 과부하가 걸리지 않습니다. 모든 전략에 대한 필터로 사용할 수 있습니다. 기본 제공 수준의 동적 지원 및 저항이 있어 이익을 얻고 손절매를 설정하는 데 모두 사용할 수 있습니다. 촛대가 닫힌 후에도 표시기는 색상을 변경하지 않습니다.  주식 시장, 지수, 석유, 금 및 모든 시간대에서 작동합니다. 토스트 알림, 이메일 알림, 푸시 알림 및 소리 알림 기능이 있습니다. 내 다른 개발은 여기에서 찾을 수 있습니다: https://www.mql5.com/ko/users/mechanic/seller 입력 매개변수 Alert - 켜기/끄기. 알리다; Push Notification - 켜기/끄기. 푸시 알림; Mail - 켜기/끄기 이메일 알림; Fibo 1,2,3,4,5,6,7,11,
GOLD Impulse with Alert
Bernhard Schweigert
4.56 (9)
이 지표는 Advanced Currency IMPULSE with ALERT  +   Currency Strength Exotics  의 2가지 제품의 슈퍼 조합입니다. 그것은 모든 시간 프레임에 대해 작동하며 8개의 주요 통화와 하나의 기호에 대한 강약의 충동을 그래픽으로 보여줍니다! 이 표시기는 금, 이국적인 쌍, 상품, 지수 또는 선물과 같은 기호에 대한 통화 강도 가속을 표시하는 데 특화되어 있습니다. 금, 은, 오일, DAX, US30, MXN, TRY, CNH 등의 진정한 통화 강도 가속(충동 또는 속도)을 표시하기 위해 9번째 줄에 모든 기호를 추가할 수 있습니다. 새로운 기본 알고리즘을 기반으로 구축되어 잠재적인 거래를 훨씬 더 쉽게 식별하고 확인할 수 있습니다. 이는 통화의 강세 또는 약세가 가속되는지 여부를 그래픽으로 표시하고 가속 속도를 측정하기 때문입니다. 자동차의 속도계처럼 생각하면 됩니다. 가속화할 때 Forex 시장에서 동일한 일이 분명히
Quantum Trend Sniper Indicator MT4
Bogdan Ion Puscasu
4.6 (40)
소개       Quantum Trend Sniper Indicator는   추세 반전을 식별하고 거래하는 방식을 변화시키는 획기적인 MQL5 지표입니다! 13년 이상의 거래 경험을 가진 숙련된 트레이더 팀이 개발한       Quantum Trend Sniper 표시기       매우 높은 정확도로 추세 반전을 식별하는 혁신적인 방법으로 거래 여정을 새로운 차원으로 끌어올리도록 설계되었습니다. ***Quantum Trend Sniper Indicator를 구입하면 Quantum Breakout Indicator를 무료로 받을 수 있습니다!*** Quantum Trend Sniper Indicator는 추세 반전을 식별하고 세 가지 이익실현 수준을 제안할 때 경고, 신호 화살표를 제공합니다. 초보자 거래자와 전문 거래자 모두에게 적합합니다. Quantum EA 채널:       여기를 클릭하세요 MT5 버전:       여기를 클릭하세요
PZ Trend Trading
PZ TRADING SLU
4.75 (4)
Trend Trading is an indicator designed to profit as much as possible from trends taking place in the market, by timing pullbacks and breakouts. It finds trading opportunities by analyzing what the price is doing during established trends. [ Installation Guide | Update Guide | Troubleshooting | FAQ | All Products ] Trade financial markets with confidence and efficiency Profit from established trends without getting whipsawed Recognize profitable pullbacks, breakouts and early reversals The ind
Enigmera
Ivan Stefanov
5 (2)
에니메라: 시장의 핵심 https://www.enigmera.com 소개 이 지표 및 트레이딩 시스템은 금융 시장에 대한 놀라운 접근 방식입니다. 에니메라는 프랙탈 주기를 사용하여 지지선과 저항선을 정확하게 계산합니다. 진정한 축적 단계를 보여주고 방향과 목표를 제시합니다.  추세에 있든 조정에 있든 작동하는 시스템입니다.  어떻게 작동하나요? 에니메라는 지지선/저항선, 목표선, 편차선의 세 가지 라인으로 구성됩니다. 이 시스템은 과거 데이터를 현재와 미래로 추정하는 일반적인 시장 지표와 달리 현재에 대한 완전한 그림을 제공합니다. 지지선 위에 있으면 실제 지지를 의미하고 저항선 위에 있으면 실제 저항을 의미합니다. 레벨이 깨지면 추세의 변화를 나타냅니다. 다시 그리지 않습니다. 시장이 지속적으로 진화함에 따라 에니메라는 평가 도구를 조정하여 전략을 정기적으로 수정합니다.   이를 통해 모든 시나리오를 철저히 평가할 수 있습니다. 이 시장 지표의 고유성은 분명하며 그 기
Entry Points Pro
Yury Orlov
4.7 (226)
다시 색을 칠하지 않고 거래에 진입할 수 있는 정확한 신호를 제공하는 MT4용 지표입니다. 외환, 암호화폐, 금속, 주식, 지수 등 모든 금융 자산에 적용할 수 있습니다. 매우 정확한 추정값을 제공하고 매수와 매도의 가장 좋은 시점을 알려줍니다. 하나의 시그널로 수익을 내는 지표의 예와 함께 비디오 (6:22)시청하십시오! 대부분의 거래자는 Entry Points Pro 지표의 도움으로 첫 거래 주 동안 트레이딩 결과를 개선합니다. 저희의   Telegram Group 을 구독하세요! Entry Points Pro 지표의 좋은점. 재도색이 없는 진입 신호 신호가 나타나고 확인되면(시그널 캔들이 완성된 경우) 신호는 더 이상 사라지지 않습니다. 여타 보조지표의 경우 신호를 표시한 다음 제거되기 때문에 큰 재정적 손실로 이어집니다. 오류 없는 거래 게시 알고리즘을 통해 트레이드(진입 또는 청산)를 할 이상적인 순간을 찾을 수 있으며, 이를 통해 이를 사용하는 모든 거래자의
Gann Swing Structure
Kirill Borovskii
5 (1)
This indicator is based on the mathematics of the great trader W.D. Ganna. With its help, you can easily find strong levels by analyzing swings to find the optimal entry point. The indicator works on all instruments and all timeframes. The indicator is fully manual and has control buttons. All you need to do is press the NEW button, a segment will appear, which you can place on any movement, swing or even 1 candle that you want to analyze. By placing the segment, press the OK button. A grid (th
Quantum Breakout Indicator PRO
Bogdan Ion Puscasu
4.96 (26)
소개       Quantum Breakout PRO   , 브레이크아웃 존 거래 방식을 변화시키는 획기적인 MQL5 지표! 13년 이상의 거래 경험을 가진 숙련된 트레이더 팀이 개발한   Quantum Breakout PRO는   혁신적이고 역동적인 브레이크아웃 영역 전략으로 거래 여정을 새로운 차원으로 끌어올리도록 설계되었습니다. Quantum Breakout Indicator는 5개의 이익 목표 영역이 있는 브레이크아웃 영역의 신호 화살표와 브레이크아웃 상자를 기반으로 한 손절 제안을 제공합니다. 초보자 거래자와 전문 거래자 모두에게 적합합니다. Quantum EA 채널:       여기를 클릭하세요 MT5 버전 :   여기를 클릭하세요 중요한! 구매 후 설치 매뉴얼을 받으려면 개인 메시지를 보내주십시오. 추천: 기간: M15 통화쌍: GBPJPY, EURJPY, USDJPY,NZDUSD, XAUUSD 계정 유형: 스프레드가 매우 낮은 ECN, Ra
Royal Wave Pro M4
Vahidreza Heidar Gholami
5 (3)
Royal Wave is a Trend-Power oscillator which has been programmed to locate and signal low-risk entry and exit zones. Its core algorithm statistically analyzes the market and generates trading signals for overbought, oversold and low volatile areas. By using a well-designed alerting system, this indicator makes it easier to make proper decisions regarding where to enter and where to exit trades. Features Trend-Power Algorithm Low risk Entry Zones and Exit Zones Predictions for Overbought and Over
ON Trade Optuma Astro
Abdullah Alrai
5 (4)
물론입니다. 아래는 제공해주신 텍스트의 한국어 번역입니다: MT4용 천문학 지표 소개: 귀하의 최상급 하늘 트레이딩 동반자 트레이딩 경험을 천체의 높이로 끌어올리기 준비가 되셨나요? MT4용 천문학 지표를 소개합니다. 이 혁신적인 도구는 복잡한 알고리즘의 힘을 활용하여 탁월한 천문학적 통찰과 정밀한 계산을 제공합니다. 정보의 우주를 손에 담다: 천문학적 데이터의 보물함을 드러내는 포괄적인 패널을 살펴보세요. 행성의 지오/헬리오센트릭 좌표, 태양/지구 거리, 크기, 길이, 별자리, 황도 좌표 및 적도 좌표, 심지어 수평 좌표 등 각각이 정밀하게 계산되고 아름답게 제시됩니다. 지표에 의해 생성된 수직선은 시간 값에 해당하여 트레이딩 여정에 우주적인 시각을 부여합니다. 행성 라인과 관계: 수정 가능한 스케일과 각도로 차트를 장식하는 행성 라인의 마법을 경험해보세요. 직관적인 컨트롤 패널을 통해 각 행성의 라인의 가시성을 손쉽게 전환할 수 있습니다. 쥰션이나 섹스타일, 사분각, 삼분각, 트
The indicator of a Professional Trader is an arrow indicator for predicting the direction of price movement. I have been working on this indicator since 2014. You can use this indicator as your main indicator, use its entry signals, and use it as your only indicator to find entry points. About the product: Recommended TF [H4-D1-W1]   . The indicator predicts the direction of the next candle. Fits a variety of tools; Flexibility in settings for different instruments and intervals through the
Shepherd Harmonic Pattern
Abdullah Alrai
4.68 (59)
이 지표는 수동 및 자동 방법으로 차트에 그려진 고조파 패턴을 감지합니다. 사용자 매뉴얼은 다음 링크에서 확인할 수 있습니다. 리뷰를 작성하고 문의하면 무료 버전으로 MT4에서 제품을 시도할 수 있습니다. Gartley 및 Nenstar 패턴을 감지하는 데 사용할 수 있습니다. https://www.mql5.com/en/market/product/30181 전체 MT4 버전을 구입하려면 다음에서 구입할 수 있습니다. https://www.mql5.com/en/market/product/15212 참고 사항 지표에는 제어 패널이 있으며 모든 (차트 및 시간대) 설정을 저장합니다. 차트에서 더 많은 공간을 확보하려면 최소화할 수 있으며, 다른 분석 도구로 작업하는 것이 선호되는 경우 모든 지표 데이터를 숨기려면 닫기 버튼을 누를 수 있습니다. 이 지표를 사용하고 설정을 변경하면 이동 평균 또는 볼린저 밴드와 같은 지표를 추가하면 자동으로 템플릿을 저장하고 필요할 때 언제든지 로드할 수
Volume by Price MT4
Brian Collard
4.71 (14)
The Volume by Price Indicator for MetaTrader 4 features Volume Profile and Market Profile TPO (Time Price Opportunity). Volume and TPO histogram bar and line charts. Volume Footprint charts. TPO letter and block marker collapsed and split structure charts. Session filtering and grouping. Static, dynamic and flexible range segmentation and compositing methods with relative and absolute visualizations. Graphical layering, positioning and styling options to suit the user's analytic and aesthetic n
Introduction to Fractal Pattern Scanner Fractal Indicator refers to the technical indicator that makes use of the fractal geometry found in the financial market. Fractal Pattern Scanner is the advanced Fractal Indicator that brings the latest trading technology after the extensive research and development work in the fractal geometry in the financial market. The most important feature in Fractal Pattern Scanner is the ability to measure the turning point probability as well as the trend probabi
ECM Channel MT4
Paulo Rocha
5 (1)
ECM Elite Channel is a volatility-based indicator, developed with a specific time algorithm, which consists of finding possible corrections in the market. This indicator shows two outer lines, an inner line (retracement line) and an arrow sign, where the channel theory is to help identify overbought and oversold conditions in the market. The market price will generally fall between the boundaries of the channel. If prices touch or move outside the channel, it's a trading opportunity. The
제작자의 제품 더 보기
Advanced Currency Strength28 Indicator
Bernhard Schweigert
4.91 (664)
현재 26% 할인 초보자 또는 전문가 트레이더를 위한 최고의 솔루션! 이 지표는 우리가 독점 기능과 새로운 공식을 통합했기 때문에 독특하고 고품질이며 저렴한 거래 도구입니다. 단 하나의 차트로 28 Forex 쌍의 통화 강도를 읽을 수 있습니다! 새로운 추세 또는 스캘핑 기회의 정확한 트리거 포인트를 정확히 찾아낼 수 있기 때문에 거래가 어떻게 개선될지 상상해 보십시오. 사용 설명서: 여기를 클릭  https://www.mql5.com/en/blogs/post/697384 그것이 첫 번째, 원본입니다! 쓸모없는 지망생 클론을 사지 마십시오. 더 스페셜  강력한 통화 모멘텀을 보여주는 하위 창의 화살표 GAP가 거래를 안내합니다! 기본 또는 호가 통화가 과매도/과매도 영역(외부 시장 피보나치 수준)에 있을 때 개별 차트의 기본 창에 경고 표시가 나타납니다. 통화 강도가 외부 범위에서 떨어질 때 풀백/반전 경고. 교차 패턴의 특별 경고 추세를 빠르게 볼 수 있는
현재 20% 할인 ! 초보자 또는 전문가 트레이더를 위한 최고의 솔루션! 이 대시보드 소프트웨어는 28개의 통화 쌍에서 작동합니다. 2가지 주요 지표(Advanced Currency Strength 28 및 Advanced Currency Impulse)를 기반으로 합니다. 전체 Forex 시장에 대한 훌륭한 개요를 제공합니다. 고급 통화 강도 값, 통화 이동 속도 및 모든(9) 시간대의 28 Forex 쌍에 대한 신호를 보여줍니다. 추세 및/또는 스캘핑 기회를 정확히 파악하기 위해 차트의 단일 지표를 사용하여 전체 시장을 볼 수 있을 때 거래가 어떻게 개선될지 상상해 보십시오! 잠재적인 거래를 식별하고 확인하면서 강력한 통화와 약한 통화를 더욱 쉽게 식별할 수 있도록 이 지표에 기능을 내장했습니다. 이 표시기는 통화의 강세 또는 약세가 증가 또는 감소하는지 여부와 모든 시간대에서 수행되는 방식을 그래픽으로 보여줍니다. 추가된 새로운 기능은 현재 시장 조건 변화에 적
Advanced Currency IMPULSE with ALERT
Bernhard Schweigert
4.91 (495)
현재 31% 할인!! 초보자 또는 전문가 트레이더를 위한 최고의 솔루션! 이 지표는 우리가 독점 기능과 비밀 공식을 통합했기 때문에 독특하고 고품질이며 저렴한 거래 도구입니다. 단 하나의 차트로 28개 통화 쌍 모두에 대한 경고를 제공합니다. 새로운 추세 또는 스캘핑 기회의 정확한 트리거 포인트를 정확히 찾아낼 수 있기 때문에 거래가 어떻게 개선될지 상상해 보십시오! 새로운 기본 알고리즘을 기반으로 구축되어 잠재적인 거래를 훨씬 더 쉽게 식별하고 확인할 수 있습니다. 이는 통화의 강세 또는 약세가 가속되는지 여부를 그래픽으로 표시하고 가속 속도를 측정하기 때문입니다. 자동차의 속도계처럼 생각하면 됩니다. 가속화할 때 Forex 시장에서 동일한 일이 분명히 더 빠르게 발생합니다. 즉, 반대 방향으로 가속화되는 통화를 페어링하면 잠재적으로 수익성 있는 거래를 식별한 것입니다. 통화 모멘텀의 수직선과 화살표가 거래를 안내합니다! 역동적인 Market Fibonacci 23
Advanced Supply Demand MT5
Bernhard Schweigert
4.53 (15)
현재 33% 할인! 초보자나 전문 트레이더를 위한 최고의 솔루션! 이 보조지표는 우리가 다수의 독창적 기능과 새로운 공식을 통합한 독특하고 고품질이며 저렴한 거래 도구입니다. 이 업데이트를 통해 이중 시간대를 표시할 수 있습니다. 더 높은 TF를 표시할 수 있을 뿐만 아니라 차트 TF와 더 높은 TF 모두를 표시할 수 있습니다: 중첩 영역 표시. 모든 Supply Demand 트레이더들이 좋아할 것입니다. :) 중요한 정보 공개 Advanced Supply Demand의 잠재력을 극대화하려면 다음을 방문하십시오. https://www.mql5.com/ko/blogs/post/720245   진입 또는 목표의 명확한 트리거 포인트를 정확히 찾아냄으로 해서 거래가 어떻게 개선될지 상상해 보십시오. 새로운 알고리즘을 기반으로 매수자와 매도자 간의 잠재적인 불균형을 훨씬 더 쉽게 분간할 수 있습니다. 왜냐하면 가장 강한 공급영역과 가장 강한 수요 영역과 과거에 어떻게 진행 되었는지를(이
GOLD Impulse with Alert
Bernhard Schweigert
4.56 (9)
이 지표는 Advanced Currency IMPULSE with ALERT  +   Currency Strength Exotics  의 2가지 제품의 슈퍼 조합입니다. 그것은 모든 시간 프레임에 대해 작동하며 8개의 주요 통화와 하나의 기호에 대한 강약의 충동을 그래픽으로 보여줍니다! 이 표시기는 금, 이국적인 쌍, 상품, 지수 또는 선물과 같은 기호에 대한 통화 강도 가속을 표시하는 데 특화되어 있습니다. 금, 은, 오일, DAX, US30, MXN, TRY, CNH 등의 진정한 통화 강도 가속(충동 또는 속도)을 표시하기 위해 9번째 줄에 모든 기호를 추가할 수 있습니다. 새로운 기본 알고리즘을 기반으로 구축되어 잠재적인 거래를 훨씬 더 쉽게 식별하고 확인할 수 있습니다. 이는 통화의 강세 또는 약세가 가속되는지 여부를 그래픽으로 표시하고 가속 속도를 측정하기 때문입니다. 자동차의 속도계처럼 생각하면 됩니다. 가속화할 때 Forex 시장에서 동일한 일이 분명히
Advanced Currency Strength28 MT5
Bernhard Schweigert
5 (1)
초보자 또는 전문가 트레이더를 위한 최고의 솔루션! 이 지표는 우리가 독점 기능과 새로운 공식을 통합했기 때문에 독특하고 고품질이며 저렴한 거래 도구입니다. 단 하나의 차트로 28 Forex 쌍의 통화 강도를 읽을 수 있습니다! 새로운 추세 또는 스캘핑 기회의 정확한 트리거 포인트를 정확히 찾아낼 수 있기 때문에 거래가 어떻게 개선될지 상상해 보십시오. 사용 설명서: 여기를 클릭  https://www.mql5.com/en/blogs/post/697384 그것이 첫 번째, 원본입니다! 쓸모없는 지망생 클론을 사지 마십시오. 더 스페셜  강력한 통화 모멘텀을 보여주는 하위 창의 화살표 GAP가 거래를 안내합니다! 기본 또는 호가 통화가 과매도/과매도 영역(외부 시장 피보나치 수준)에 있을 때 개별 차트의 기본 창에 경고 표시가 나타납니다. 통화 강도가 외부 범위에서 떨어질 때 풀백/반전 경고. 교차 패턴의 특별 경고 추세를 빠르게 볼 수 있는 다중 시간 프레임 선택
Currency Strength Exotics
Bernhard Schweigert
4.88 (33)
현재 20% 할인! 초보자 또는 전문가 트레이더를 위한 최고의 솔루션! 이 표시기는 Exotic Pairs Commodities, Indexes 또는 Futures와 같은 기호에 대한 통화 강도를 표시하는 데 특화되어 있습니다. 금, 은, 석유, DAX, US30, MXN, TRY, CNH 등의 진정한 통화 강도를 보여주기 위해 9번째 줄에 모든 기호를 추가할 수 있습니다. 이것은 독특하고 고품질이며 저렴한 거래 도구입니다. 우리는 많은 독점 기능과 새로운 공식을 통합했습니다. 새로운 추세 또는 스캘핑 기회의 정확한 트리거 포인트를 정확히 찾아낼 수 있기 때문에 거래가 어떻게 개선될지 상상해 보십시오. 사용 설명서: 여기를 클릭 https://www.mql5.com/en/blogs/post/708876 모든 시간대에 작동합니다. TREND를 빠르게 확인할 수 있습니다! 새로운 기본 알고리즘을 기반으로 설계되어 잠재적인 거래를 더욱 쉽게 식별하고 확인할 수 있습니다.
초보자 또는 전문가 트레이더를 위한 최고의 솔루션! 이 지표는 우리가 독점 기능과 비밀 공식을 통합했기 때문에 독특하고 고품질이며 저렴한 거래 도구입니다. 단 하나의 차트로 28개 통화 쌍 모두에 대한 경고를 제공합니다. 새로운 추세 또는 스캘핑 기회의 정확한 트리거 포인트를 정확히 찾아낼 수 있기 때문에 거래가 어떻게 개선될지 상상해 보십시오! 새로운 기본 알고리즘을 기반으로 구축되어 잠재적인 거래를 훨씬 더 쉽게 식별하고 확인할 수 있습니다. 이는 통화의 강세 또는 약세가 가속되는지 여부를 그래픽으로 표시하고 가속 속도를 측정하기 때문입니다. 자동차의 속도계처럼 생각하면 됩니다. 가속화할 때 Forex 시장에서 동일한 일이 분명히 더 빠르게 발생합니다. 즉, 반대 방향으로 가속화되는 통화를 페어링하면 잠재적으로 수익성 있는 거래를 식별한 것입니다. 통화 모멘텀의 수직선과 화살표가 거래를 안내합니다! 역동적인 Market Fibonacci 23 레벨은 경고 트리거로 사
Supply and Demand Dashboard PRO
Bernhard Schweigert
4.82 (22)
현재 20% 할인! 이 대시보드는 여러 기호와 최대 9개의 타임프레임에서 작동하는 매우 강력한 소프트웨어입니다. 주요 지표(최상의 리뷰: 고급 공급 수요)를 기반으로 합니다.   Advanced Supply Demand 대시보드는 훌륭한 개요를 제공합니다. 다음과 같이 표시됩니다.  영역 강도 등급을 포함하여 필터링된 공급 및 수요 값, 영역에 대한/및 영역 내 Pips 거리, 중첩된 영역을 강조 표시하고 모든 (9) 시간 프레임에서 선택한 기호에 대해 4가지 종류의 경고를 제공합니다. 그것은 당신의 개인적인 필요에 맞게 고도로 구성 가능합니다! 당신의 혜택! 모든 트레이더에게 가장 중요한 질문: 시장에 진입하기에 가장 좋은 수준은 무엇입니까? 최고의 성공 기회와 위험/보상을 얻으려면 강력한 공급/수요 영역 내 또는 그 근처에서 거래를 시작하십시오. 손절매를 위한 최적의 장소는 어디입니까? 가장 안전하려면 강력한 수요/공급 구역 아래/위에 정
Advanced Accumulated Currency Volume
Bernhard Schweigert
4.63 (51)
현재 20% 할인! 초보자 또는 전문가 상인을위한 최상의 솔루션! 이 지표는 새로운 공식과 함께 여러 독점적 인 기능을 통합했기 때문에 저렴한 거래 도구입니다. 고급 누적 통화 볼륨 표시기는 메인 28 외환 쌍에 특화되어 있으며 모든 시간 프레임에서 작동합니다. 단일 차트에서 AUD, CAD, CHF, EUR, GBP, JPY, NZD 및 USD의 모든 통화 볼륨 (C-Volume)을 추출하는 새로운 공식입니다. 이것은 거래에서 큰 이점입니다. 볼륨 트레이더는 사용 방법을 알게 될 것입니다. 당신이 새로운 경우, 극단적 인 값을 읽고 거래 무기고에 추가하는 방법을 배우십시오. C- 볼륨을 총이 아니라 방패로 생각하십시오. 기본 차트에 경고 표시가 표시됩니다. 이것은 일반적으로 사용되는 단순한 쌍의 부피가 아닙니다. 외환 시장은 스캔되며 각 통화에 대한 볼륨은 추출되어 C- 볼륨으로 축적됩니다. 이제 어떤 통화가 가장 높거나 가장 낮은 볼륨을 확인할 수 있습니다
My Trades in Pips
Bernhard Schweigert
4.71 (24)
놓치고 싶지 않은 거래 도구. 표시기는 차트의 모든 거래/거래에 첨부 된 기호로 표시됩니다. 이익 또는 손실의 핍 수를 인쇄합니다. 선택에 따라 더 나은 분석을 위해 하위 창을 통해 수직선을 인쇄합니다. 여기에서도 확인하십시오 : My Trade History Pro https://www.mql5.com/en/market/product/50206 또한 예금 통화의 거래 결과 및 총 PIP에 대한 정보를 추가합니다. 당신은 오늘의 거래 만 보여 주거나 여러 막대 내에서 거래 만 보여 주도록 선택할 수 있습니다. 지정된 마법 번호로 거래를 표시 할 수 있습니다. 값이 0으로 설정되면 표시기는 모든 거래를 표시합니다. 전문가 고문의 마법 수를 지정하면 EA의 거래 만 표시됩니다. 입구 오버 엔트리 화살표에는 주문 번호, 댓글 및 마법 번호가 표시됩니다. 이 표시기는 주로 통화 강도의 다른 특수 지표 중 하나와 함께 사용됩니다. https://www.mql5.com/en
FREE
My Trade History PRO
Bernhard Schweigert
5 (3)
현재 20% 할인 !! 초보자 또는 전문가 상인을위한 최상의 솔루션! 당신의 거래를 검토하는 것은 성공적인 거래자의 첫 번째 단계입니다. 성공적인 트레이더는 거래 성과를 정기적으로 검토하는 습관이 있습니다. 이 도구는 당신이 그렇게하는 데 도움이 될 것입니다. 검토 과정은이 도구에서 가장 효과적이며 거래를 추적합니다. 수동 거래 또는 EA의 거래를 분석하십시오. 3 가지 일반적인 견해를 사용하십시오. 버튼을 클릭하는 것만으로 전환하려면 폐쇄 거래 열린 거래 폐쇄 + 공개 거래 모든 거래는 각 기호에 대해 나열됩니다. 다른 기호로 이동하려면 기호 이름 버튼을 클릭하십시오. 새로 개설 및 마감 거래에 경고를 사용하십시오. 열린 거래를 보는 데 매우 유용합니다. EA, 신호 또는 수동으로 시작될 수 있습니다. 이익 또는 PIP의 결과를 전환하려면 버튼을 클릭하십시오. 이익 핍 그런 다음 3 분석 유형을 전환하십시오. 버튼을 클릭합니다.
현재 26% 할인!! 이 지표는 두 주요 지표( Advanced Currency Strength 28   &  Advanced Currency IMPULSE with ALERT )의 슈퍼 조합입니다. TICK-UNITS에 대한 통화 강도 값과 28개 Forex 쌍에 대한 경고 신호를 보여줍니다. 11개의 다른 틱 단위를 사용할 수 있습니다. 1, 2, 3, 4, 5, 6, 10, 12, 15, 20, 30초입니다. 두 번째 타이머 내에 최소 1틱이 있으면 하위 창의 Tick-Unit 막대가 표시되고 왼쪽으로 이동합니다. 단 하나의 차트로 28 Forex 페어를 스캘핑할 수 있습니다! 스캘핑 기회의 정확한 트리거 포인트를 정확히 찾아낼 수 있기 때문에 스캘핑이 어떻게 개선될지 상상해 보십시오. 그것은 1분보다 낮은 기간에 작동하는 시장의 첫 번째 통화 강도 지표입니다! 그것은 시장에 빠르게 들어오고 나가고 시장에서 작은 핍을 잘라내기를 원하는 빠른 스캘퍼를 위한 것입니다.
필터:
MILLION MONEY
24
MILLION MONEY 2024.06.11 12:40 
 

hi thanks for support and your indicator i am waiting for your gift for 1 indicator Strength currency and gold for MT4 if you give 1 month gift i will buy after test thanks

Darryl Brown
218
Darryl Brown 2024.05.26 16:48 
 

This indicator is the best on MQL5 in my opinion. The reason why I believe that is because when you can combine it with other indicators it will improve your trading. If you want accurate entries and exits this is the indicator for you. Bravo Bernhard.....Bravo.

Bernhard Schweigert
80870
개발자의 답변 Bernhard Schweigert 2024.05.29 12:50
I appreciate your feedback! I'm happy to know the indicator helps with accurate trading decisions. Thanks for the support! 💖
Ferrari888
593
Ferrari888 2024.04.10 23:15 
 

Отличная поддержка, Bernhard спасибо за хорошие индикаторы. Я являюсь постоянным клиентом. Все супер

Bernhard Schweigert
80870
개발자의 답변 Bernhard Schweigert 2024.04.27 12:23
Thank you for your loyal support and kind words! We truly appreciate having you as a valued member of our community over the years. 💖
egoli55
39
egoli55 2024.02.29 08:40 
 

After over 5 years of being an active MT4/MT5 user, this is arguably the most accurate Supply and demand indicator I have ever used. I just love it; and for the most part, price react at the levels printed by this wonderful indicator, especially when a higher and lower timeframe S/D lines insect. I wish I have been using it over the years. The author gave a very good illustrations and description of how to adjust the indicator for optimum settings.

Bernhard Schweigert
80870
개발자의 답변 Bernhard Schweigert 2024.03.07 11:57
We appreciate your review of our Supply and Demand indicator. It's gratifying to hear that after over 5 years of trading experience, you find it to be one of the most accurate indicators you've used. We're glad the illustrations and descriptions have aided in optimizing its settings. 💖 💖
Ravi Chandiran
533
Ravi Chandiran 2024.02.08 01:12 
 

Excellent Indicator in terms of Entry, Exit& Risk Avoidance!!!

Bernhard Schweigert
80870
개발자의 답변 Bernhard Schweigert 2024.02.20 13:45
Thank you for review 🙏💖
Baban_1970
20
Baban_1970 2024.01.08 21:47 
 

I just purchased the indicator, and so far so good

uvstockstrades
253
uvstockstrades 2024.01.05 12:27 
 

Saves Time. Helps a lot. Thanks and keep it up.

Bernhard Schweigert
80870
개발자의 답변 Bernhard Schweigert 2024.01.26 14:03
Thanks for the review! 👍
Harakty
293
Harakty 2023.12.21 10:50 
 

Simply the best S&D indicator in the market, it gets super powers when used as a fundamental part of the CS Strategy. Now it became pretty easy to spot where the price action is going to move when approaching a POI. Thanks Bernhard!

Bernhard Schweigert
80870
개발자의 답변 Bernhard Schweigert 2024.01.12 13:52
I'm glad that you're finding the S&D indicator to be a valuable tool in your trading arsenal, friend. Your success is my success. 💖
denisjohn
209
denisjohn 2023.12.18 22:04 
 

Hi, just an update on my experience with bernhards indicators. I started a couple of years ago with 3 of his indicators - CS28, Impulse and S & D with alerts. I had mixed results. This was probably due to inexperience and not studying the products enough. I then gave up for over a year. Came back and decided there was definitely something in this so I studied and tested it properly and my results have improved massively. So, great job Bernhard .

Bernhard Schweigert
80870
개발자의 답변 Bernhard Schweigert 2023.12.21 13:15
It's great to hear that thorough study and testing have led to a significant improvement in your trading results. 💖
JAMEEL ZAKI J ALFAQIH
554
JAMEEL ZAKI J ALFAQIH 2023.11.30 04:15 
 

Very bad

Bernhard Schweigert
80870
개발자의 답변 Bernhard Schweigert 2023.12.21 12:56
It was evident in our conversation that the issues in your trading were not related to the accuracy of the indicator but rather resulted from engaging in high-risk trading with elevated lots. Hundreds of traders have found great success with this product.
Malik Cole
23
Malik Cole 2023.11.01 01:31 
 

Great indicator made profit from it already. How do I scan all the pairs that are entering the support zones, and also how do I get the bonus?

Bernhard Schweigert
80870
개발자의 답변 Bernhard Schweigert 2023.11.14 13:41
I appreciate your positive feedback on the indicator and your profitable experience. I've sent you an email providing details on how to scan multiple pairs. Our dashboard is a powerful tool for scanning various pairs simultaneously. 👍
Duy Thanh Trinh
179
Duy Thanh Trinh 2023.09.30 16:02 
 

Hello i just buy the indicator. How can i get the bonus and set file . Thanhks

Bernhard Schweigert
80870
개발자의 답변 Bernhard Schweigert 2023.09.30 17:27
You're welcome, friend. I have sent you a personal message to your MQL5 inbox. Please take a moment to check it. Best regards, Bernhard www.CurrencyStrength28.com
Matthew Kotecki
227
Matthew Kotecki 2023.09.06 03:03 
 

indicator is very accurate, and saves me time when marking up my charts. has improved my trading immensely

Bernhard Schweigert
80870
개발자의 답변 Bernhard Schweigert 2023.09.06 20:00
We appreciate your feedback. It's great to hear that our indicator's accuracy and time-saving features have had a positive impact on your trading. 💖
Noboru Sato-
188
Noboru Sato- 2023.08.23 07:09 
 

色々と悩みましたが、こちらのインジケータは抵抗帯、しかも時間足を1つに集約してもらえるので、トレードするのが非常に助かります。スイングが多いので、1時間足に4時間足の抵抗帯が見えまた大抵は消えがちですが、過去に意識された(ブレイクした)抵抗も見えるので、振り返りにも役立ちます。

Bernhard Schweigert
80870
개발자의 답변 Bernhard Schweigert 2023.08.27 12:24
あなたのレビューと共有された洞察に感謝しています。需給ゾーンとタイムフレームを統合できる機能が、あなたの取引スタイルにとって画期的なものであることは明らかです。過去のブレイクアウトを識別し、十分な情報に基づいた意思決定ができることは、トレードを成功させるために不可欠です。 💖
We're grateful for your review and the insights you've shared. It's clear that the feature allowing you to bring together Supply and Demand zones and timeframes has been a game-changer for your trading style. Being able to identify past breakouts and make well-informed decisions is essential for successful trading.
Henry Manuel Chavez Hidalgo
59
Henry Manuel Chavez Hidalgo 2023.08.10 12:42 
 

Great indicator....I am learning how to adapt it to my trading plan.

muzzu-qureshi
57
muzzu-qureshi 2023.07.21 18:52 
 

Best indicator I love it just one thing is missing (buy and sell signals alert) It is a great way to enter, exit and put your stop losses. Once I got this indicator I was so impressed

Bernhard Schweigert
80870
개발자의 답변 Bernhard Schweigert 2023.07.23 11:07
Thank you for the great review! We're glad to hear that you love our indicator and find it helpful in your trading journey. It currently provides alerts for reverse candles and zone breaks, which can be used for entry buy and sell signals. Always check the signals on your chart for final trade execution. We appreciate your feedback, and we're continuously improving our indicator to meet your needs. Happy trading! 💖
Probability_Trader
71
Probability_Trader 2023.07.20 23:32 
 

Amazing indicator that is very helpful in finding imbalances in the market in order to trade in line with big banks.

[삭제] 2023.07.20 23:12 
 

사용자가 평가에 대한 코멘트를 남기지 않았습니다

Bernhard Schweigert
80870
개발자의 답변 Bernhard Schweigert 2023.07.20 23:37
You're welcome, friend.
I have sent you a personal message to your MQL5 inbox. Please take a moment to check it.
MarcoEA
138
MarcoEA 2023.06.09 23:11 
 

hello, I bought two of your indicators. Sup and Dem and Dashboard of Sup and Demand. What are the bonuses?

Bernhard Schweigert
80870
개발자의 답변 Bernhard Schweigert 2023.06.25 11:59
Thank you for purchasing our indictor. As a bonus, we invite you to join our exclusive community of traders by registering at www.CurrencyStrength28.com/forum In our forum, you'll have access to valuable resources and discussions on successful trading strategies. The best part? It's completely free for our clients. Don't miss out on this opportunity to enhance your trading skills and connect with like-minded traders. If you have any further questions or need assistance, feel free to reach out. Happy trading!
michelcrews
222
michelcrews 2023.06.02 00:52 
 

Very good trading system especially when used with Bernhard's other indicators.

Bernhard Schweigert
80870
개발자의 답변 Bernhard Schweigert 2023.06.08 10:55
Your feedback is much appreciated. I'm glad to hear that it has been a good trading system, especially when combined with my other indicators. 👍
리뷰 답변
버전 7.1 2024.05.21
Version 7.1 Update**

We are excited to announce the release of Version 7.2 of our Advanced Supply Demand Indicator! This update brings a suite of enhancements designed to further improve your trading experience and performance.

### What’s New in Version 7.1:
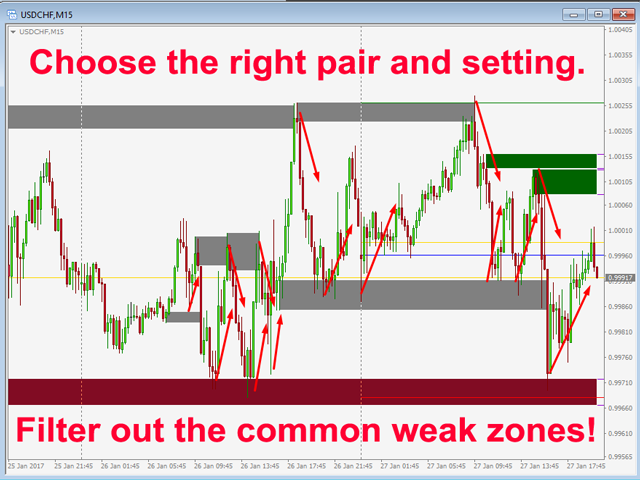
1. **Enhanced Algorithm Precision:** Our updated algorithm delivers even more accurate calculations, allowing for sharper and more reliable trading signals.
2. **Faster Data Processing:** Experience reduced lag and faster updates, ensuring you’re always working with the most current market information.

### Why Upgrade?
Maximize your trading potential with the latest features and improvements. Our Indicator continues to set the standard for accuracy and functionality in the market. Don’t miss out on these crucial updates—upgrade to Version 7.1 today and take your trading to the next level!

Upgrade now and join the ranks of successful traders who trust our leading-edge tools to achieve their financial goals. Your journey to more informed and profitable trading starts here.

Happy trading!
버전 7.0 2024.03.22
Our Supply and Demand Zone Indicator has earned its reputation as the top choice among traders for its unparalleled accuracy and comprehensive features. Don't miss out on the opportunity to elevate your trading strategy and maximize your profits. Update now and experience the difference firsthand.
버전 6.9 2024.01.22
Best rated Supply and Demand Zone Indicator in the Market.

Various improvements for new Metatrader version.

Please keep your indicators up to date. It's free.
버전 6.8 2023.12.20
**Upgrade Today and Trade with Confidence!**

Don't miss out on these game-changing improvements. Update your Advanced Supply Demand Indicator now and elevate your trading journey.
버전 6.7 2023.11.17
Best rated Supply and Demand Zone Indicator in the Market.

Various improvements for new Metatrader version.

Please keep your indicators up to date. It's free.
버전 6.6 2023.10.20
We've just released an exciting update for our indicator, packed with enhancements that take your trading to the next level.

Upgrading your indicator is a smart move. It ensures you're leveraging the latest features, giving you a competitive edge in the market. Don't miss out!

Should you have questions or need help with the update, our team is here for you. Reach out anytime; we're committed to your success.

www.CurrencyStrength28.com
버전 6.5 2023.09.23
Please update to Version 6.4

Best rated Supply and Demand Zone Indicator in the Market.

Various improvements for new Metatrader version.

Please keep your indicators up to date. It's free.
버전 6.4 2023.08.21
Upgrade to Version 6.4 for Enhanced Trading Insights

+ We're thrilled to introduce Version 6.4, featuring the industry's highest-rated Supply and Demand Zone Indicator. Elevate your trading strategy with this powerful tool, designed to help you identify critical price reversal areas.

+ In response to valuable feedback from traders like you, we've added a new feature – the "Price Label." Now, when you explore higher timeframe zones, this label serves as a helpful reminder, providing context for the purpose of each empty rectangle zone.

New input:
+ display MTF names left (default = true)

+ Don't miss out on these exciting updates. Keep your indicators up to date effortlessly and at no cost. By staying current with our latest version, you're ensuring that your trading arsenal remains at the cutting edge of the market.

+ Upgrade to Version 6.4 now and access the best-rated Supply and Demand Zone Indicator available. With the new Price Label feature, trading on higher timeframes becomes even more insightful. Join the community of savvy traders who are enhancing their strategies with our free, top-notch tools.
버전 6.3 2023.07.21
Please update to Version 6.3

Best rated Supply and Demand Zone Indicator in the Market.

Various improvements for new Metatrader version.

Please keep your indicators up to date. It's free.
버전 6.2 2023.06.21
We are thrilled to announce the highly anticipated release of Version 6.2 of our Advanced Supply Demand Indicator – the top-rated tool for traders like you. With its advanced capabilities, this powerful indicator will revolutionize your trading strategy by identifying critical price reversal areas, giving you a significant edge in the market.

Discover the latest enhancements we have made to ensure seamless compatibility with the newest Metatrader version. By upgrading to Version 6.2, not only do you gain access to cutting-edge features, but you also stay ahead of the competition. And the best part? These updates are completely free, so you can maximize your trading potential without any additional cost.

Upgrade now to Version 6.2 and experience firsthand the unparalleled benefits of our top-rated Supply and Demand Zone Indicator. Take control of your trading journey, make informed decisions, and elevate your profitability. Don't miss out on this opportunity to improve your trading strategy – all for free.
버전 6.1 2023.05.25
Various improvements.
Please update.
버전 6.0 2023.04.20
We're excited to announce the release of Version 6.0, featuring the best-rated Supply and Demand Zone Indicator on the market. This powerful tool helps you spot key areas of price reversal, giving you an edge in your trading strategy.

Our team has made various improvements to ensure compatibility with the latest Metatrader version, so you can take advantage of new features and stay ahead of the competition. Plus, keeping your indicators up to date is completely free and ensures that you're always using the most advanced tools available.

Upgrade now to Version 6.0 and experience the benefits of our best-rated Supply and Demand Zone Indicator. Stay ahead of the competition and improve your trading strategy with the latest updates, all for free.
버전 5.9 2023.03.22
Our indicator has been updated with more improvements. We made overall enhancements to its functionality.

We highly recommend that you update your indicator to take advantage of these improvements. This will ensure that you are using the latest version of our software and that you can benefit from the latest enhancements and features.

If you need assistance with the update process or have any questions, please do not hesitate to contact us. We are always here to help.
버전 5.8 2023.02.24
We are proud to announce that our Supply and Demand Zone Indicator continues to be the highest rated tool of its kind in the market. Our team has worked hard to develop and refine this powerful tool, and we believe it will help you identify profitable trading opportunities with greater accuracy.
With the recent release of the new Metatrader version, we have made various improvements to ensure that our software continues to integrate seamlessly with this popular trading platform. These changes include performance enhancements, so you can expect even smoother and more reliable performance from our indicators.
버전 5.7 2023.01.24
Please update to Version 5.7

Best rated Supply and Demand Zone Indicator in the Market.

Various improvements for new Metatrader version.

Please keep your indicators up to date. It's free.
버전 5.6 2022.12.22
Various improvements for new Metatrader version.
Please update.
버전 5.5 2022.11.21
Best rated Supply and Demand Zone Indicator in the Market.
Various improvements.
Please update.
버전 5.4 2022.10.21
Added more improvements.
Updating is recommended.
버전 5.3 2022.09.22
Added more improvements,
Updating is recommended.

버전 5.2 2022.08.20
More improvements.
Please update.
버전 5.1 2022.07.21
Best rated Supply and Demand Zone Indicator in the Market.
Various improvements.
Please update.
버전 5.0 2022.06.22
Various improvements for new Metatrader version.
버전 4.9 2022.05.18
A useful feature has been added at the request of a trader.
A trader can have only buy or sell preferences for an instrument. This selects the alarms that are chosen. The graph and alert when entering a zone are unaffected.

==== General Alert Settings ====
New input:
+ Traders preference alerts buy-sell-both

Please update.
버전 4.8 2022.04.20
Various improvements.
Please update.
버전 4.7 2022.03.20
Various improvements.
Please update.
버전 4.6 2022.02.18
Various improvements.
Please update.
버전 4.5 2022.01.17
Various improvements for new Metatrader version.
Please update.
버전 4.4 2021.12.17
Various improvements.
Please update.
버전 4.3 2021.11.18
More improvements.
A "Must" update.
Another bridge for EA import has been added.
버전 4.2 2021.10.11
Best rated Supply and Demand Zone Indicator in the Market.
Various improvements.
Please update.
버전 4.1 2021.08.23
Various improvements.
버전 4.0 2021.06.13
IMPORTANT UPDATE!
VERSION 4 !!!
버전 3.7 2021.05.09
Various improvements.
버전 3.6 2021.03.14
Best rated Supply and Demand Zone Indicator in the Market.
Various improvements for new Metatrader version.
버전 3.5 2020.10.20
MAJOR UPDATE 2020 SERIES 03
==================

The new update brings:
MODIFICATION FOR ZONE SIZE (optional)

Some traders of supply and demand zones asked for a new function. It was added optionally: Including a wick for the width of the supply and demand zones.

New input:
+ Include wick 1 for the zone size
By default, the function is not used. To use the function, you must set the new input = true (the selection is also copied to the higher time frame).
Since the zones will be wider, some zones could be filtered. You may want to use lower XY factors.

This is possibly the last update from a 2020 series.
From now on I will add the new features to "Supply and Demand Dashboard PRO".
버전 3.4 2020.10.10
The new update brings:
1) Graphical improvements and
2) Some traders of supply and demand zones requested a new function. It was added optionally: Draw supply and demand zones only at major highs and lows.
New input:
+ use only major highs and lows
By default, the function is not used. To use the function, you must set the new input = true. (The choice will be copied to the higher timeframe as well.
To show all zones at highs and lows you might want to set all XY-factors = 1.0, but it can be combined.)
버전 3.3 2020.10.04
MAJOR UPDATE 2020
==================

Added optional: Supply and Demand zones with ENGULFING BARS pattern at the beginning of the zone.
Use reversal candle color for bar 1 or bar 2 (the one before). Use either ones or both.
Use true engulfing pattern for above mentioned bars. (Must choose above.)

By default the use is false. To use the function you must set the new inputs = true.

New inputs:
==== Candle pattern
+ use reversal candle color bar 1
+ use reversal candle color bar 2 (both or either)
+ use true engulfing pattern (choose above)
버전 3.2 2020.09.17
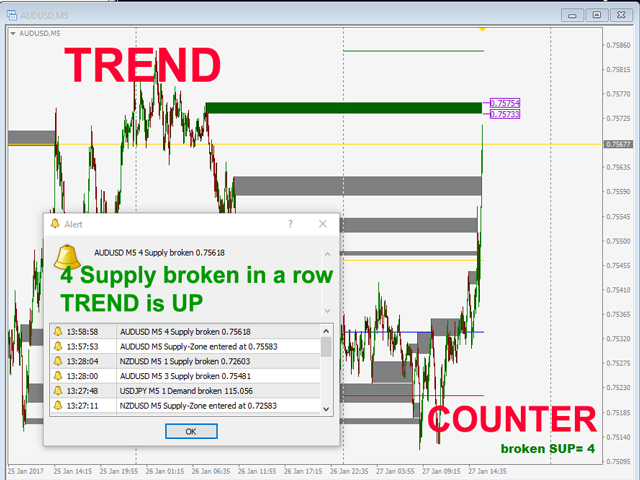
Various improvements and graphic options for counter of broken zones.
버전 3.1 2020.07.23
Thanks to client report, fixed an issue with show old zones and number of broken Sup/Dem in a row.
버전 3.0 2020.02.10
Added zone size info in point. As requested by trader.
It will show in the right corner of the rectangles. The size of the higher timeframe is shifted a few bars to the left.
new inputs:
=== Chart settings
+ show zone size (point)
+ show zone size MTF (point)

associated inputs:
+ color price labels
=== other settings
+ font size zone
+ Label font 1
버전 2.90 2020.01.14
Various improvements.
버전 2.80 2019.10.18
At the request of a trader:
Added room in points for HIT-alert. Now the trader can receive an earlier alert when price is NEAR a zone. Then he can take action or watch. This input should be applied according to the symbol and timeframe. The trader can make it bigger to suit his needs. The default value is 5 points. (10 point = 1 pip.)
new input:
+ room in points for HIT-alert
버전 2.70 2019.09.21
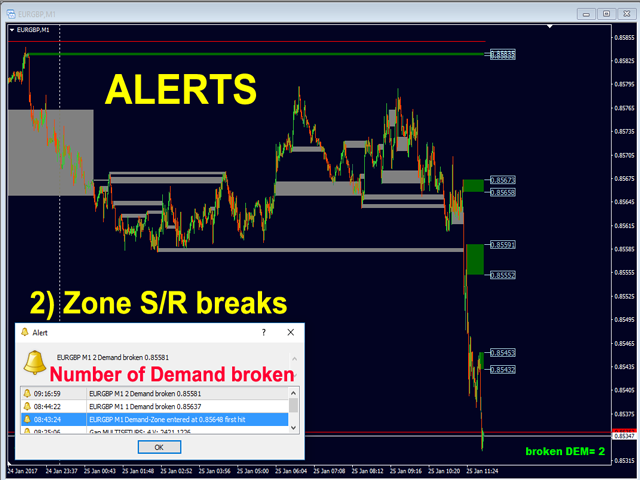
1) A new alert for a fake (or false) breakout has been added with several variables:
new inputs:
==== FBO Alert settings
+ Alert Fake Breakout (FBO)
+ FBO min bar Size Point
+ FBO bar closes back % (20-90)
+ FBO pattern bar count (1-3)

2) For old zones a new candle limit was added. If there is a strong trend, zones with only 2000 bars lookback may not be within range. Therefore, this limit has been increased to 5000. But so far we don't have to draw old zones. Therefore, a new limit has been added for old zones with 1000 bars.
new input:
+ Show Bars back for old zones

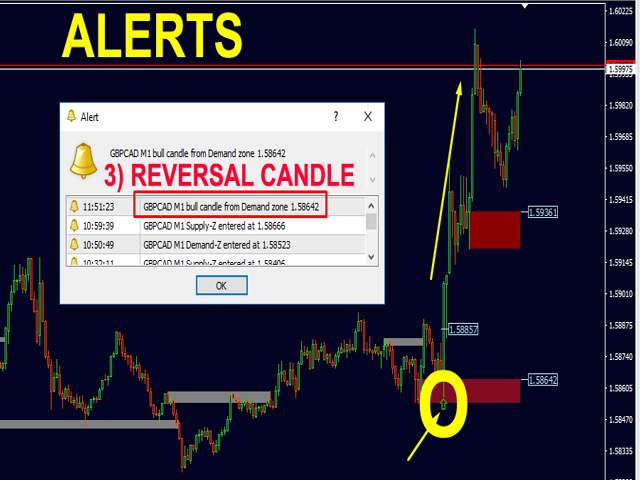
3) Now you can edit the size for arrow as requested by trader.
new input:
+ reverse candle arrow size (1 to 5)
버전 2.60 2019.05.29
1) Optimized some issue with old zones and counter.

2) As requested by a trader the reversal arrow will now only draw on nested zones if the filter "alert only nested" is true.

3) A new filter for alerts has been added to alert only if the zone is new or untouched. (Excluding break alert.)
New input:
+ reverse candle: use only new zones (default = false)
To activate the filter set above input to true;

4) A new candle limit has been added for old zones. If there is a strong trend the zones might not be in range with only 2000 bars look back. So this limit was set higher to 5000 bars. But we do not need to draw old zones so far. That's why a new limit for old zones has been added. (Default = 1000 bars.)
New input:
+ show Bars back for old zones
버전 2.50 2019.04.25
Optimized diverse functions and graphics.
버전 2.40 2018.12.06
Optimized XY-filter for higher timeframe MTF.
To make sure the higher timeframe filters out weak S/D zones the same way as the lower timeframe (chart) does.
Also you can setup different values for each timeframe.
Default values are now set to:
+ min X-factor of price travel away (ATR) = 1.4
+ min Y-factor of price travel away (zone size) = 2
버전 2.30 2018.11.04
New features added!

Added an optional filter to alert only nested zones. (The lower timeframe zone must be within a higher timeframe zone.)
It applies to all 3 actual alerts (hit - reverse - break).
If turned off the alerts will still tell if the alerted zone was nested or not.
New input:
+ alert only NESTED zones! (within MTF)

Added an optional pause in seconds for less CPU use. (Set to 0 to turn it off) At least on each new candle new zones will be checked.
New input:
+ pause runs in seconds to next update (for less CPU use) (0=not)
버전 2.20 2018.10.25
Added a new visual option for higher timeframe zones rectangles.
If the square is not filled and the width is 1 it can be used as dashed/dotted etc...

New input below other settings:
+ rectangle line style MTF (width must be 1)
버전 2.10 2018.10.01
Added XY-filter for higher timeframe.
If you want the higher timeframe to show like before set XY-filter MTF = 1.0

New input parameters:
==== MTF settings
+ min HTF!-candles before a zone is printed
+ min X-factor of price travel away (ATR) MTF
+ min Y-factor of price travel away (zone size) MTF

Added pre-name for objects. In case you want to use the indicator twice on a chart, enter here a letter for the 2nd.

New input parameters:
==== other settings
+ prename for additional objects
버전 2.0 2018.09.25
Version 2.0 - 2018.09.24
Final upgrade with faster calculations.
It just got hypersonic speed to draw all levels and zones !!!

+ added "usePIN" for developments (Global variables)
Gives access to the first 5 supply and demand zones (outer price, inner price, if it is used or not, the timeframe, and the symbol).

버전 1.22 2017.07.17
Added an input to draw the higher timeframe squares extended to the right to not cover the live candle.
Optimized alerts.
Minimized CPU usage with a timer.
Reorganized inputs.

New input parameters:
+ draw rectangle extended over live candle (1 to 5 bars)
+ zone print delay seconds for redraw (5 to 60 sec)
버전 1.14 2017.04.24
On customers request, I added different colors for broken (old) zones.
+ color supply old
+ color demand old
Repeating alerts on M1 are been fixed.
버전 1.13 2017.03.30
With this update, we have a small add for better graphic.
Now you can choose empty squares for the higher timeframe (MTF) and edit the line width. This makes it graphically easier to differentiate between chart timeframe zones and higher timeframe zones.
+ rectangle style full MTF (default=false)
+ rectangle width (1-5) MTF (default=3)
The colors have been modified for the higher TF to be more beautiful.
버전 1.12 2017.03.16
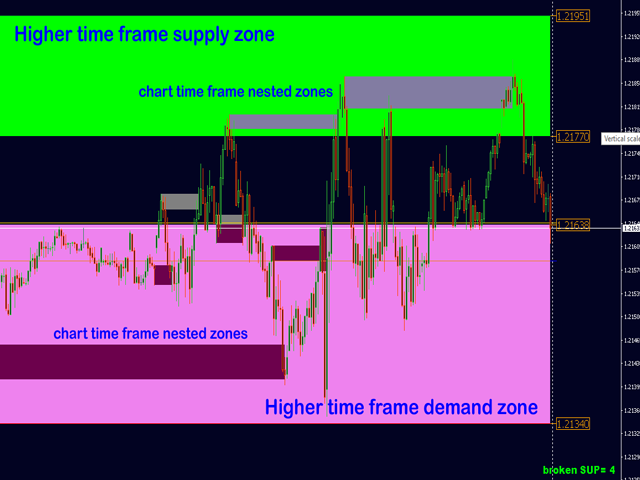
With this update, you will be able to show double time frame zones. You will not only be able to show a higher TF but to show both, the chart TF, PLUS the higher TF: SHOWING NESTED ZONES.

Indicator parameters added:
==== MTF settings
+ ADD higher TF
+ higher TF period (or one more if chart TF)
+ show inner price labels MTF
+ show outer price labels MTF
+ limited size of a big zone. Max factor (ATR) MTF
+ color supply MTF
+ color supply used MTF
+ color demand MTF
+ color demand used MTF
+ color price labels MTF
+ size price labels MTF
버전 1.11 2017.02.06
Corrected count of broken supply/demand zones and start of daily lines.