Smooth RSI Vector
- 지표
- 버전: 1.0

Overview
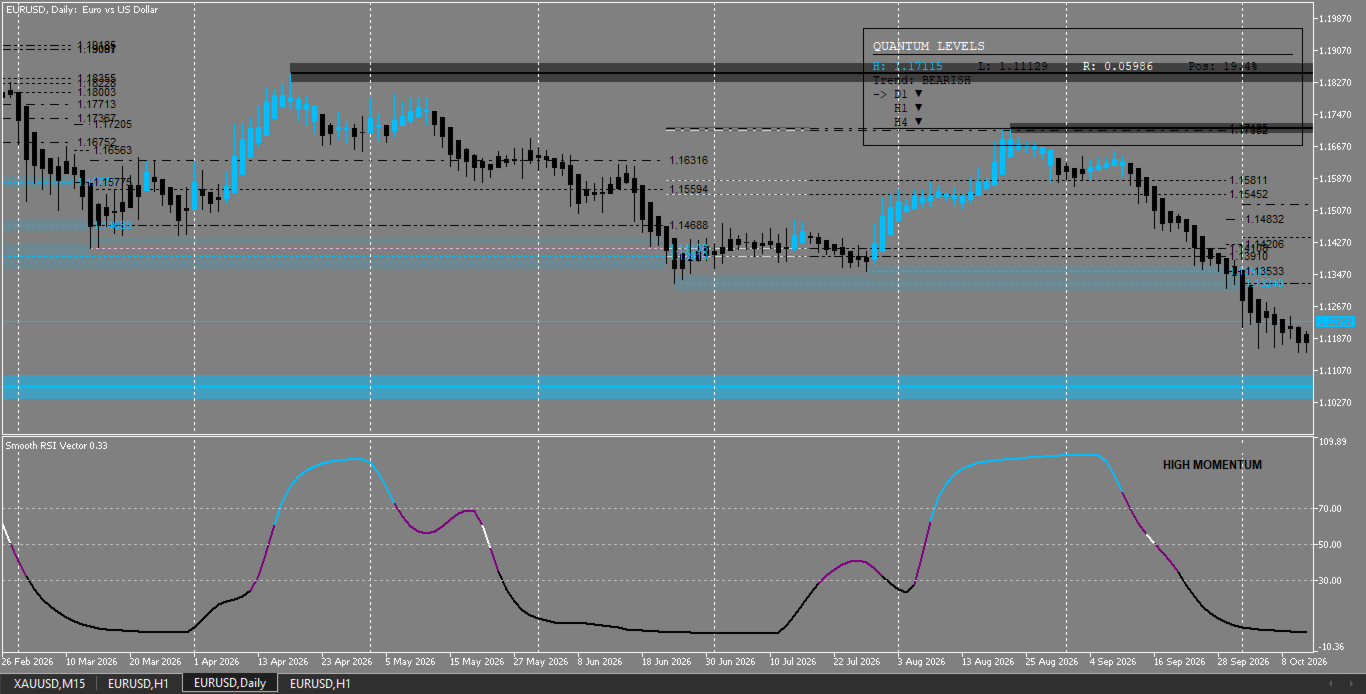
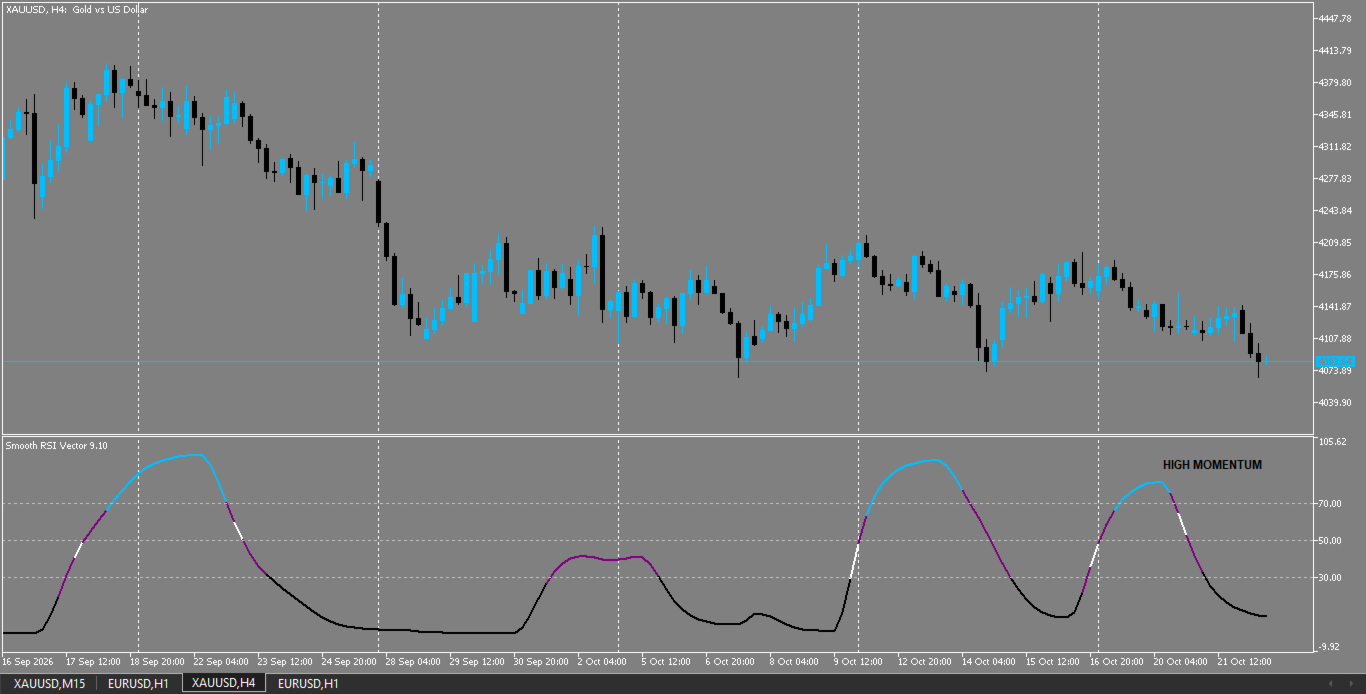
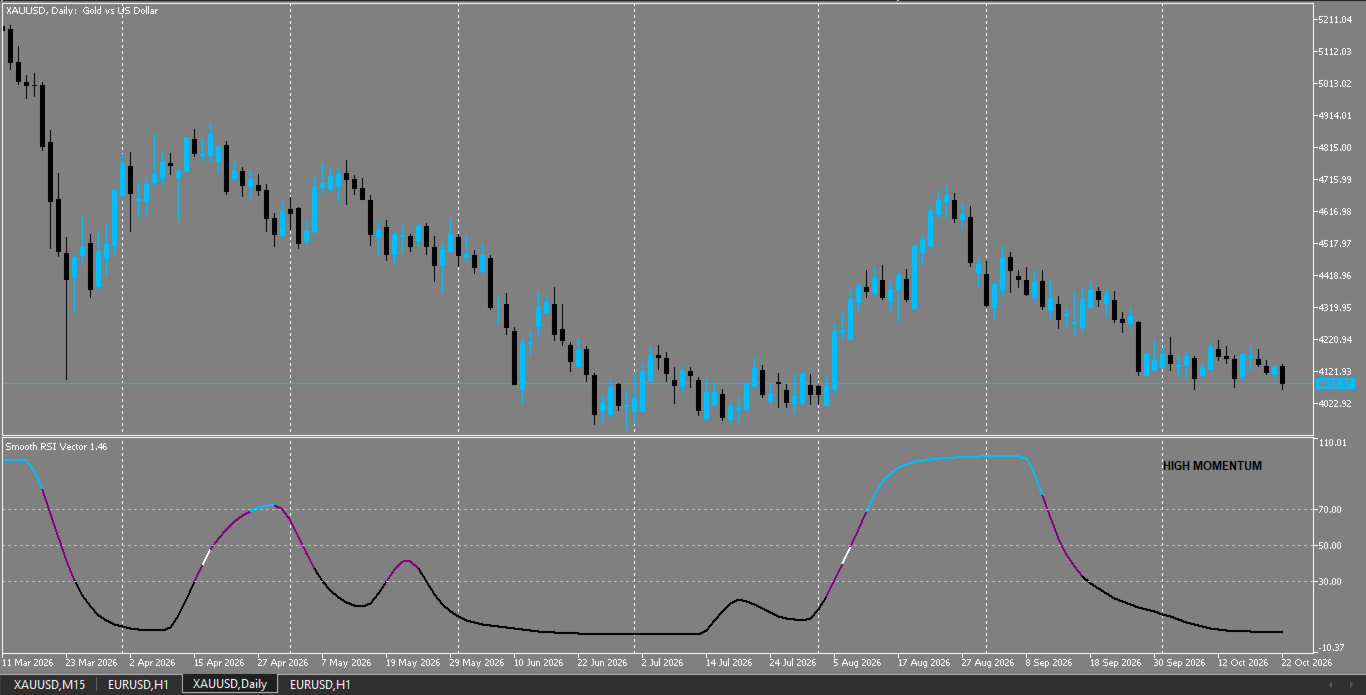
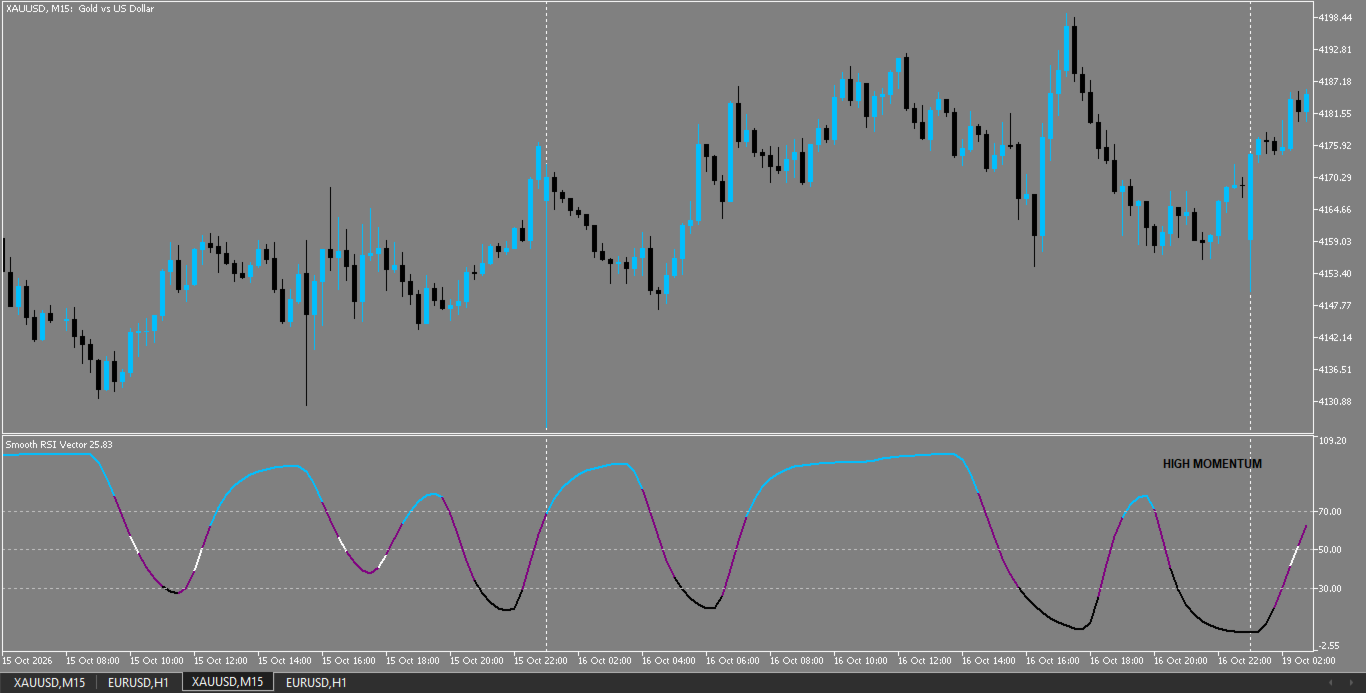
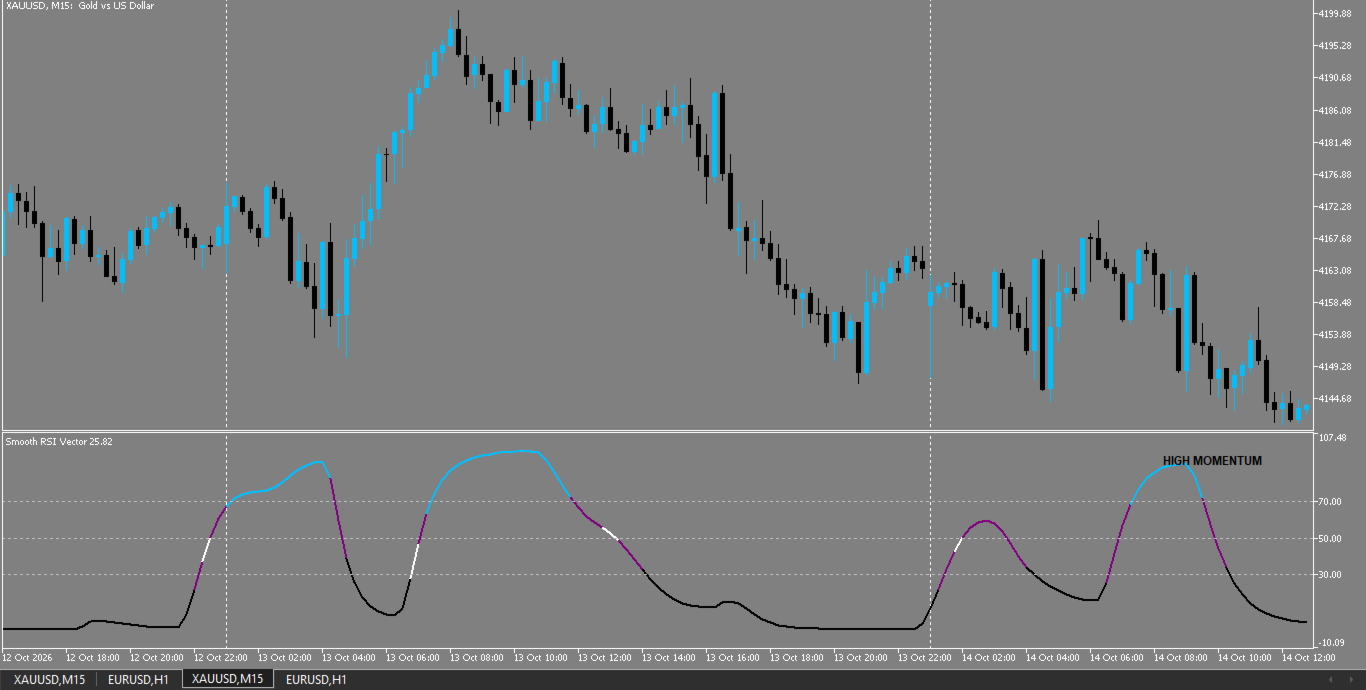
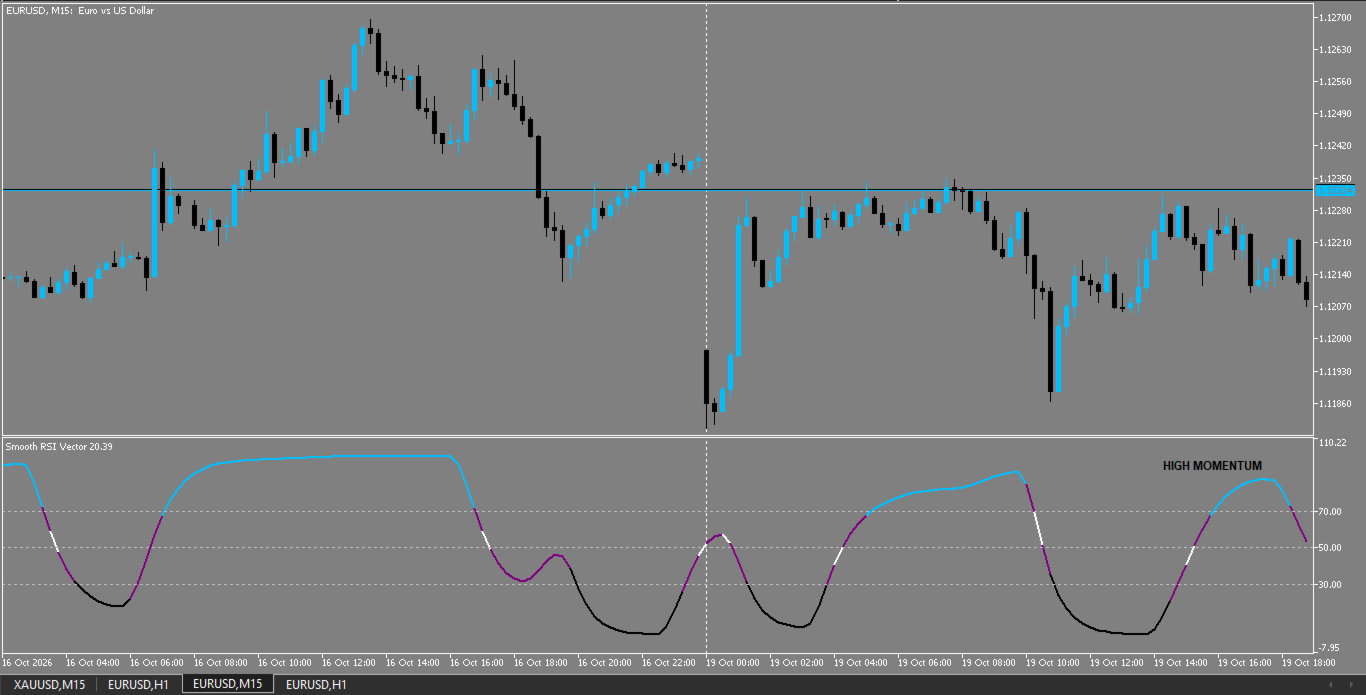
Smooth RSI Vector is a technical indicator for MetaTrader 5. It calculates a normalized momentum oscillator by processing price data and displaying the result as a color-coded line in a separate window, accompanied by a text dashboard on the main chart.
The indicator is an analysis tool. It does not open trades and does not provide buy or sell signals.
Displayed elements
The indicator provides the following elements:
A sub-window oscillator line that transitions between four specific colors based on the current value.
An on-chart text dashboard that displays the current market state using custom user-defined strings.
Horizontal reference levels at 30, 50, and 70.
Interpretation
The oscillator values range from 0 to 100. The visual mapping alters the line color and the dashboard text simultaneously when the calculation enters predefined zones. The default thresholds are set at 70 for the upper zone, 30 for the lower zone, and a specific 47-53 median zone for point-of-interest mapping. How these outputs are applied is the trader's own decision.
Input parameters
The parameters are grouped as follows:
Smoothing Engine: Adjusts the Fast, Mid, and Slow period lengths of the filtering sequence.
Vector Calculation: Defines the primary lookback length for the momentum calculation.
Dashboard Placement: Configures the screen corner, X and Y pixel offsets, and the font size.
Dashboard Labels: Allows the user to rename the four default text outputs (High Momentum, Low Momentum, Price at POI, and Ranging).
Dashboard Colors: Independent color selection for the line mapping and the dashboard text.
Technical notes
The indicator works on any symbol and timeframe and uses the data of the current chart. It creates and manages its own graphical objects and removes them from the chart upon deletion. It does not use DLLs, external resources or network requests.
Risk notice
Please test the product on a demo account and in the Strategy Tester before using it on a live account.