Norepaint Harmonic Patterns with minimal Lag MT5
- 지표
- Sergey Efimenko
- 버전: 1.8
- 업데이트됨: 20 8월 2020
- 활성화: 15
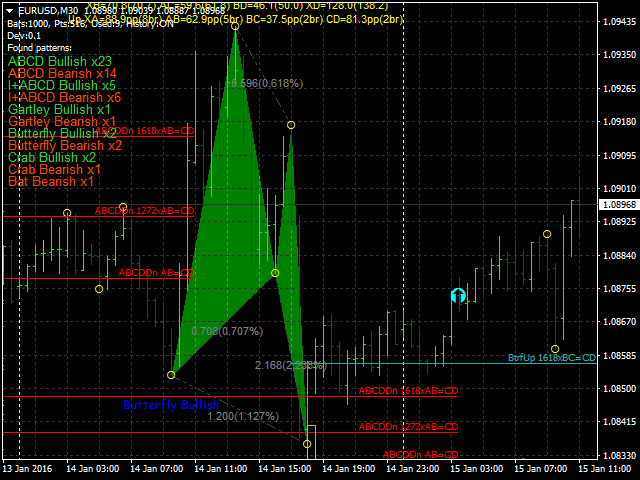
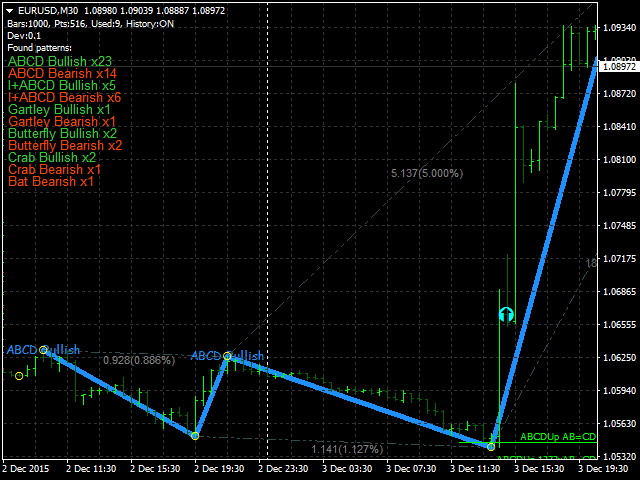
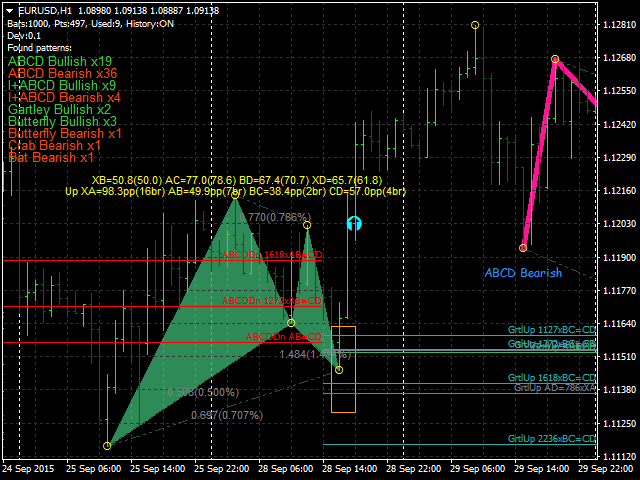
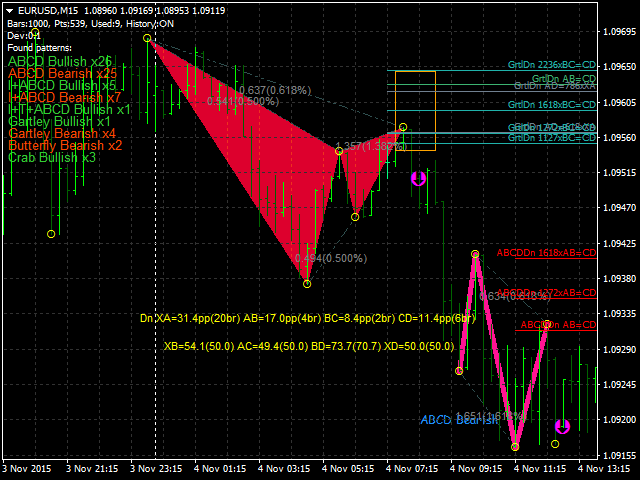
표시기는 가능한 최소 지연으로 다시 칠하지 않고 차트의 고조파 패턴을 보여줍니다. 지표 상단 검색은 가격 분석의 파동 원리를 기반으로 합니다.
고급 설정을 통해 거래 스타일에 대한 매개변수를 선택할 수 있습니다. 양초(막대)가 열릴 때 새로운 패턴이 형성되면 가격 변동의 가능성이 있는 방향의 화살표가 고정되어 변경되지 않습니다.
표시기는 ABCD, Gartley(Butterfly, Crab, Bat), 3Drives, 5-0, Batman, SHS, One2One, Camel, Triangles, WXY, Fibo, Vibrations와 같은 패턴과 그 종류를 인식합니다. 기본적으로 ABCD 및 Gartley 수치만 설정에 표시됩니다. 많은 추가 구성 가능한 매개변수.
주요 매개변수:- ShowUpDnArrows - 가능한 방향 화살표 표시/숨기기
- ArrowUpCode - 위쪽 화살표 코드
- ArrowDnCode - 아래쪽 화살표 코드
- Show old history patterns - 오래된 패턴 표시 활성화/비활성화
- Enable alert messages, actual if history OFF - 패턴이 나타나거나 변경될 때 경고 활성화/비활성화(기록이 비활성화된 경우에만)
- Enable alert notification, actual if alert messages is enabled - 패턴이 나타나거나 변경될 때 알림(MQ ID) 활성화/비활성화(기록이 비활성화된 경우에만)
- Enable alert mail, actual if alert messages is enabled - 패턴이 나타날 때/변경될 때 이메일 활성화/비활성화(기록이 비활성화된 경우에만)
- Enable alert sounds, actual if history OFF - 패턴이 나타나거나 변경될 때 오디오 신호 활성화/비활성화(기록이 비활성화된 경우에만)
- AlertsSoundFileName - 신호 사운드 파일 이름
- Back color - 배경색
- Main text color - 기본 텍스트 색상
- Main text font size - 기본 텍스트 글꼴 크기
- PeriodLowest - 극값 검색 알고리즘의 기간
- DivLLPeriod - 극한 검색 알고리즘의 마침표 구분 기호
- LLMethod1 - 극한 검색 알고리즘 평균화(방법 1)
- LLMethod2 - 극한 검색 알고리즘 평균화(방법 2)
- LLPrice1 - 극한 검색 알고리즘에 대한 가격 유형 1
- LLPrice2 - 극한 검색 알고리즘에 대한 가격 유형 2
- TriggerSensivity - 스무딩 필터 감도(또는 동적 모드에서 옵션을 사용할 때의 최소 제한)
- UseDynamicSensivity - 동적 필터링 활성화/비활성화
- DynamicSensivityPeriod - 동적 필터링 기간
- DynamicSensivityMul - 동적 여과 비율
- UseMinSensivityFilterForDynamic - 동적 필터링 중 최소 민감도 임계값 활성화/비활성화(값은 TriggerSensivity에 포함됨)
- DrawPnts - 극값 표시 활성화/비활성화
- ArrowCode - 극값 기호 코드
- Limit points to search patterns - 패턴 검색을 위한 극한 포인트의 양
모든 표시기 매개 변수는 여기에서 찾을 수 있습니다: https://c.mql5.com/31/98/params.txt


very clear and well-made indicator. absolutely recommended