Tools Standard
- 지표
- Igor Semyonov
- 버전: 1.26
- 업데이트됨: 1 4월 2020
- 활성화: 5
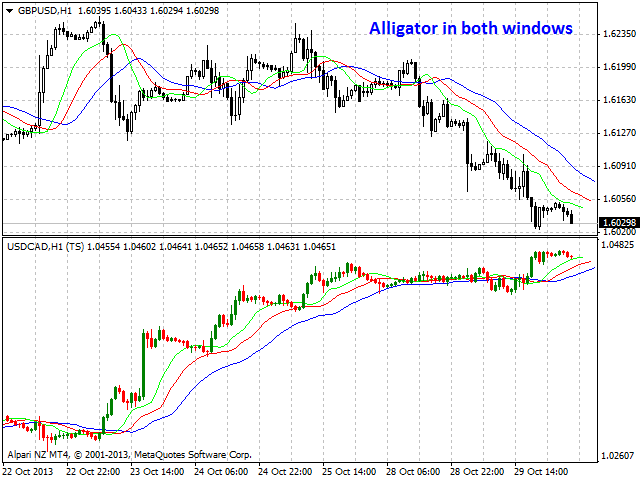
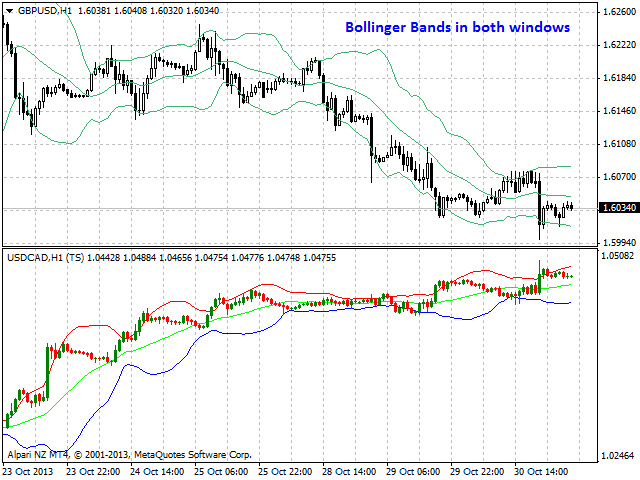
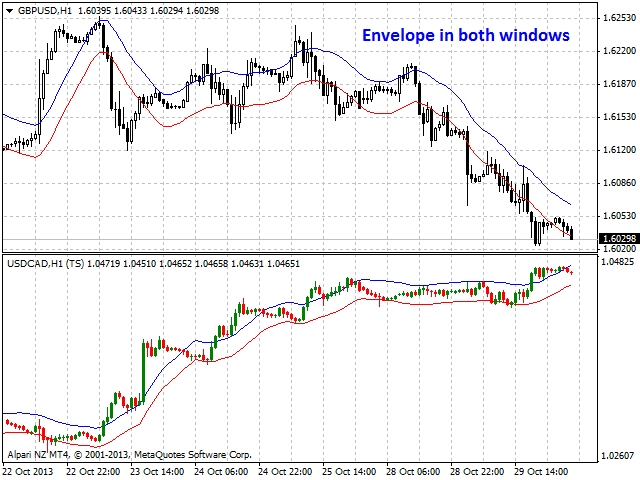
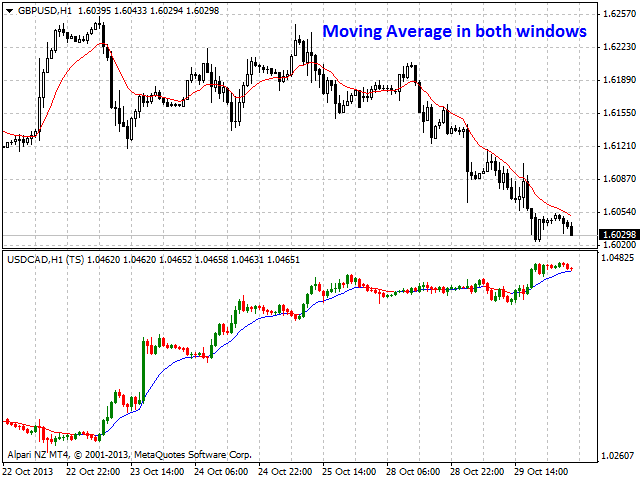
Tools Standard is a color multicurrency/multi-symbol indicator. It is designed for displaying one of the seven standard indicators on candlestick chart in a separate window under the base symbol chart.
The indicator can be calculated based on one of the seven indicators according to user preferences:
- Bill Williams Alligator
- Bollinger Bands
- Envelopes
- Bill Williams Fractals
- Moving Average
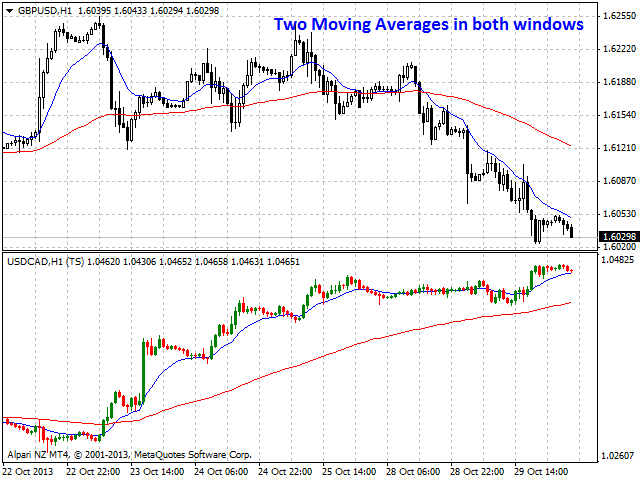
- Two Moving Averages
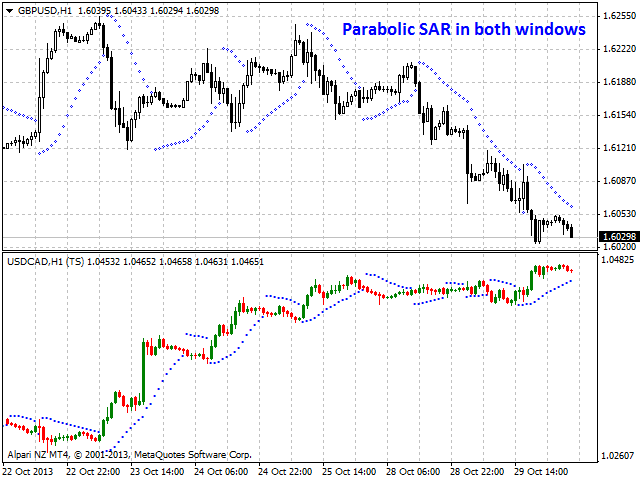
- Parabolic SAR.
Bill Williams Alligator is used by default.
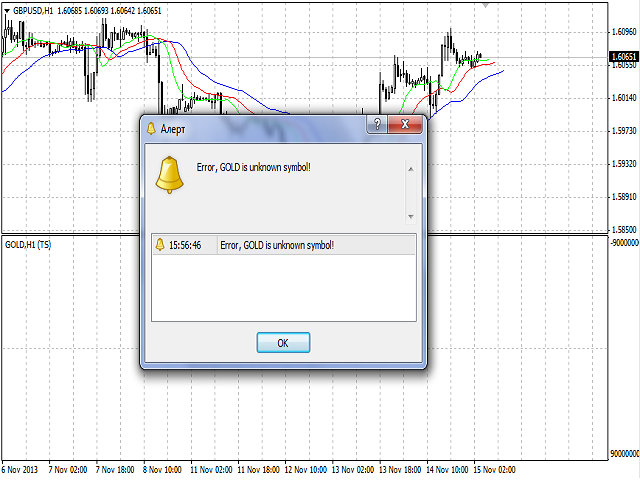
The indicator may be used with any broker, irrespective of the name of the financial instrument since it is necessary to manually enter the name as an input parameter. If you enter a non-existent or incorrect name of a financial instrument, you will receive an error message that this financial instrument is unknown (does not exist).
Users also can set the number of displayed candlesticks, as well as select bullish and bearish colors including the colors of the applied indicator's lines.
Purpose
The indicator can be used as a visual tool that represents the market data in a more informative way, as shown in the screenshots, improving the market event analysis.
The indicator can be used for manual or automated trading within an Expert Advisor. For automated trading, use the indicator buffer of the double type:
- Buffer 0 depending on Ind_Number index - indicator values:
- Alligator's Jaw
- The lower line of Bollinger Bands
- The upper line of the Envelope
- Bill Williams upper fractal
- Moving Average
- Fast Moving Average
- Parabolic SAR values
- Buffer 1 depending on Ind_Number index - indicator values:
- Alligator's Teeth
- The upper line of Bollinger Bands
- The lower line of the Envelope
- Bill Williams lower fractal
- Bullish line of the Moving Average - the value should not be equal to zero
- Slow Moving Average
- Buffer 2 depending on Ind_Number index - indicator values:
- Alligator's Lips
- The medium line of Bollinger Bands
- Bearish line of the Moving Average - the value should not be equal to zero
- Buffer 3 - indicator values at Open prices
- Buffer 4 - indicator values at High prices
- Buffer 5 - indicator values at Low prices
- Buffer 6 - indicator values at Close prices
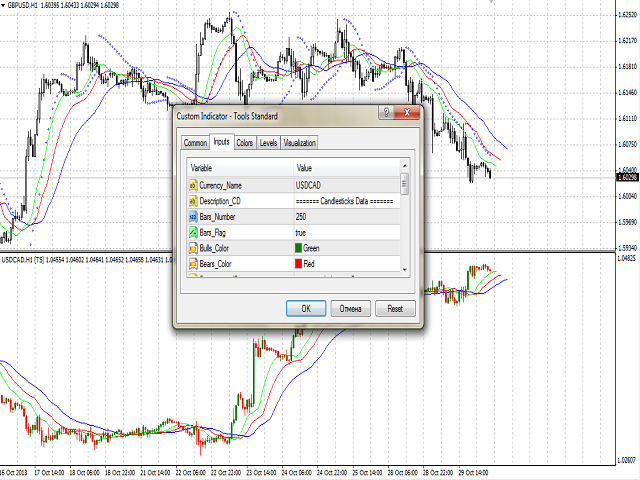
Input Parameters
- Currency_Name - name of the financial instrument
- Bars_Number - number of bars for displaying in a separate window
- Bars_Flag - flag allowing display of the number of bars set in Bars_Number parameter:
- true - according to Bars_Number
- false - maximum available number of bars in history
- Bulls_Color - bullish candle color
- Bears_Color - bearish candle color
- Bid_Line_Color - color of the Bid line.
- Ind_Number - indicator number (from 0 to 6). Force indicator is used by default (i.e. more than 3)
- Fast_Period - fast period
- Slow_Period - slow period
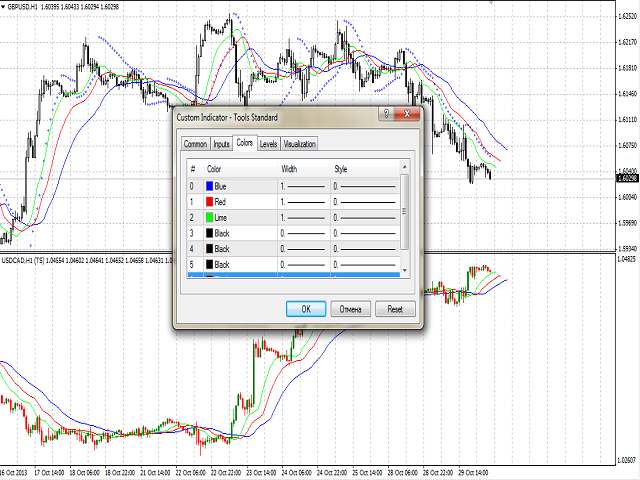
- Jaw_Period - blue line (Alligator's Jaws) averaging period
- Jaw_Shift - blue line shift relative to the price chart
- Teeth_Period - red line (Alligator's Teeth) averaging period
- Teeth_Shift - red line shift relative to the price chart
- Lips_Period - green line (Alligator's Lips) averaging period
- Lips_Shift - green line shift relative to the price chart
- MA_Method - method of averaging of the basic indicator:
- MODE_SMA - 0
- MODE_EMA - 1
- MODE_SMMA - 2 (by default)
- MODE_LWMA - 3
- Applied_Price - used price:
- PRICE_CLOSE - 0
- PRICE_OPEN - 1
- PRICE_HIGH - 2
- PRICE_LOW - 3
- PRICE_MEDIAN - 4 (by default)
- PRICE_TYPICAL - 5
- PRICE_WEIGHTED - 6
- Deviation_Bands - deviation from the main line for Bollinger Bands
- Deviation_Envelope - deviation from the main line in % for Envelopes
- SAR_Step - stop level increment for Parabolic SAR
- SAR_Maximum - maximum stop level for Parabolic SAR
- Shift - shift of the basic and calculated indicator relative to the price chart
Limitations
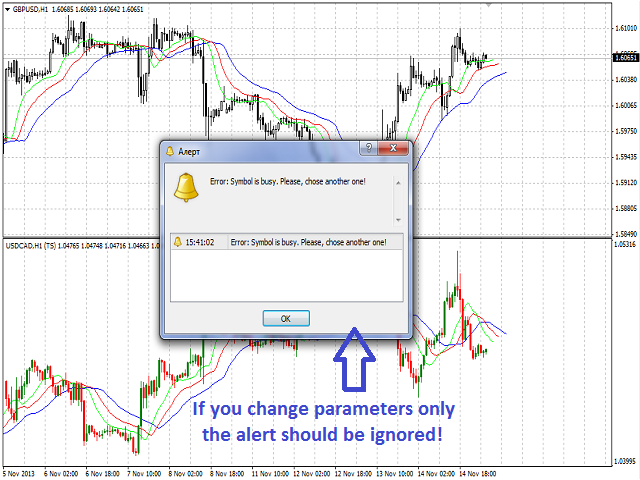
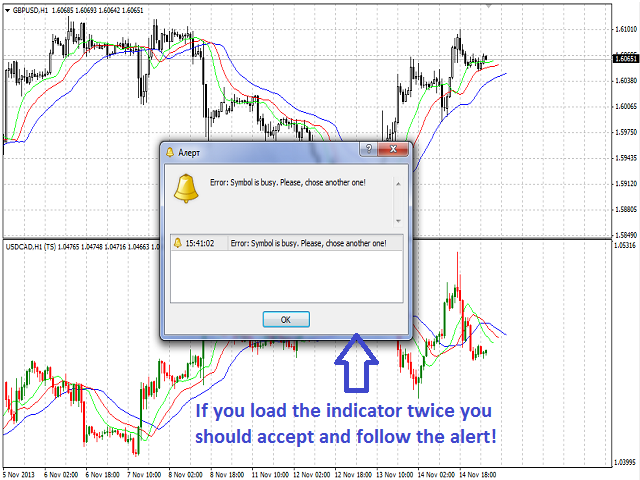
A chart with similar parameters on the same symbol can be displayed only once. Otherwise, an error related to its re-using occurs. An appropriate error message is displayed and an offer to replace a symbol is made. However, this error message should be ignored when only parameters of the calculation indicator (already created in the window) are modified (see screenshots).
Recommendations
It is recommended to use the indicator with Bars_Number parameter not exceeding the number of bars fitting in one full window (about 250 bars).
Note
In case connection with a trade server is lost, the chart is re-drawn from the beginning using the number of bars set by Bars_Number and Bars_Flag parameters after connection is restored and swapping of data is under way.