Channels Pro
- 지표
- Alexander Nikolaev
- 버전: 1.1
- 업데이트됨: 12 9월 2021
- 활성화: 10
The indicator determines and plots price channels or lines, reading information from multiple timeframes (from current, second and third) simultaneously. Color and width of lines for each timeframe can be customized. It is also possible to set different distance between the Highs and Lows for plotting channels or lines.
Parameters
- History - maximum number of bars to plot channels or lines;
- Distance - minimum distance from one High (or Low) to another when plotting lines;
- Shift - shift for several bars back from the current price, where a channel breakout is possible;
- DrawChannels - draw channels or trend lines (is enabled, channels are plotted
- ChannelsColorCurrentTimeframe - color of the lines (or channels) of the current timeframe;
- ChannelsWidthCurrentTimeframe - width of the lines (or channels) of the current timeframe;
- SecondTimeframe - selection of the second timeframe;
- ChannelsColorSecondTimeframe - color of the lines (or channels) of the second timeframe;
- ChannelsWidthSecondTimeframe - width of the lines (or channels) of the second timeframe;
- ThirdTimeframe - selection of the third timeframe;
- ChannelsColorThirdTimeframe - color of the lines (or channels) of the third timeframe;
- ChannelsWidthThirdTimeframe - width of the lines (or channels) of the third timeframe;
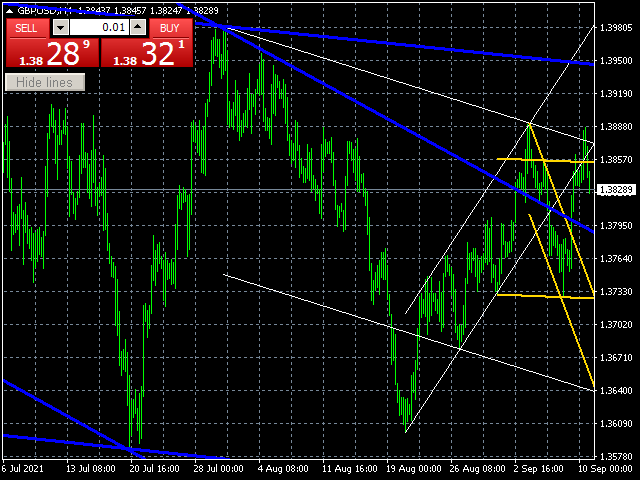
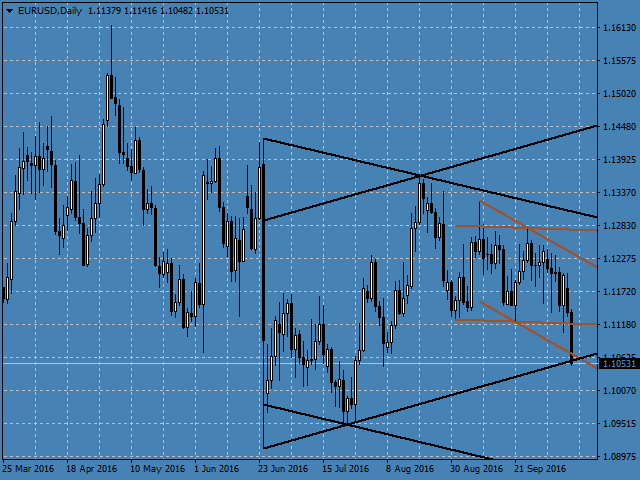
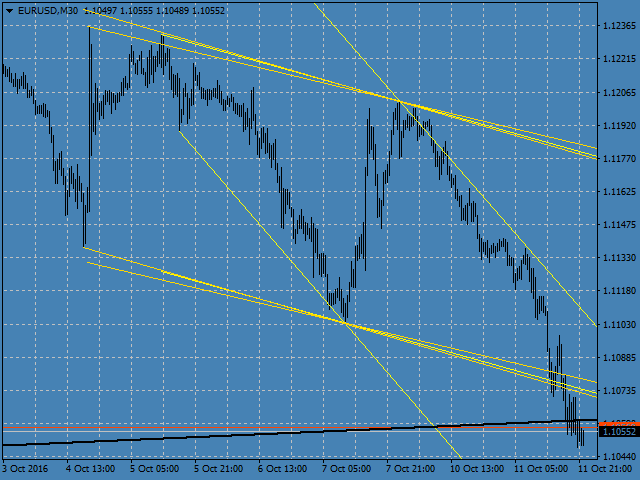
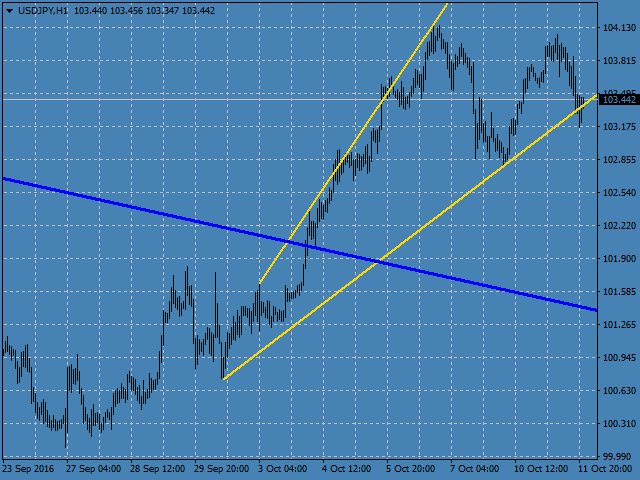
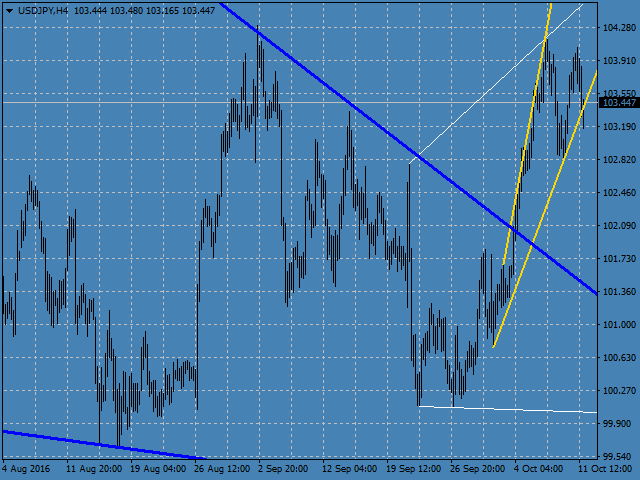
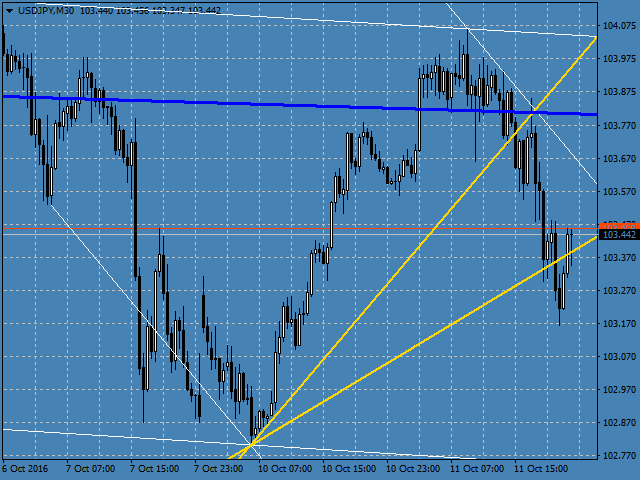
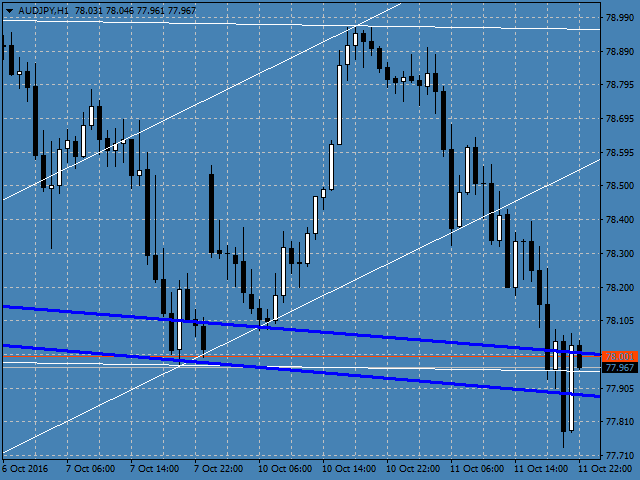


value for money indicator and a more intelligent channel trendline indicator being able to draw trendlines defining the latest direction bias. Surprisingly, much better than some expensive trendline indicators in MQL5.com