Zone Grader MT5

SUPPORT & RESISTANCE

Not every level is worth trading. This one tells you which.

Most support and resistance tools draw every level they find and leave you to guess which ones matter. Zone Grader does the opposite: it detects the levels, then grades each one by how much it has actually proved itself — and writes that grade on your chart.


TRY IT FOR REAL, BEFORE YOU BUY

Click Download Demo at the top of this page and run Zone Grader in the Strategy Tester — your symbols, your timeframes, your history. In visual mode you watch the zones form, get graded, get tested, get broken and flip, bar by bar, exactly as they would live. No screenshots to trust, no claims to take on faith. The engine either earns its place on your chart, or it does not.

User manual:  https://c.mql5.com/6/1020/ZoneGrader_UserManual_v3_13.zip


THREE GRADES, WRITTEN ON THE CHART

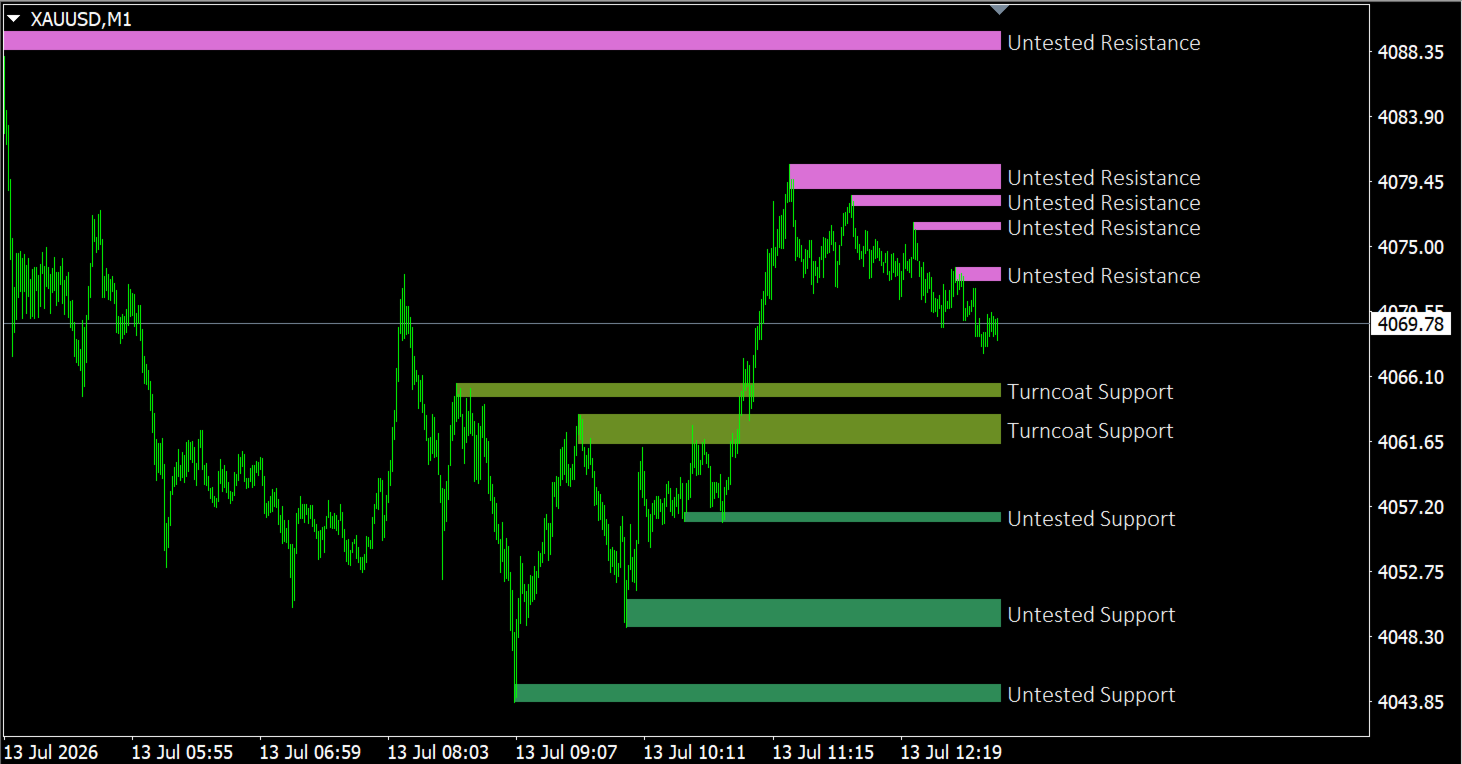
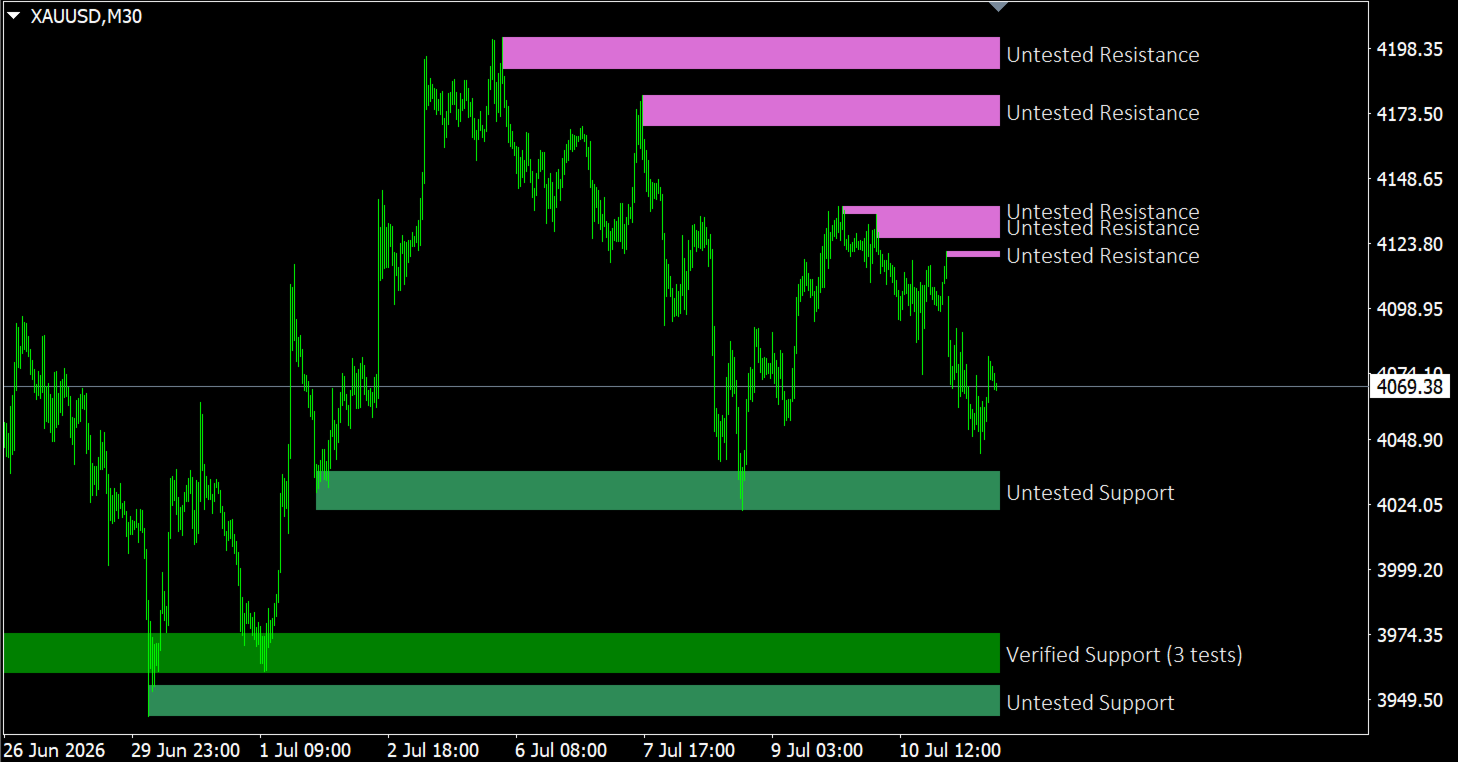
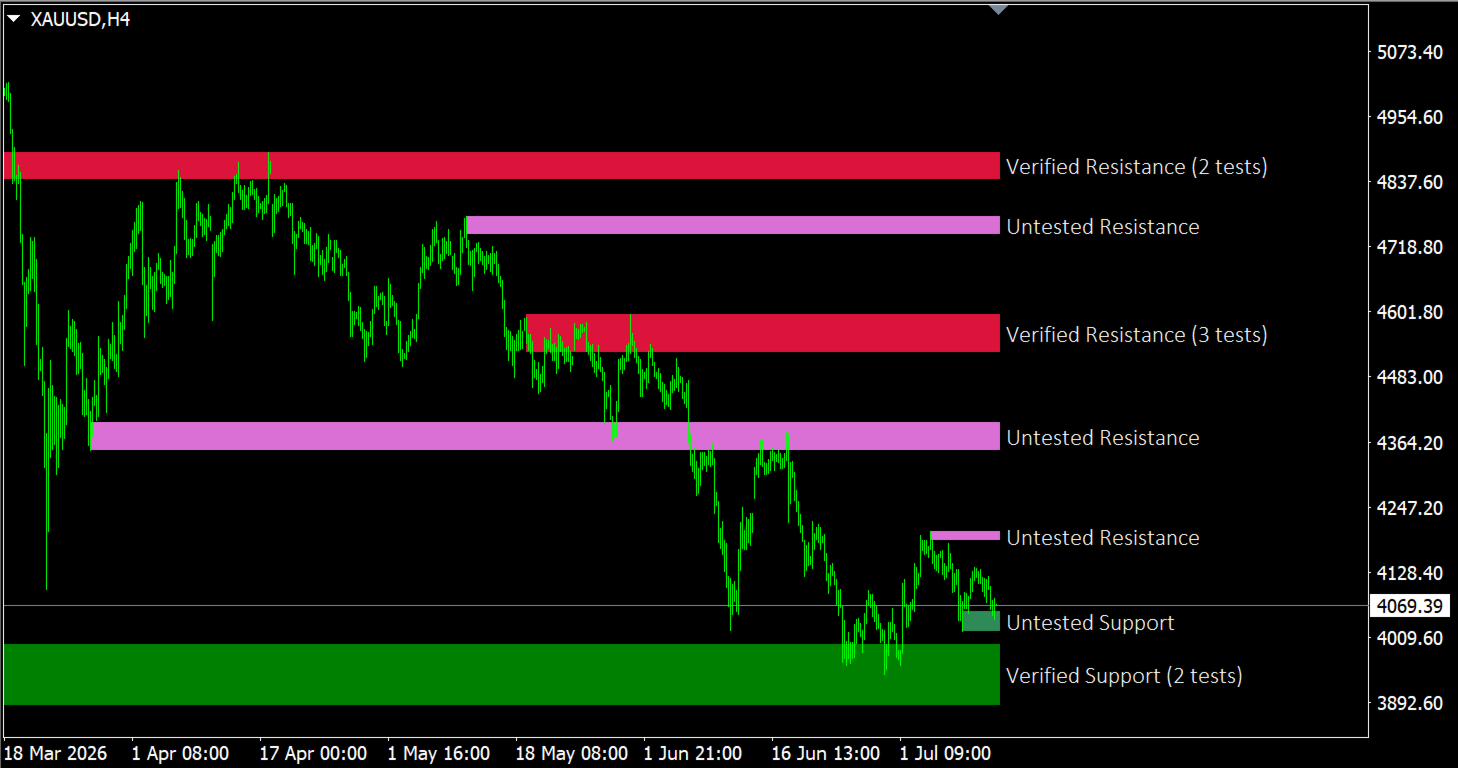
VERIFIED — tested one to three times, and held. Your highest-confidence area. The label carries the exact count: Verified Support (2 tests).

UNTESTED — formed by a major swing, never retested. Fresh and potentially strong, but unproven. Ideal for planning ahead.

TURNCOAT — broken once, now working from the other side: a former resistance acting as support, or the reverse. It marks the retest area after a breakout. If it holds, Zone Grader re-grades it Verified — that re-grade is your confirmation the breakout was genuine. If it fails, the zone disappears altogether.

A level tested more than three times is considered worn out and is removed. You are never shown a level the engine no longer believes in.

ZONES, NOT LINES

Real reactions never happen at one exact price. Each level is drawn as a band whose thickness follows current volatility (ATR), so normal overshoot stays inside the zone — and the far edge of the band gives you a logical place for the stop.

HOW IT WORKS

  • Swing highs and lows are detected at two sensitivities: minor swings act as candidate touches, major swings create the structurally significant levels.
  • A level is broken only when a candle closes beyond the band. A wick that pierces without closing is a test, not a break — exactly how a trader reads it.
  • Two tests must be separated by roughly ten bars, so the same swing is never counted twice.
  • Overlapping zones are merged into a single wider band. A merge never invents a test: the count on a label always reflects real reactions.

KEY FEATURES

  • MetaTrader 4 and MetaTrader 5 — same detection engine, identical rules
  • Graded zones with on-chart labels and test counts
  • Multi-timeframe: project H4 or D1 zones onto your M15 chart, each label carrying its origin — [H4]
  • Several instances on one chart: H4 and H1 zones side by side
  • Alerts on zone entry — pop-up, push, e-mail — with an anti-spam delay
  • Optional fractal arrows showing the raw swings the zones are built from
  • Readability controls: keep only the N nearest zones per side, or hide zones beyond N × ATR from price
  • Fully configurable colours, borders, fill, label font and position
  • Zone labels adapt automatically to your chart background, dark or light
  • Touches a single chart property — the right margin, so the labels stay visible — and restores it when removed

EA INTERFACE

Buffers 4 to 11 publish the nearest support and the nearest resistance: upper edge, lower edge, grade code and validated test count for each side. Read them with  iCustom  in MT4, or  CopyBuffer  on an  iCustom  handle in MT5. Your Expert Advisor gets graded levels without reimplementing the detection.

HOW TO USE IT

  • Verified — wait for a reaction inside the band, place the stop beyond the far edge.
  • Untested — set an alert and plan the trade before price arrives.
  • Turncoat — the cleanest place to join a new direction after a breakout.
  • Combine timeframes — run higher-timeframe zones over your trading chart and take only the entries that agree with them.

WORKS ON

Any symbol, any timeframe. Forex, metals, indices, crypto, stocks. Zone thickness follows volatility, so the same settings behave sensibly from M5 to D1.
제작자의 제품 더 보기
Live countdown to candle close, with automatic "Market Closed" detection. If you find this indicator useful, please consider leaving a short review or rating. It only takes a minute and really helps support my work and future updates. If you enjoyed this tool, you'll probably also like   Account X-Ray Pro , a powerful analytics solution designed to provide deeper trading insights and performance analysis. Thank you for your support, and happy trading! User manual:     https://c.mql5.com/6/1020
FREE
Live countdown to candle close, with automatic "Market Closed" detection. If you find this indicator useful, please consider leaving a short review or rating. It only takes a minute and really helps support my work and future updates. If you enjoyed this tool, you'll probably also like Account X-Ray Pro , a powerful analytics solution designed to provide deeper trading insights and performance analysis. Thank you for your support, and happy trading! L User manual:    https://c.mql5.com/6/1020
FREE
Trend Tuner MT4
Gema Mahardhika
Read the trend. Tune it live. Test it before you buy. A volatility-adaptive trend engine, built in-house: the line adapts to current market volatility, flips only on a candle close, and never moves against the trend. Around it, four things you will not find elsewhere. Try it for real, before you buy Download the free demo and run it in the Strategy Tester in visual mode. This is not a stripped-down preview: the on-chart panel is fully live there. Change the Deviation, change the Step, and watc
Zone Grader MT4
Gema Mahardhika
SUPPORT & RESISTANCE Not every level is worth trading. This one tells you which. Most support and resistance tools draw every level they find and leave you to guess which ones matter. Zone Grader does the opposite: it detects the levels, then grades each one by how much it has actually proved itself — and writes that grade on your chart. TRY IT FOR REAL, BEFORE YOU BUY Click Download Demo at the top of this page and run Zone Grader in the Strategy Tester — your symbols, your timeframes, your h
Map the session. Trade the confluence. A higher-timeframe pivot framework, built in-house: the levels are computed once from the previous completed period, fixed for the whole session, and never extended beyond the period they belong to. Around them, four things you will not find elsewhere. Try it for real, before you buy Download the free demo and run it in the Strategy Tester in visual mode. This is not a stripped-down preview: the levels, the confluence zones, the history and the live pip
See what your broker statement never shows. Test it before you buy. An on-chart analytics panel that reads your account history and your open positions, and turns them into a compact table right on the chart. No external file, no third-party service, no upload of your trading data anywhere. Around that, four things you will not find in your terminal report. Try it for real, before you buy Download the free demo and run it in the Strategy Tester in visual mode. This is not a stripped-down previe
Trend Tuner MT5
Gema Mahardhika
Read the trend. Tune it live. Test it before you buy. A volatility-adaptive trend engine, built in-house: the line adapts to current market volatility, flips only on a candle close, and never moves against the trend. Around it, four things you will not find elsewhere. Try it for real, before you buy Download the free demo and run it in the Strategy Tester in visual mode. This is not a stripped-down preview: the on-chart panel is fully live there. Change the Deviation, change the Step, and watc
Map the session. Trade the confluence. A higher-timeframe pivot framework, built in-house: the levels are computed once from the previous completed period, fixed for the whole session, and never extended beyond the period they belong to. Around them, four things you will not find elsewhere. Try it for real, before you buy Download the free demo and run it in the Strategy Tester in visual mode. This is not a stripped-down preview: the levels, the confluence zones, the history and the live pip
See what your broker statement never shows. Test it before you buy. An on-chart analytics panel that reads your account history and your open positions, and turns them into a compact table right on the chart. No external file, no third-party service, no upload of your trading data anywhere. Around that, four things you will not find in your terminal report. Try it for real, before you buy Download the free demo and run it in the Strategy Tester in visual mode. This is not a stripped-down previe
필터:
리뷰 없음
리뷰 답변