Trade Insight Engine
- 지표
-
Sarika G Talekar
 Dominate the Markets with
Institutional Edge
PropFolio Solutions delivers premium algorithmic trading tools for MT4, MT5 & cTrader — with robust license management for serious traders. - 버전: 1.21
- 활성화: 5
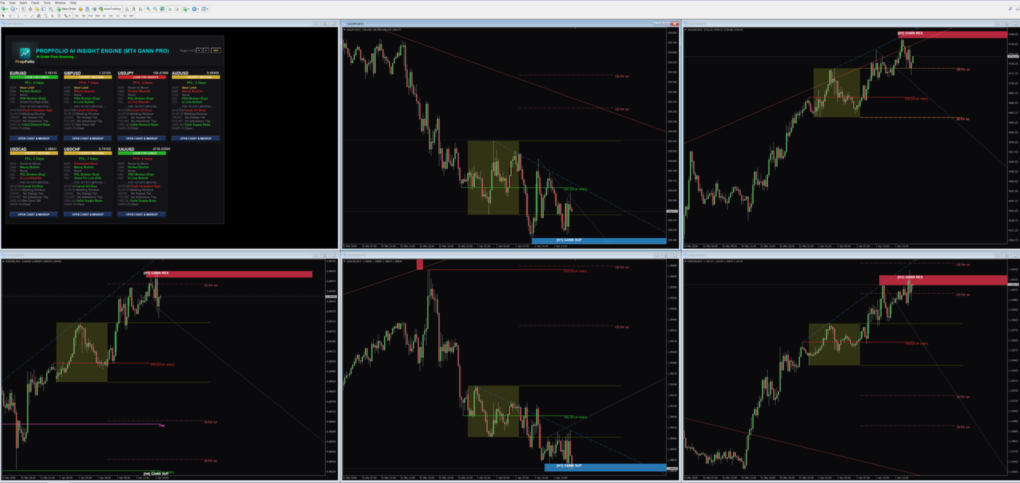
Stop spending hours manually scanning charts. The Propfolio Trade Insight Engine is an institutional-grade analytical dashboard and auto-markup utility designed specifically for SMC, ICT, BTMM, and Prop Firm traders.
This powerful engine monitors your entire Market Watch (or a custom list of pairs) simultaneously, instantly detecting high-probability setups and institutional footprints. When you spot a confluence on the dashboard, simply click a button, and the engine will instantly spawn a fresh chart fully marked up with your critical trading zones.
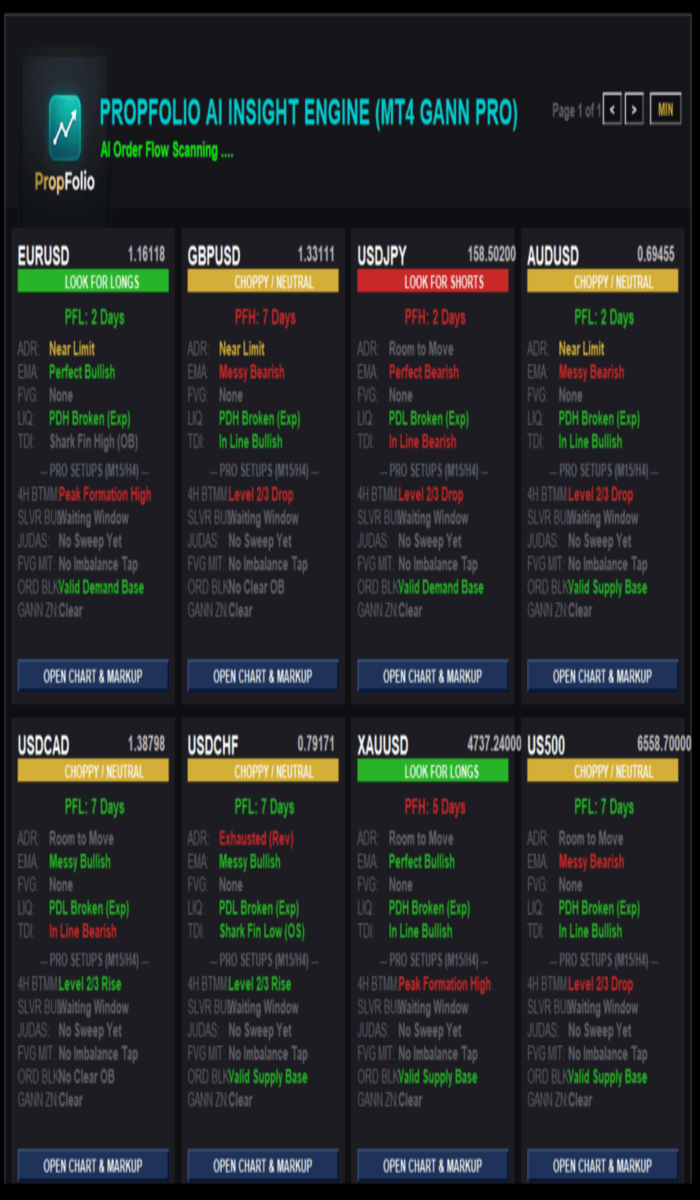
Core Dashboard Scanners See the exact state of the market across all your favorite pairs at a single glance.
-
Institutional Concepts (ICT/SMC): Instantly scans for Fair Value Gaps (FVGs), Order Blocks, FVG Mitigations, Silver Bullet windows, and Judas Swings.
-
Liquidity Matrix: Tracks Previous Daily/Weekly Highs and Lows (PDH/PDL/PWH/PWL) to detect stop hunts and liquidity sweeps in real-time.
-
BTMM & Market Maker Tracking: Identifies 4H BTMM Levels, Peak Formations (PFH/PFL), and TDI states.
-
Algorithmic Gann & ADR: Tracks Daily Average Daily Range (ADR) exhaustion and dynamic Gann Support/Resistance zones.
-
Directional Bias: Auto-calculates a clear directional bias (Long, Short, or Neutral) based on a confluence of EMA stacks, FVGs, and liquidity.
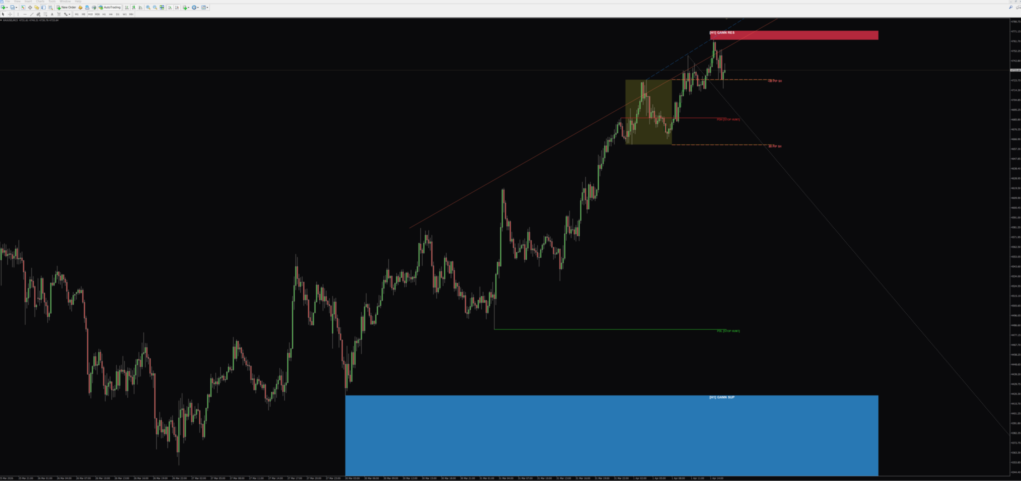
One-Click Auto-Markup Engine Spot a high-probability setup on the dashboard? Click "Open Chart & Markup." The engine will instantly spawn a fresh M15 chart and automatically draw:
-
Gann Zones: Projects H1 & H4 Gann Support/Resistance boxes.
-
Asian Session Box: Highlights the Asian range with projected +25 and +50 pip Stop Hunt lines.
-
Liquidity Rays: Exact levels for PDH, PDL, PWH, and PWL.
-
Smart Trendlines & S/R: Auto-draws multi-timeframe trendlines (M15, H1, H4) and finite Support & Resistance rays.
-
Weekly ADR Targets: Plots the projected Weekly ADR exhaustion levels.
Professional UI Features
-
Draggable & Minimized Mode: A sleek, dark-mode fintech interface that can be dragged anywhere on your screen or minimized to keep your chart clean.
-
Pagination: Monitor dozens of pairs seamlessly across multiple pages.
-
Custom Watchlist: Scan your entire broker Market Watch, or enter a manual comma-separated list (e.g., EURUSD, GBPUSD, XAUUSD).
Important Note: This is an analytical Utility and Chart Markup tool. It does NOT execute trades automatically. It is designed to be the ultimate edge for your manual or semi-automated trading system.