PZ Support Resistance
- 지표
- PZ TRADING SLU
- 버전: 7.0
- 업데이트됨: 19 7월 2024
- 활성화: 20
Unlock key market insights with automated support and resistance lines
Special Offer: Purchase now to receive free bonuses worth $75! (Read more for details)
[ Installation Guide | Update Guide | Troubleshooting | FAQ | All Products ]
- Boost your technical analysis
- Customizable timeframe selection
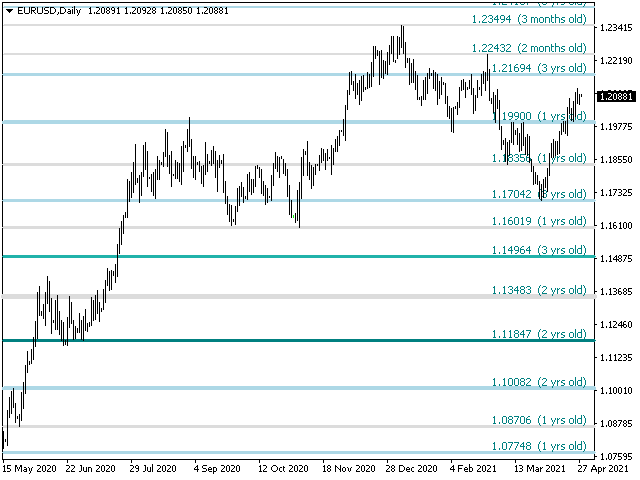
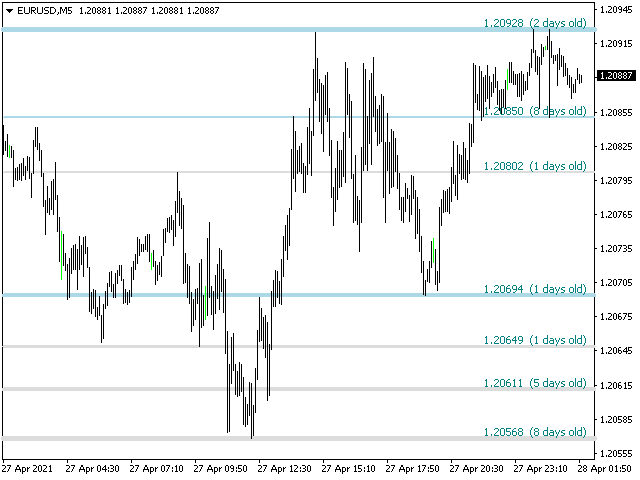
- Read price levels from the timeframe of your choosing
- Detect important price levels without browsing through charts
- Recognize the relative strength of all price levels at a glance
- Save up to half an hour of plotting lines for every trade
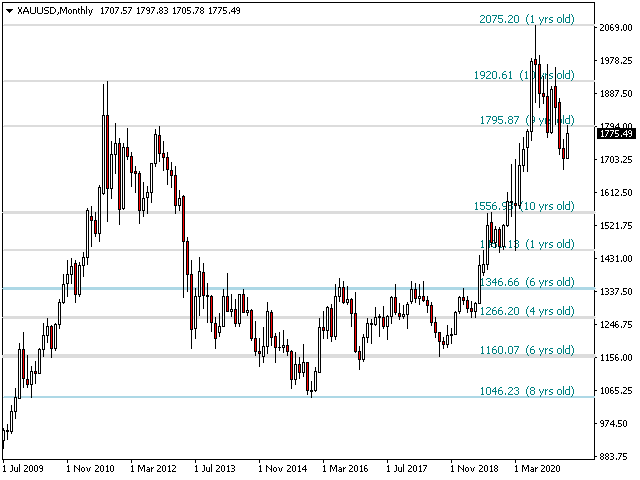
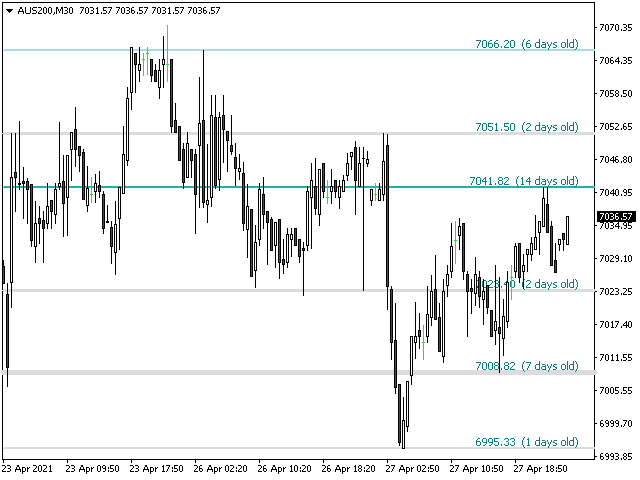
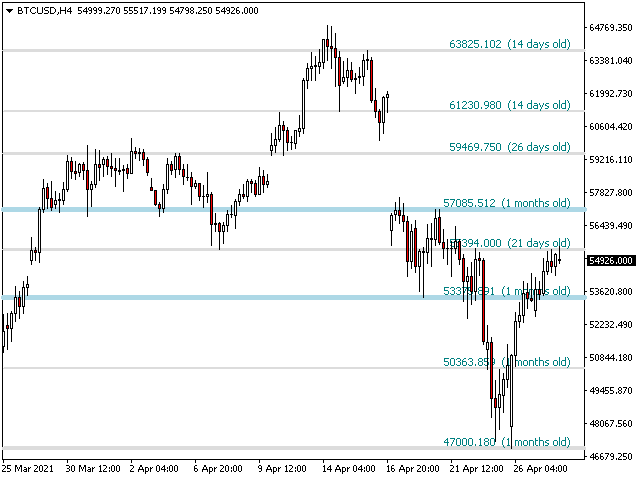
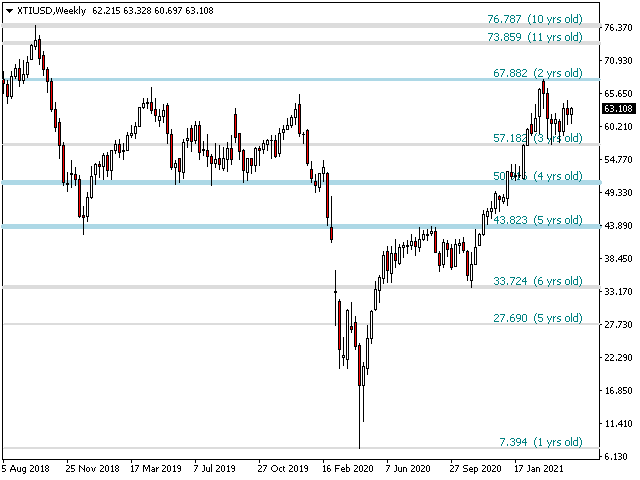
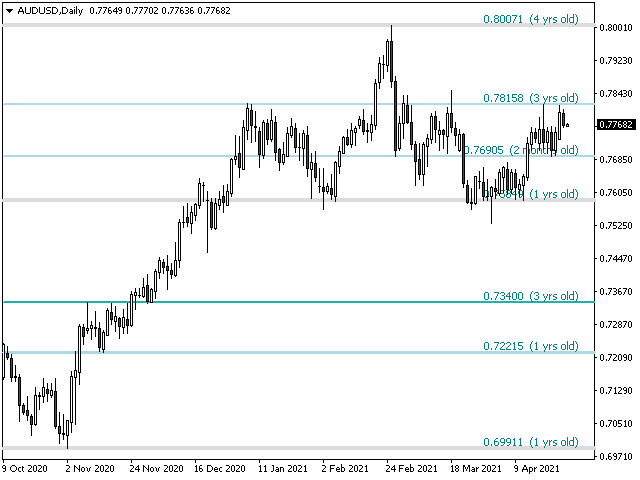
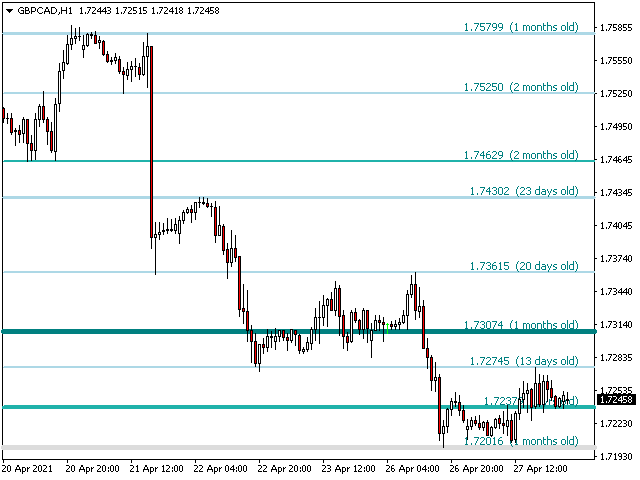
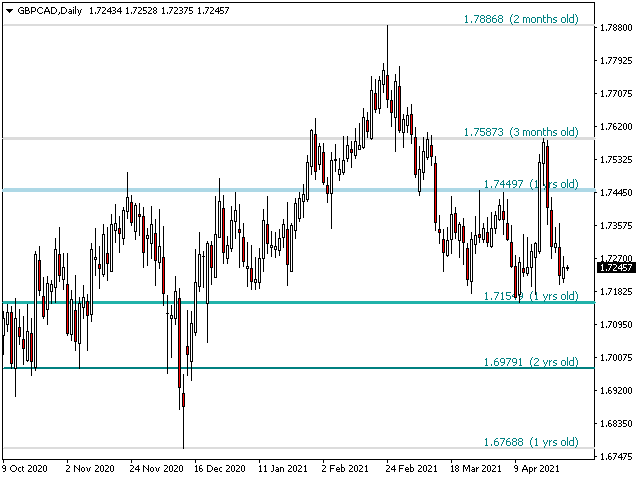
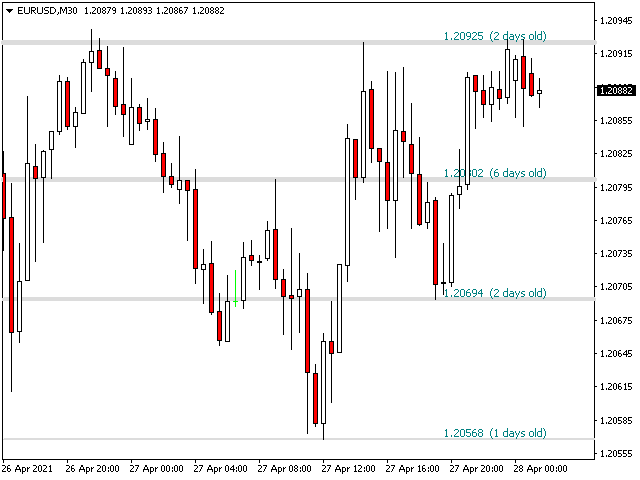
- The indicator displays the age of all price levels
Price levels are collapsed by proximity and adjusted to the current market action.
- Price levels get darker and wider as they get rejected over time
- Unimportant price levels are cleared regularly to avoid noise
- It implements email/sound/push alerts for breakouts and false breakouts
Input Parameters
- Timeframe: Choose the period to read price data from. Can be current or higher.
- Period: Zigzag period used to read price points from. Zero means the indicator will choose the best period.
- ATR Period: ATR period used to collapse prices by proximity.
- ATR Multiplier: ATR multiplier used to collapse prices by proximity. A higher value will produce less lines.
- Max History Bars: Amount of past bars to iterate in the indicator finding prices.
- Color Settings: Enter your desired colors for support and resistance lines based on importance.
- Label Settings: Display or hide age labels and customise colors and sizes.
- Alerts: Enable display/email/push/sound alerts for breakouts and fake breakouts.
Buy today and unlock exclusive bonuses!
- PZ Supply Demand Indicator (worth $75)
To claim these bonuses, simply send me a private message. I will provide the bonuses to actual buyers of the indicator. To ensure it is you, please leave a review for the product first, or alternatively, provide the mql5 operation number of your purchase. I'll get back to you with your bonuses as soon as possible.
The price of this indicator might increase next week!
We've introduced dynamic pricing for this indicator to reflect its true market value. With each sale, the price increases by $1, rewarding early buyers. If no sales occur within a week, the price resets to the original rate, with prices updated every Monday. This model lets the market decide the product's value, but there’s always a chance to grab your desired tools at a cheaper price if you prefer to wait.
Author
Arturo López Pérez, private investor and speculator, software engineer and founder of Point Zero Trading Solutions.
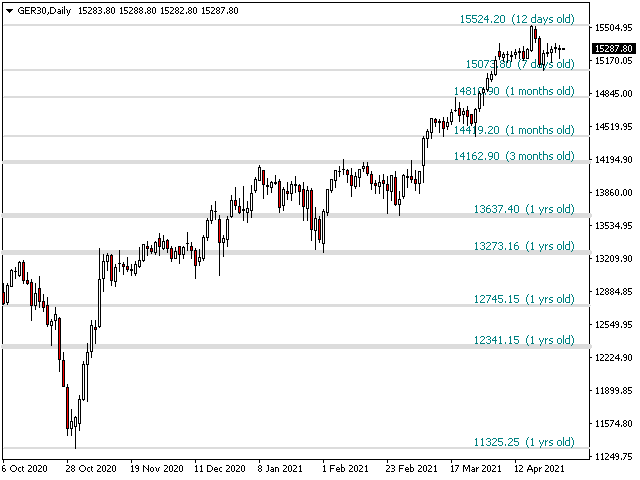
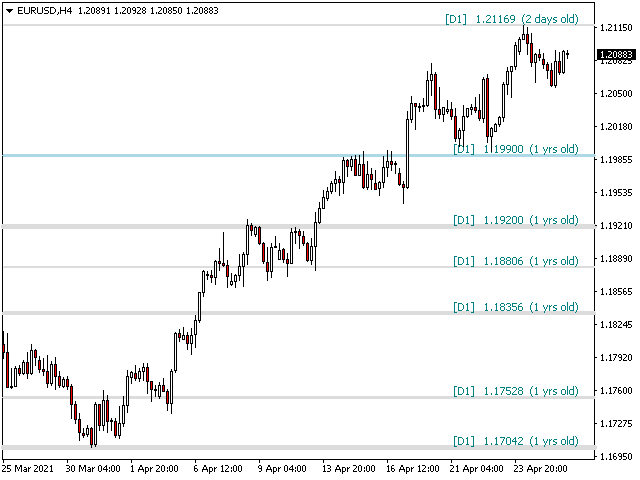


At D1 it works quite well.