PZ Support Resistance
- 지표
- PZ TRADING SLU
- 버전: 7.0
- 업데이트됨: 19 7월 2024
- 활성화: 20
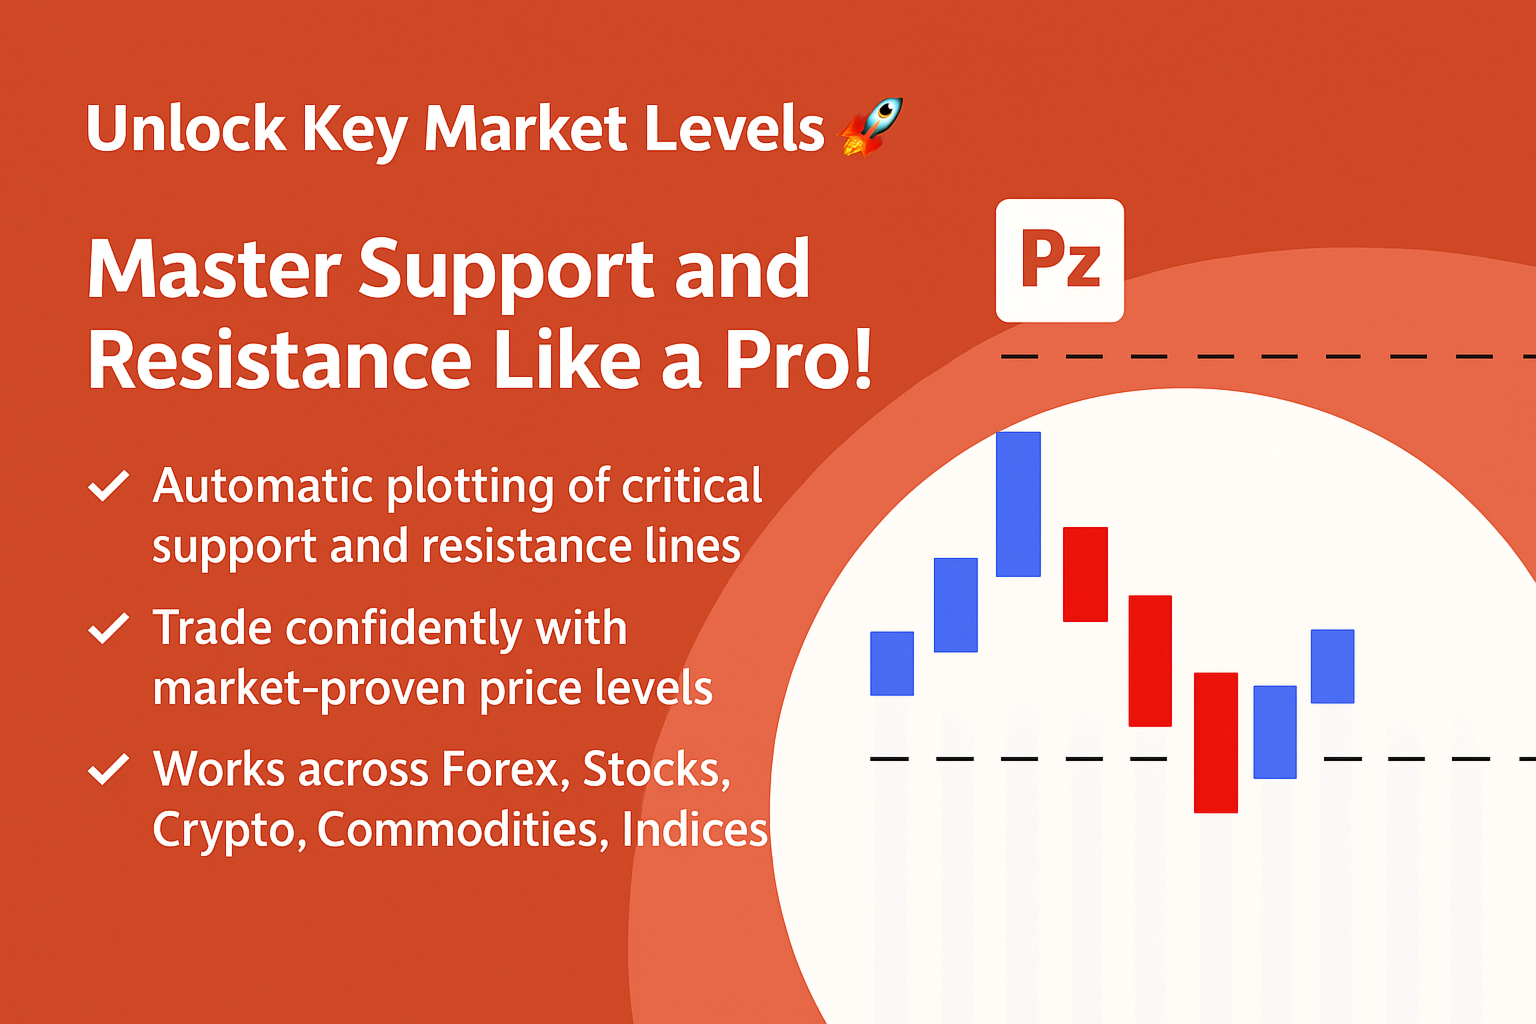
Unlock key market insights with automated support and resistance lines
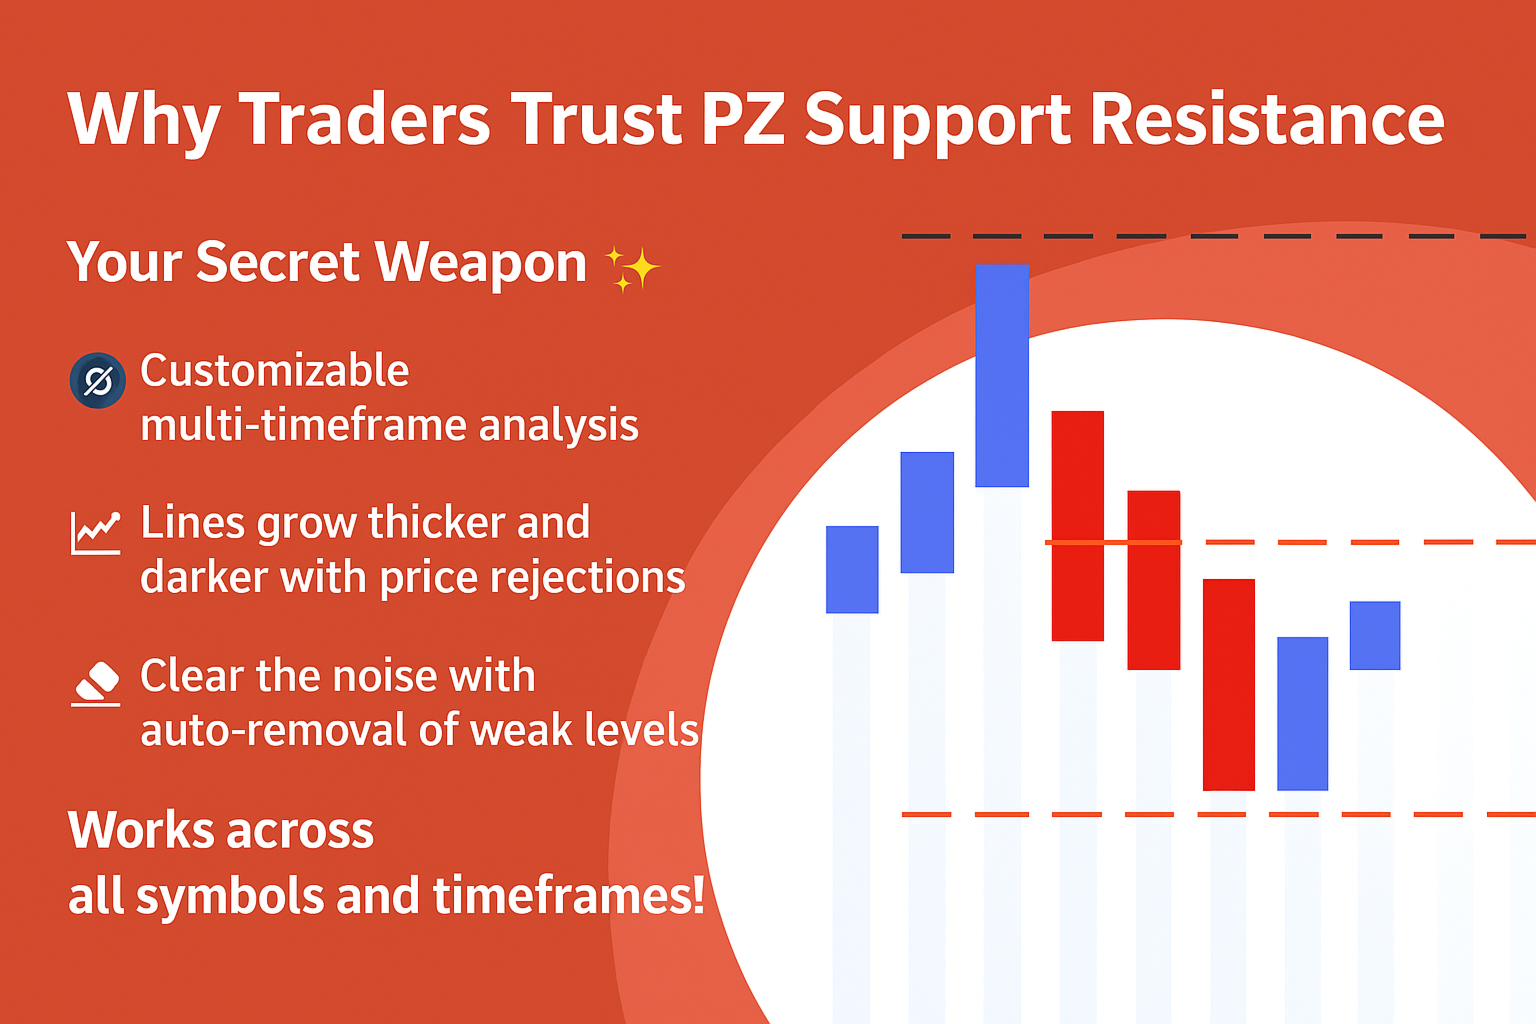
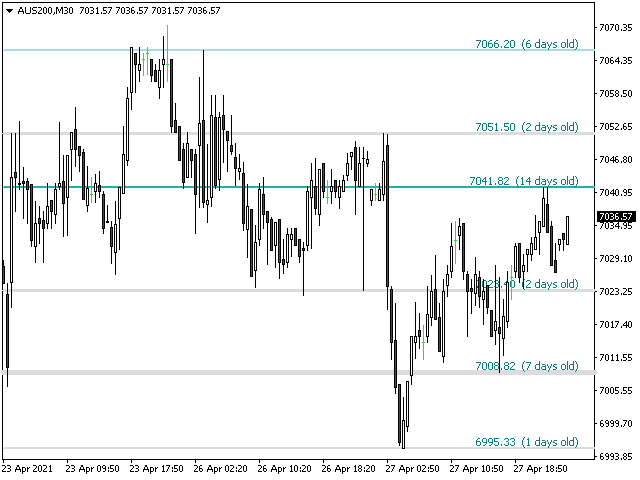
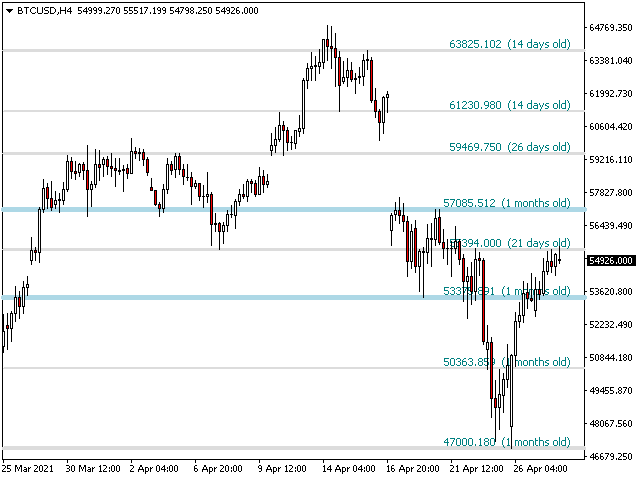
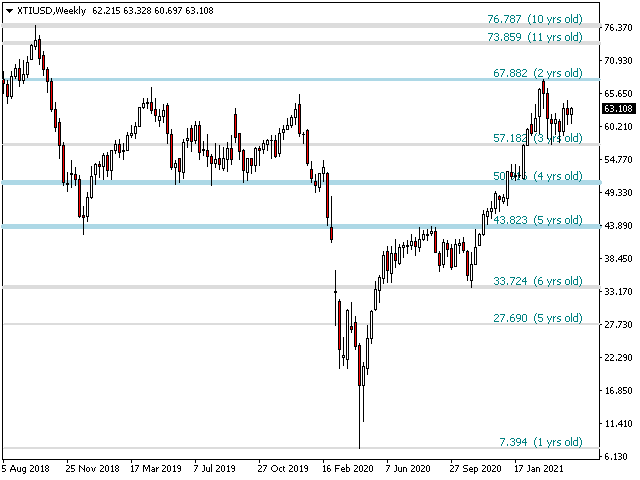
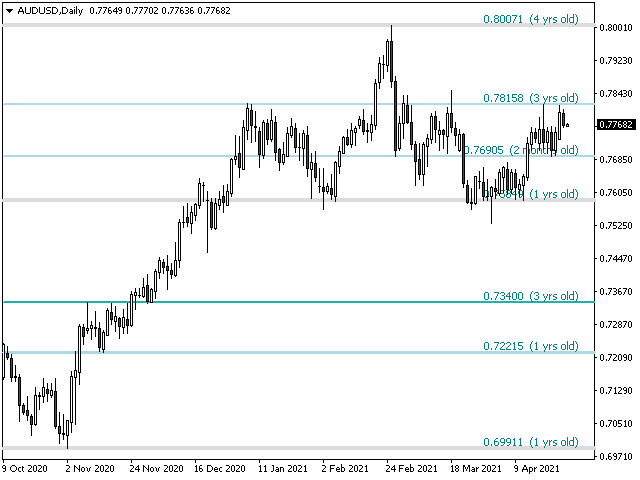
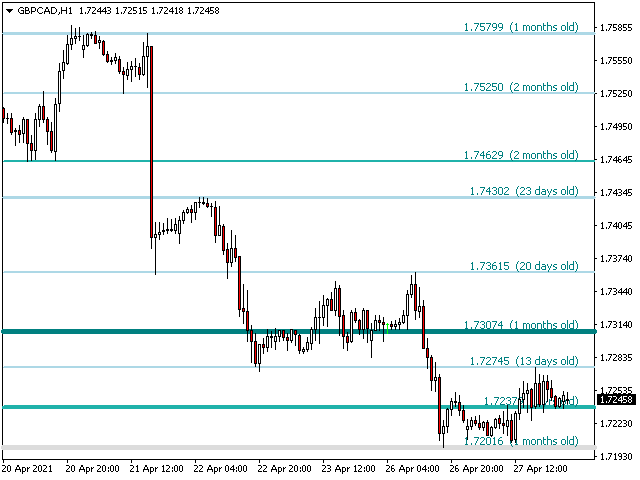
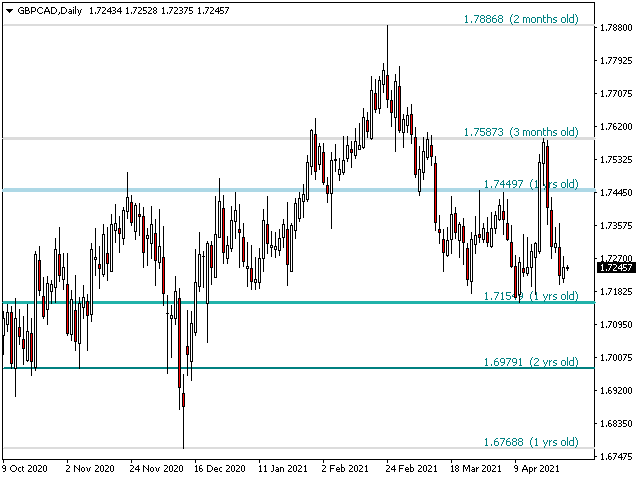
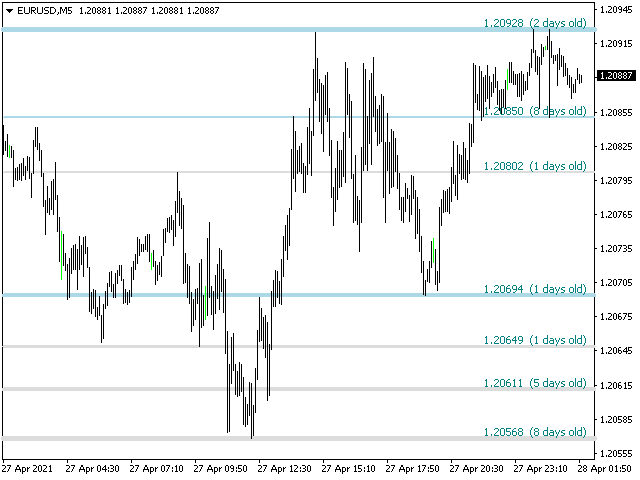
Tired of plotting support and resistance lines? This is a multi-timeframe indicator that detects and plots supports and resistance lines in the chart with the same precision as a human eye would. As price levels are tested over time and its importance increases, the lines become thicker and darker, making price leves easy to glance and evaluate.
[ Installation Guide | Update Guide | Troubleshooting | FAQ | All Products ]
- Boost your technical analysis
- Customizable timeframe selection
- Read price levels from the timeframe of your choosing
- Detect important price levels without browsing through charts
- Recognize the relative strength of all price levels at a glance
- Save up to half an hour of plotting lines for every trade
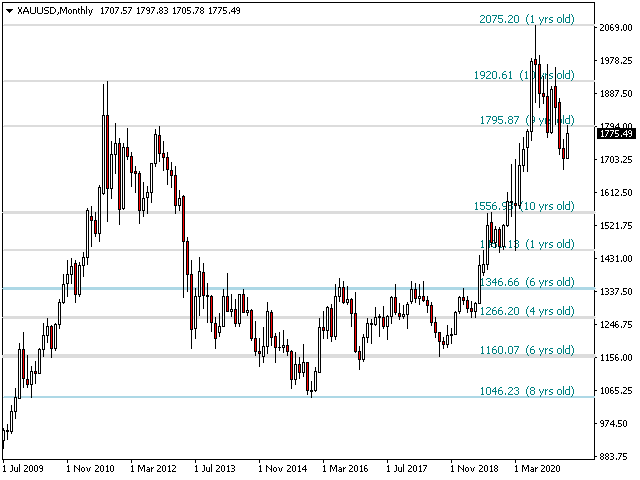
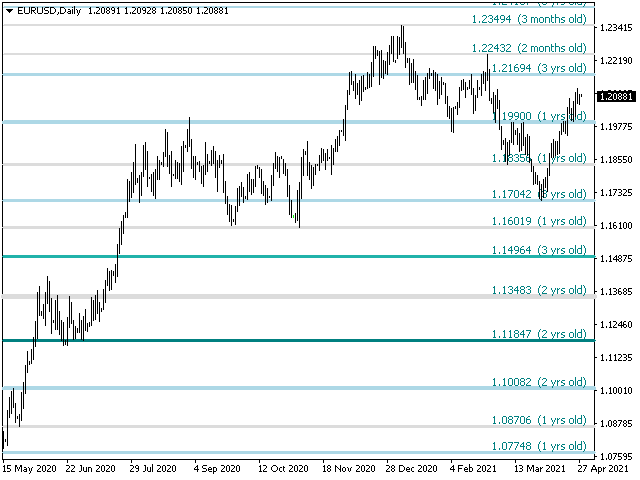
- The indicator displays the age of all price levels
Price levels are collapsed by proximity and adjusted to the current market action.
- Price levels get darker and wider as they get rejected over time
- Unimportant price levels are cleared regularly to avoid noise
- It implements email/sound/push alerts for breakouts and false breakouts
Input Parameters
- Timeframe: Choose the period to read price data from. Can be current or higher.
- Period: Zigzag period used to read price points from. Zero means the indicator will choose the best period.
- ATR Period: ATR period used to collapse prices by proximity.
- ATR Multiplier: ATR multiplier used to collapse prices by proximity. A higher value will produce less lines.
- Max History Bars: Amount of past bars to iterate in the indicator finding prices.
- Color Settings: Enter your desired colors for support and resistance lines based on importance.
- Label Settings: Display or hide age labels and customise colors and sizes.
- Alerts: Enable display/email/push/sound alerts for breakouts and fake breakouts.
Author
Arturo López Pérez, private investor and speculator, software engineer and founder of Point Zero Trading Solutions.
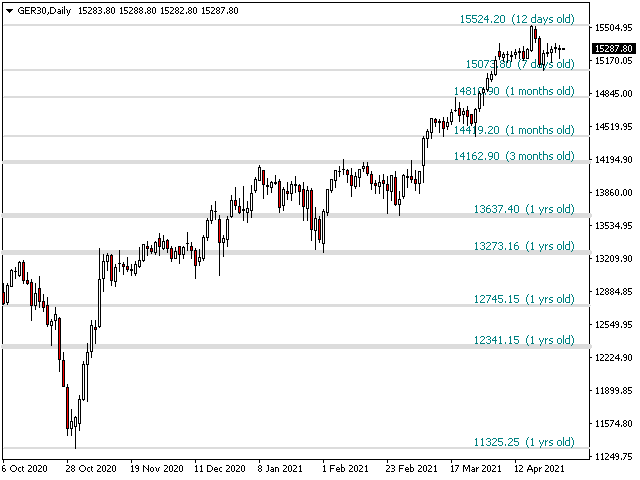


At D1 it works quite well.