MACD Geisha
- 지표
- Yuji Hiiragi
- 버전: 2.10
- 활성화: 20
ダイバージェンス はオシレーター系のテクニカル指標が、実際の相場とは逆方向に向かって動いている状態のことを指し、その後のトレンド転換の可能性を示す戦略として有効です。
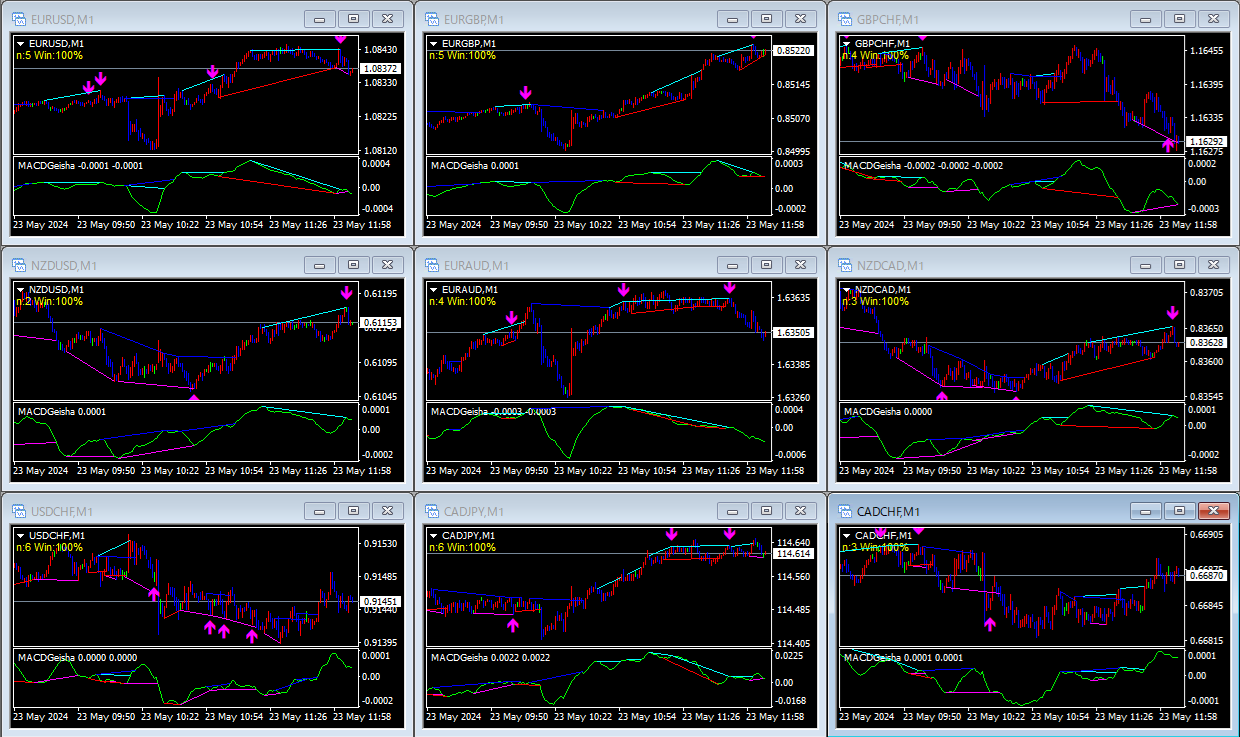
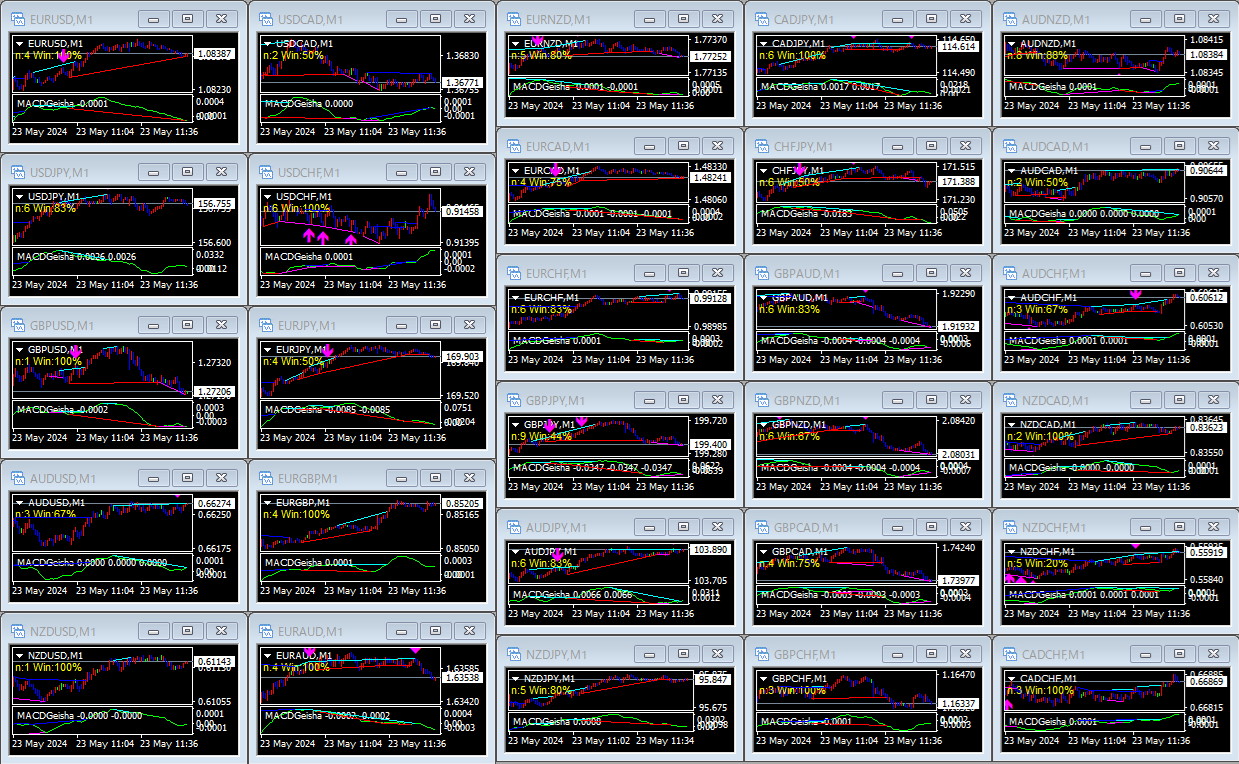
このインディケータは特に有効性の高いMACDのダイバージェンスを利用した裁量トレード用サインツールです。
高頻度かつ高い勝率でサインを発信しますが、各種の強力なフィルターにより、さらに精度の高いサインに絞ることが出来ます。また、通常のダイバージェンスに加えリバーサル( 隠れダイバージェンス) によるサイン発信も可能です。
全通貨ペア、全タイムフレームで利用できます。勝敗判定機能により、このインディケータの直近の相場環境に対する有効性を確認できます。
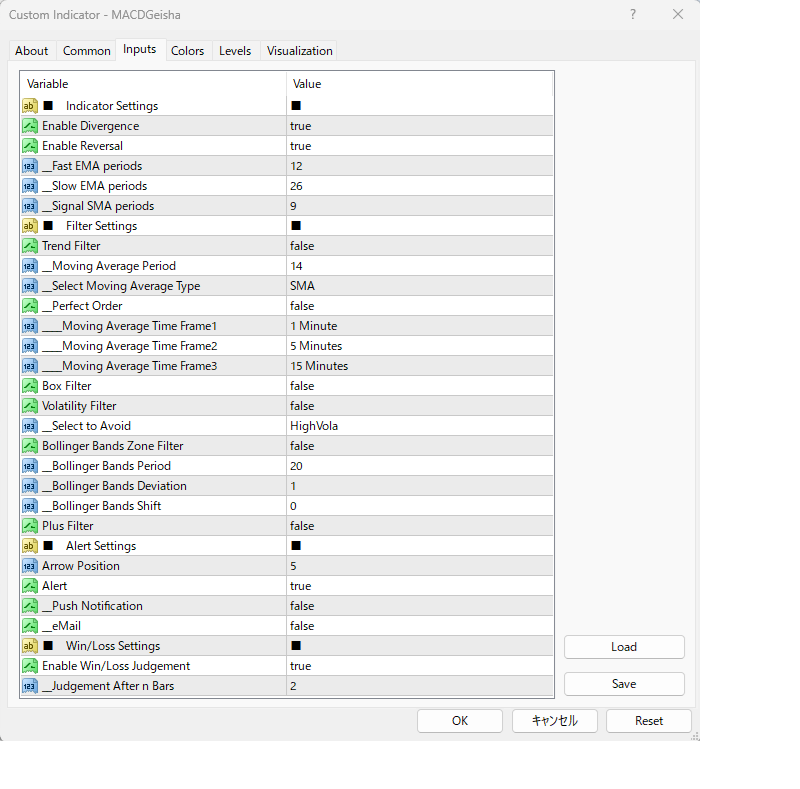
設定項目は以下の通りです。
- Enable Divergence...MACDのDivergenceによるサインの発信を有効にします。ピンクの矢印が表示されます
- Enable Reversal...MACDのReversal(Hidden Divergence)によるサインの発信を有効にします 。ブルーの矢印が表示されます
- Fast EMA Periods...以下でMACDのパラメーターを指定します
- Slow EMA Periods
- Signal SMA Periods
- Trend Filter...以下で設定する移動平均のトレンド方向でのシグナルに限定します
- Moving Average Period
- Moving Average Type...SMA,EMA,SMMA,LWMAより指定できます
- Perfect Order...下記の3つのタイムフレームの移動平均の向きが一致している場合にシグナルを限定します
- Moving Average Time Frame1
- Moving Average Time Frame2
- Moving Average Time Frame3
- Box Filter ... パーフェクト・オーダーが発生していない状態をボックス相場と判定し、 シグナル を限定します
- Volatility Filter...下で設定したボラティリティーの状況により シグナル を限定します
- High/Low...Highはボラティリティーが基準値より高い場合に シグナル を限定します。Lowはその逆です
- Level... ボラティリティーの高低を判定する基準値です
- Bollinger Bands Zone Filter...価格が下で設定したボリンジャーバンドより低い場合に買い、高い場合に売るようにサインを限定します
- Bollinger Bands Period
- Bollinger Bands Deviation
- Bollinger Bands Shift
- Plus Filter (Rebound mode only)...独自のアルゴリズムによりサインを限定します
- Enable Win/Loss Judgement...下の設定に従って勝敗を判定します
- Judgement After n Bars
- Count Bars ...動作を軽くするために計算するバーの数を限定します。長期間のテストで問題が生じる場合は数を増やしてください
- Arrow Position...矢印サインの表示位置を調整できます
- Sound Alert...3つのタイプのアラートを設定できます
- eMail Alert
- Push Alert
注:勝敗判定機能は本来バイナリーオプションでの利用に適した機能ですが、FXのインディケータとしても利用価値があると考え装備しました。EAのバックテストと比べるとサンプル数が限られるのと、設定(特に勝敗判定のタイミング)に大きく依存するので参考程度とお考え下さい。
#MACD #Divergence #Geisha #Binary Option