Black Rock Secrets
- 지표
- Ivan Stefanov
- 버전: 1.0
- 활성화: 10
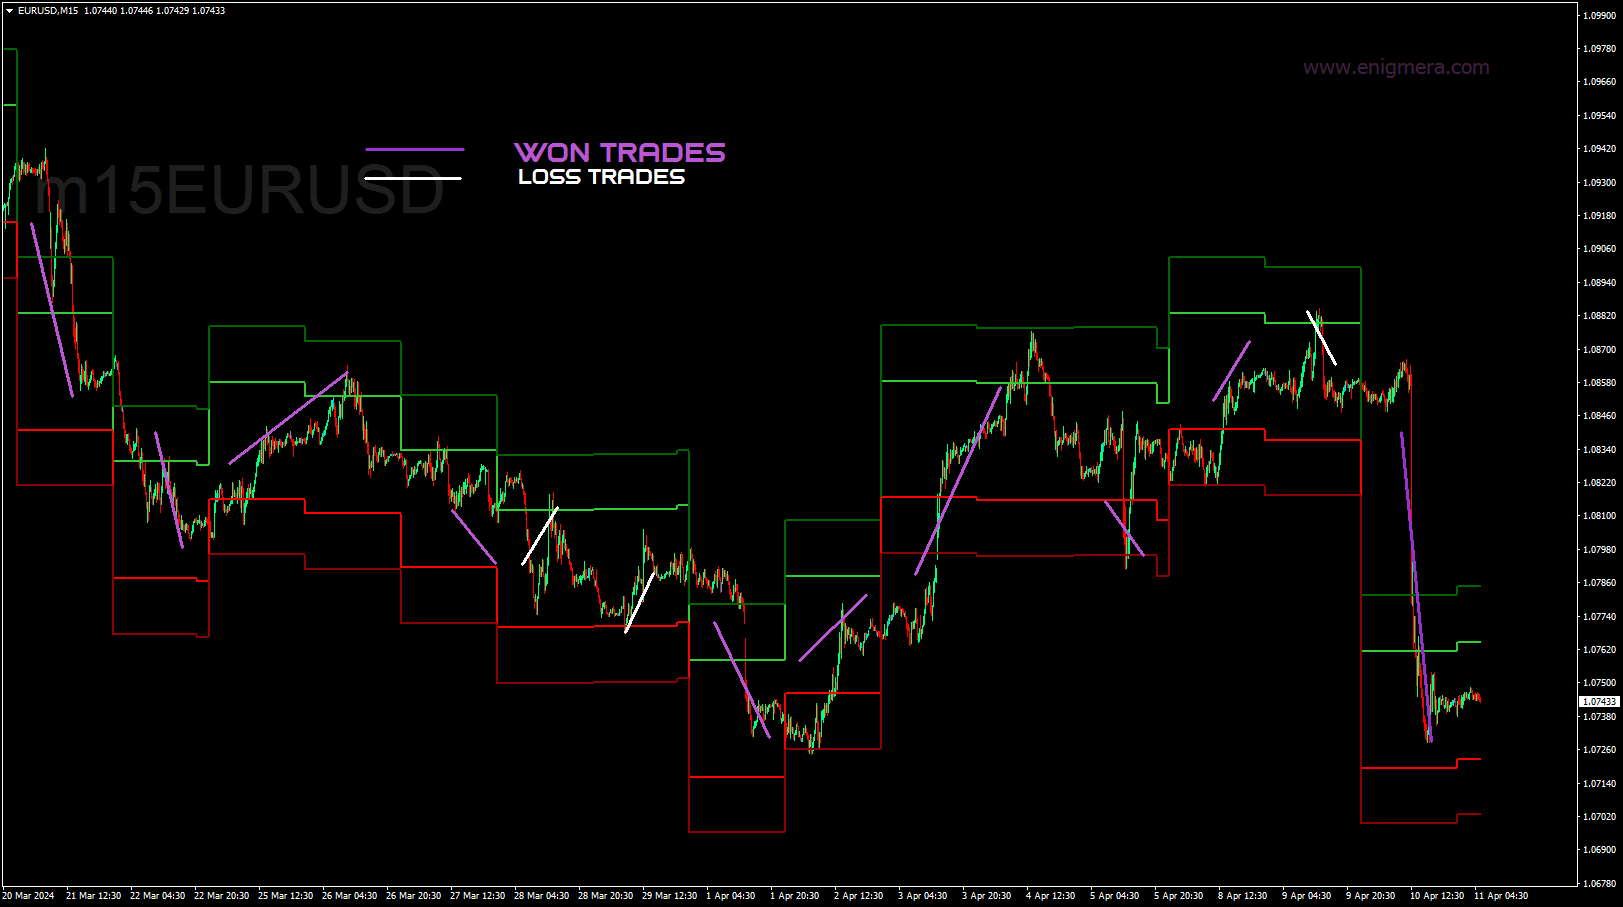
인디케이터는 매일 레벨을 그립니다.
어제의 녹색 영역에 진입하면 매수, 어제의 빨간색 영역에 진입하면 매도하세요.
20핍 스탑.
목표가는 20핍 이상입니다.
주문하고 기다리기만 하면 됩니다.
거래할 통화쌍:
EURUSD
GBPUSD
특별한 기술이 필요하지 않습니다. 알고리즘이 모든 것을 알아서 계산합니다.
성공률이 매우 높습니다. 간단하지만 효과적입니다!
인디케이터는 매일 레벨을 그립니다.
어제의 녹색 영역에 진입하면 매수, 어제의 빨간색 영역에 진입하면 매도하세요.
20핍 스탑.
목표가는 20핍 이상입니다.
주문하고 기다리기만 하면 됩니다.
거래할 통화쌍:
EURUSD
GBPUSD
특별한 기술이 필요하지 않습니다. 알고리즘이 모든 것을 알아서 계산합니다.
성공률이 매우 높습니다. 간단하지만 효과적입니다!