Atomic Analyst
- 지표
- Issam Kassas
- 버전: 20.10
- 업데이트됨: 28 3월 2024
- 활성화: 20
우선적으로 언급할 점은이 거래 지표가 다시 그리지 않고 지연되지 않으며 이를 통해 수동 및 로봇 거래 모두에 이상적이라는 점입니다.
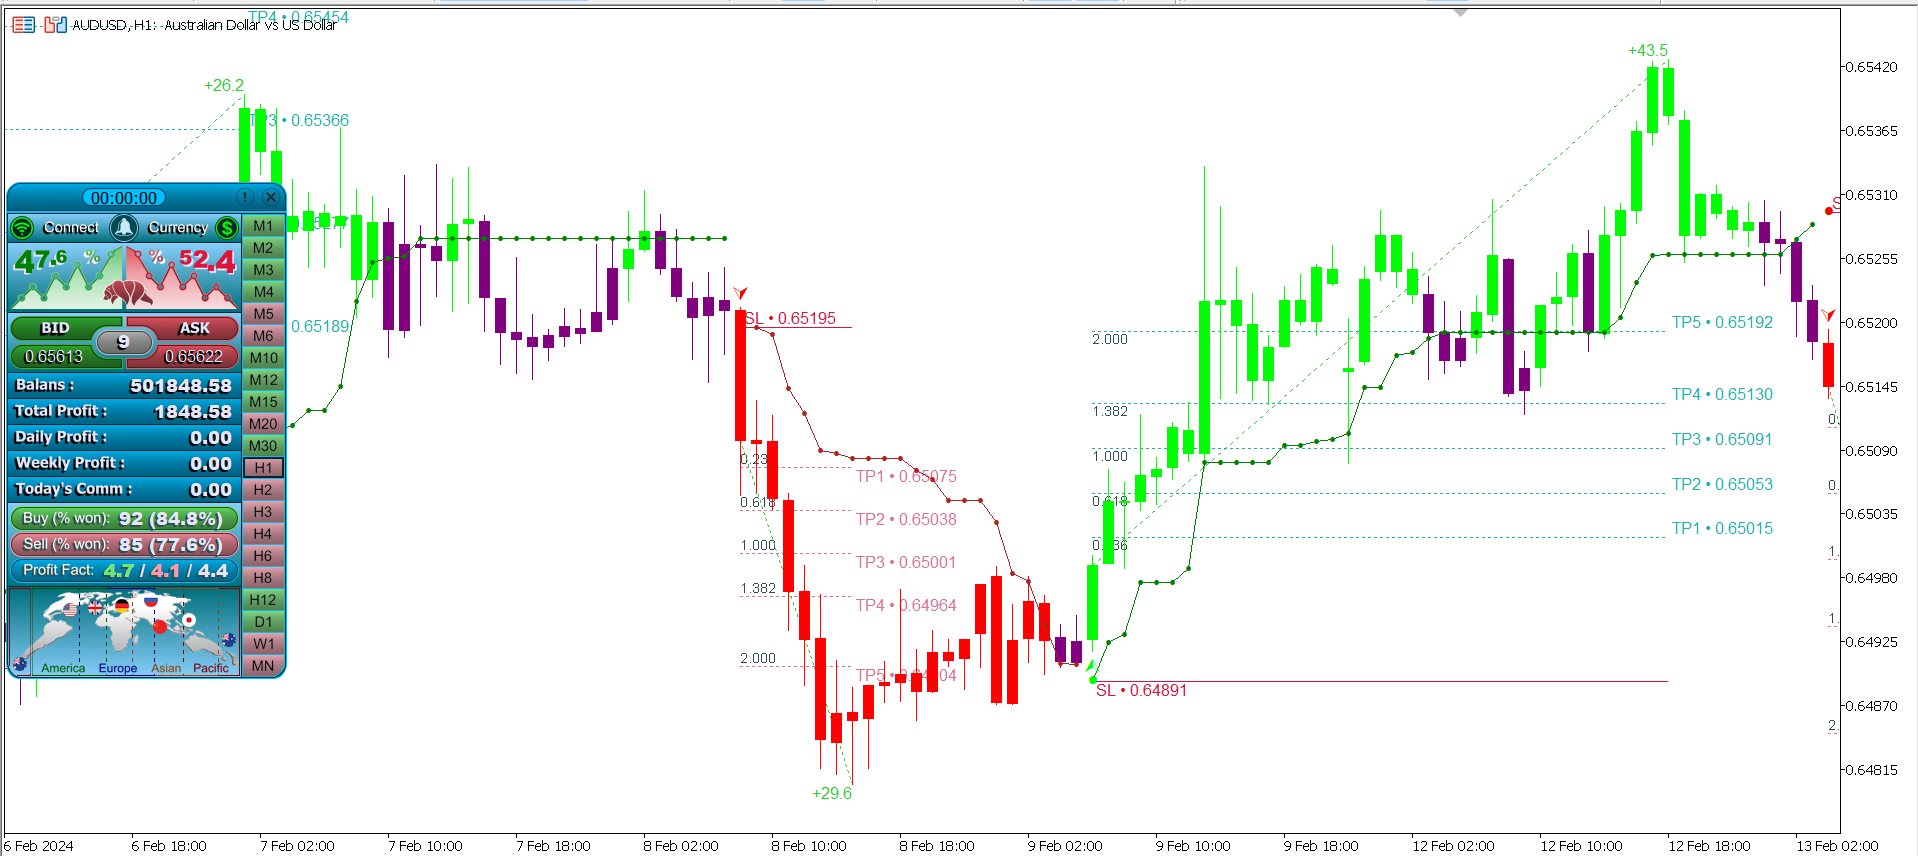
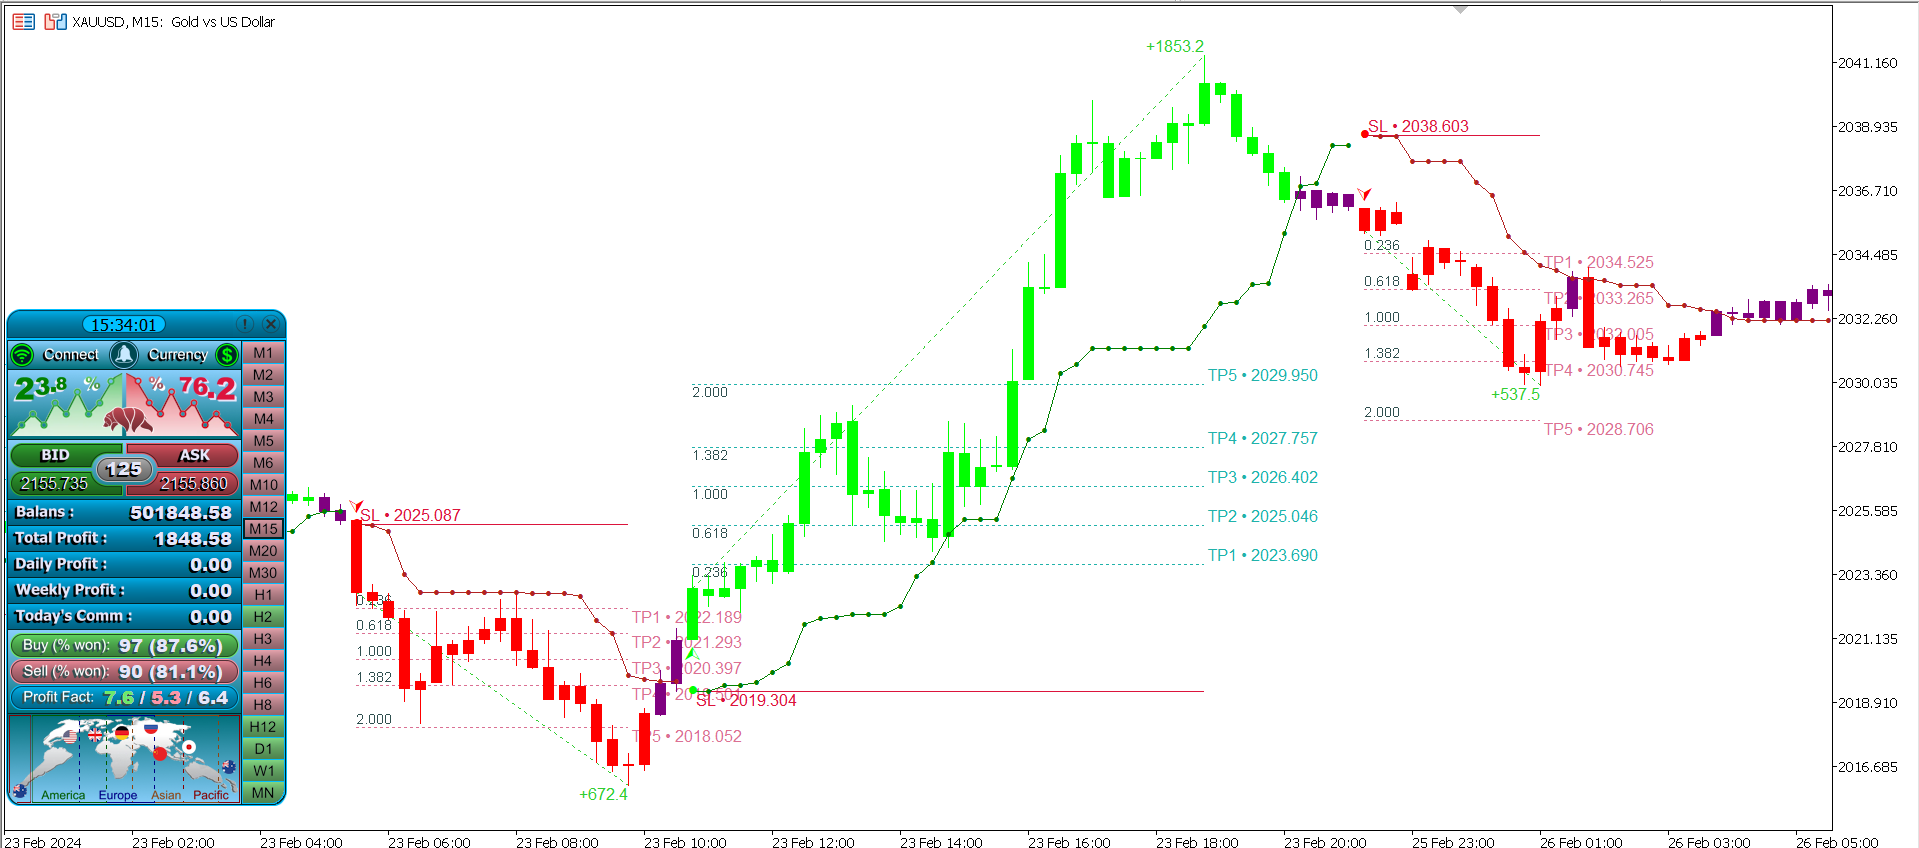
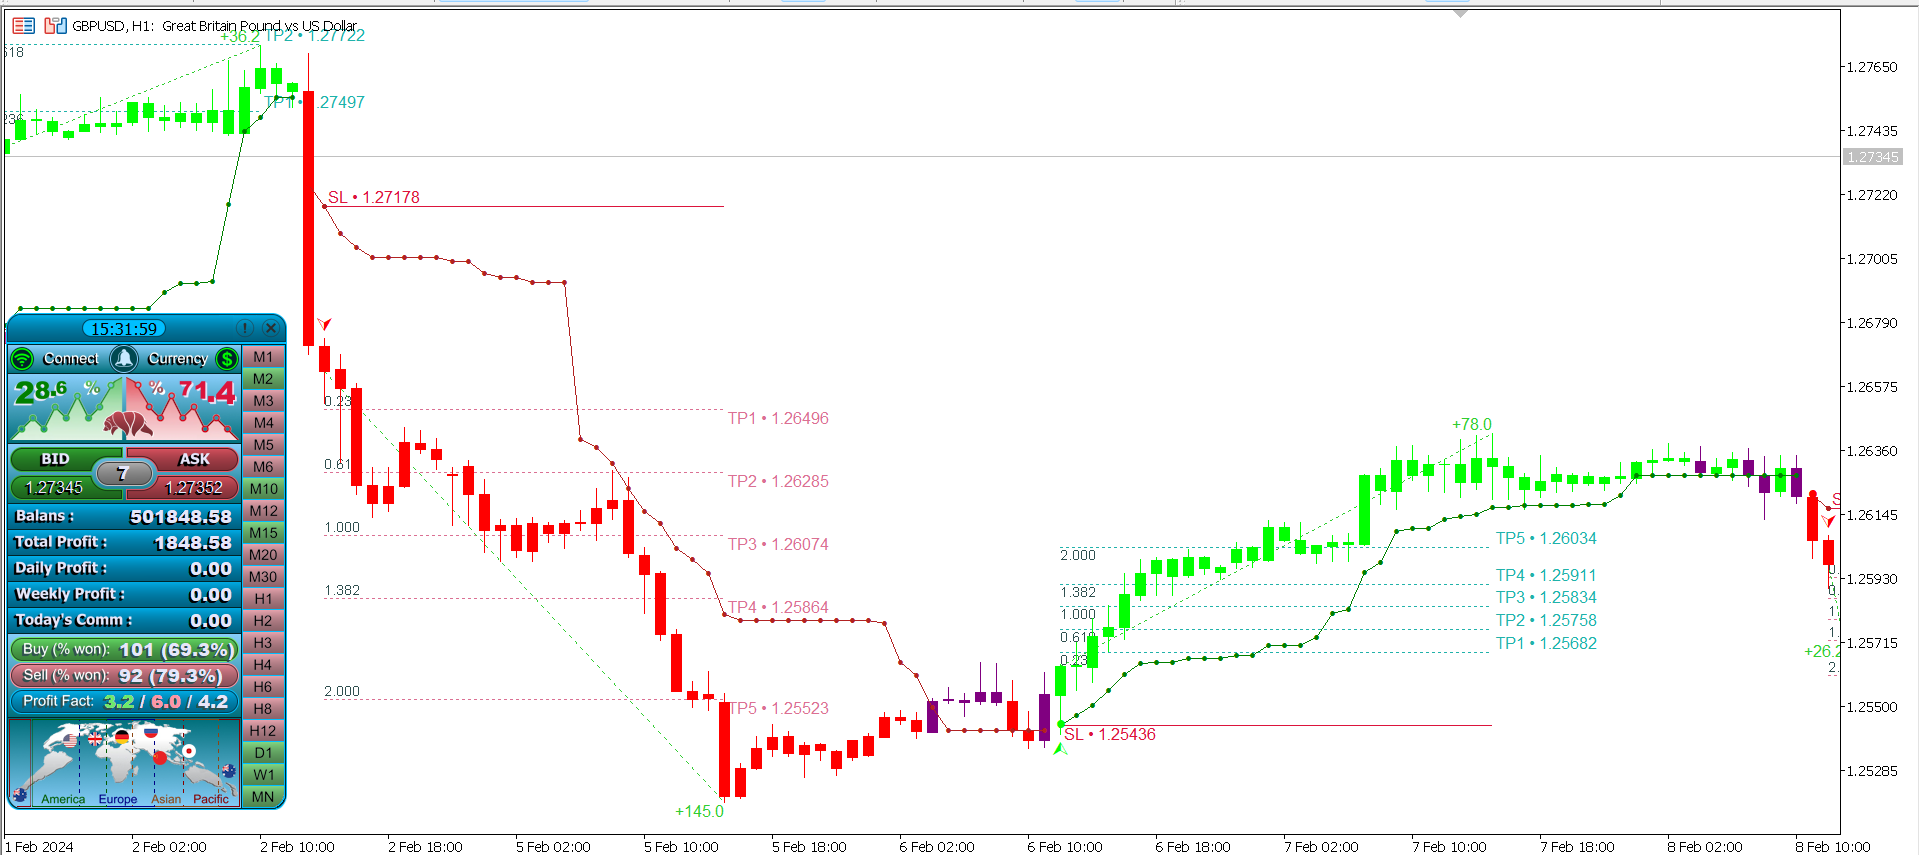
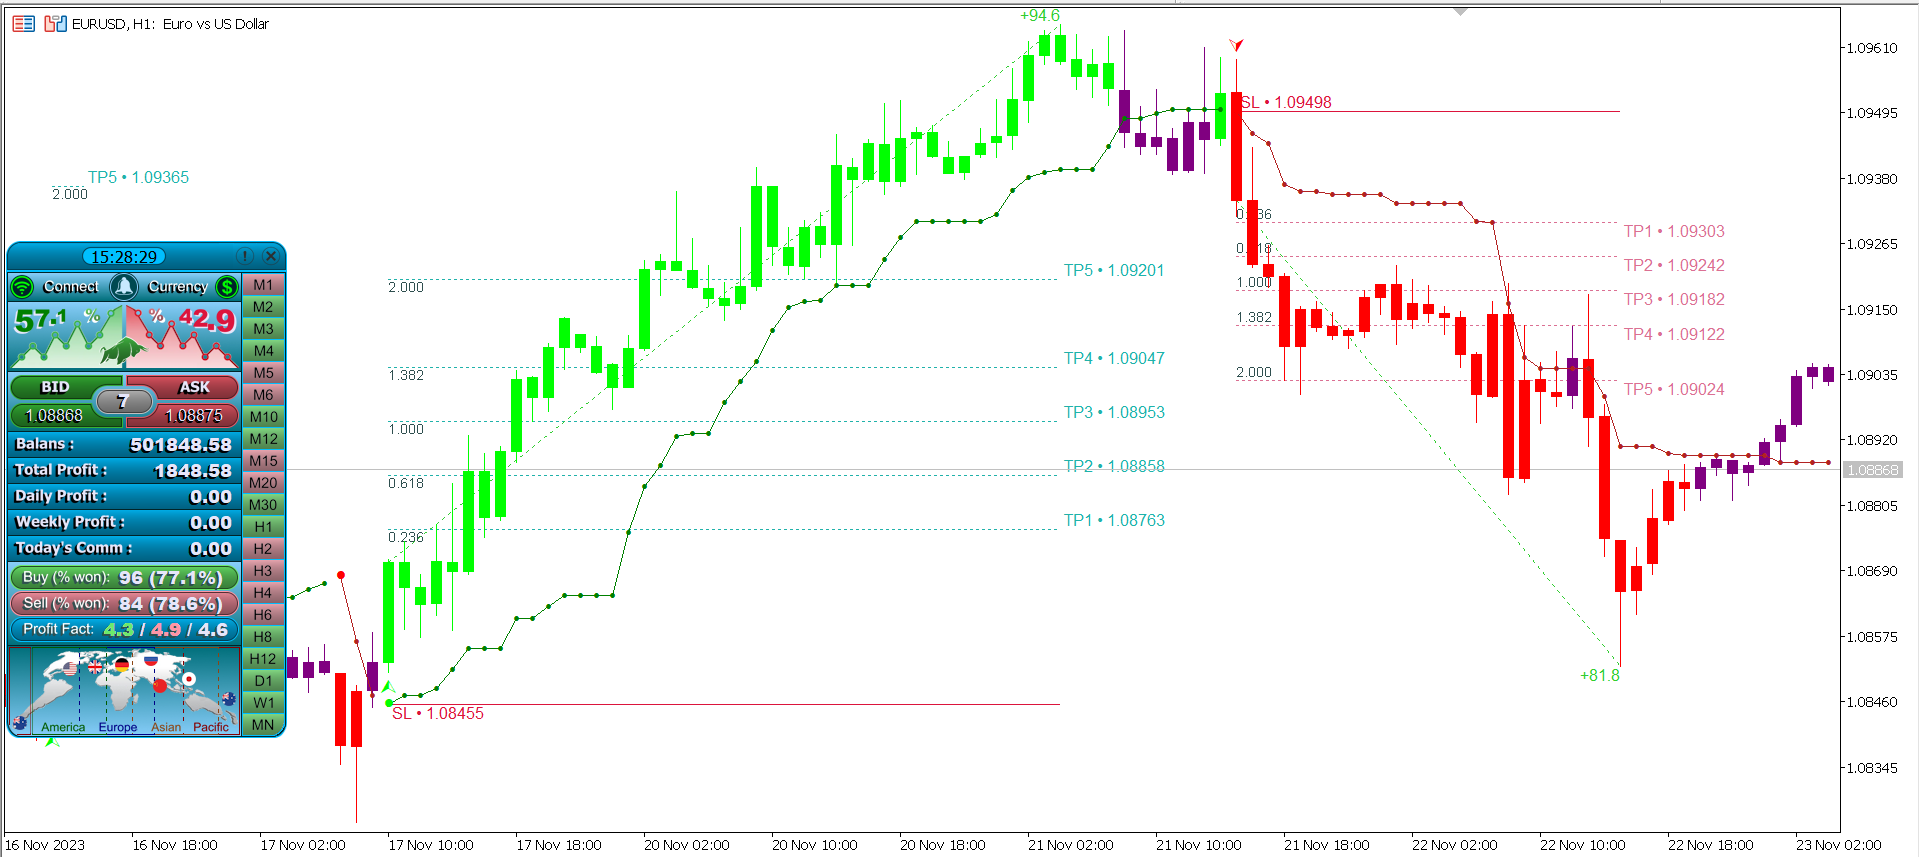
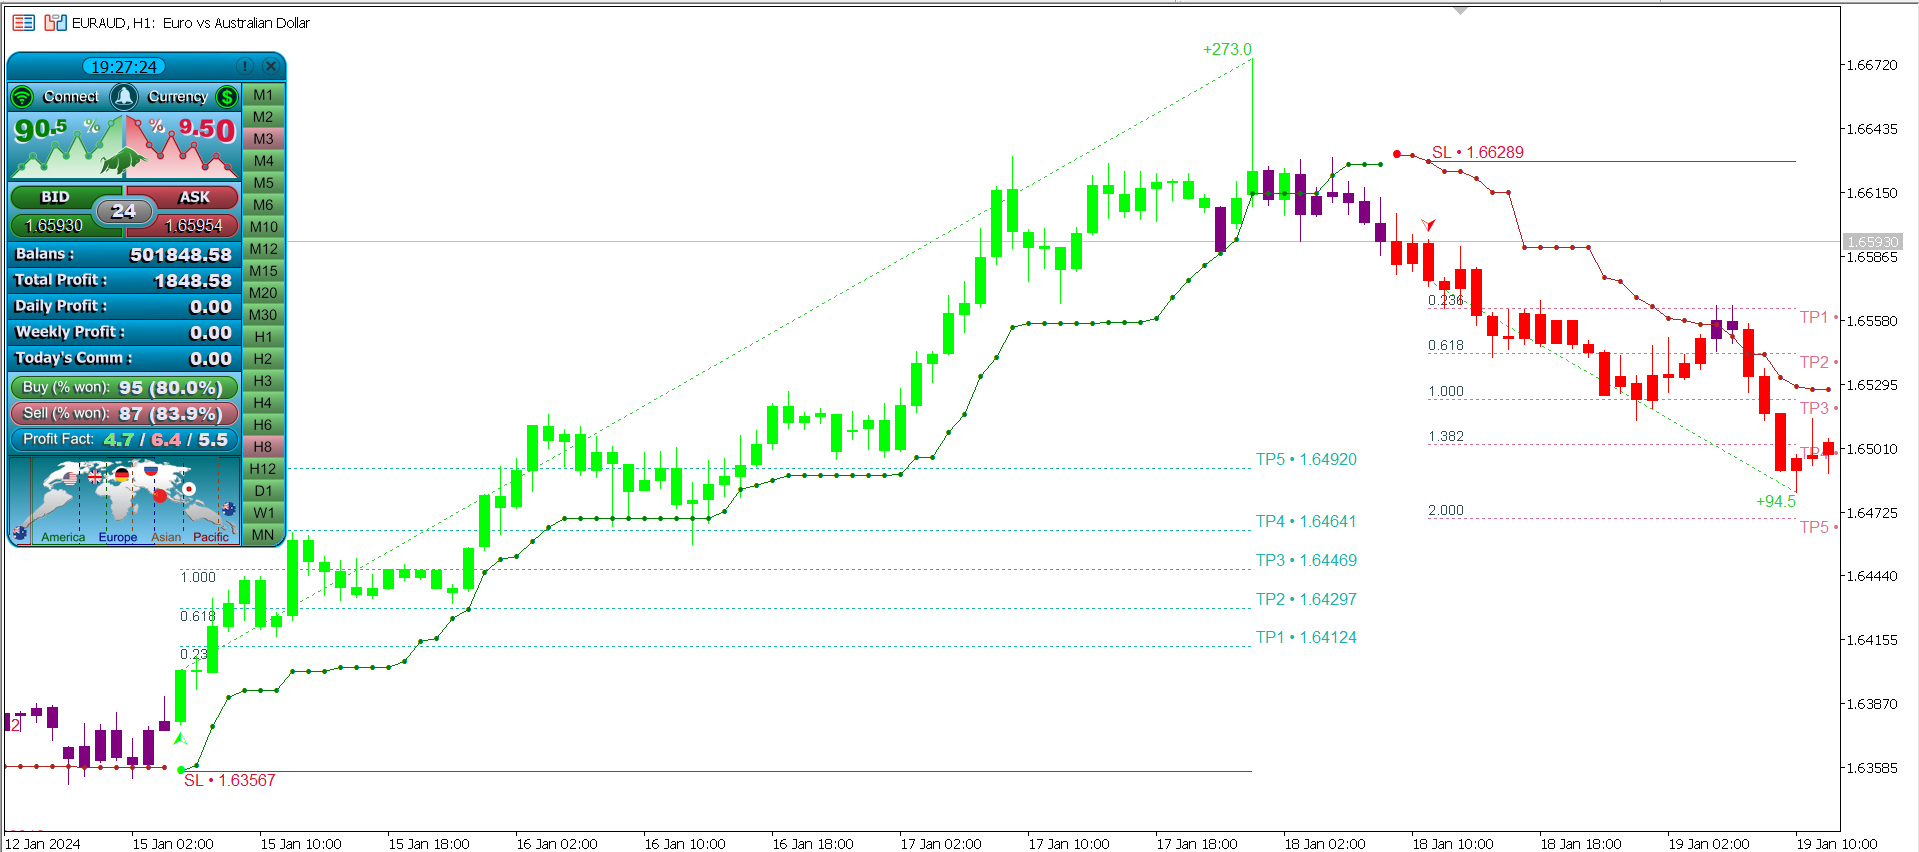
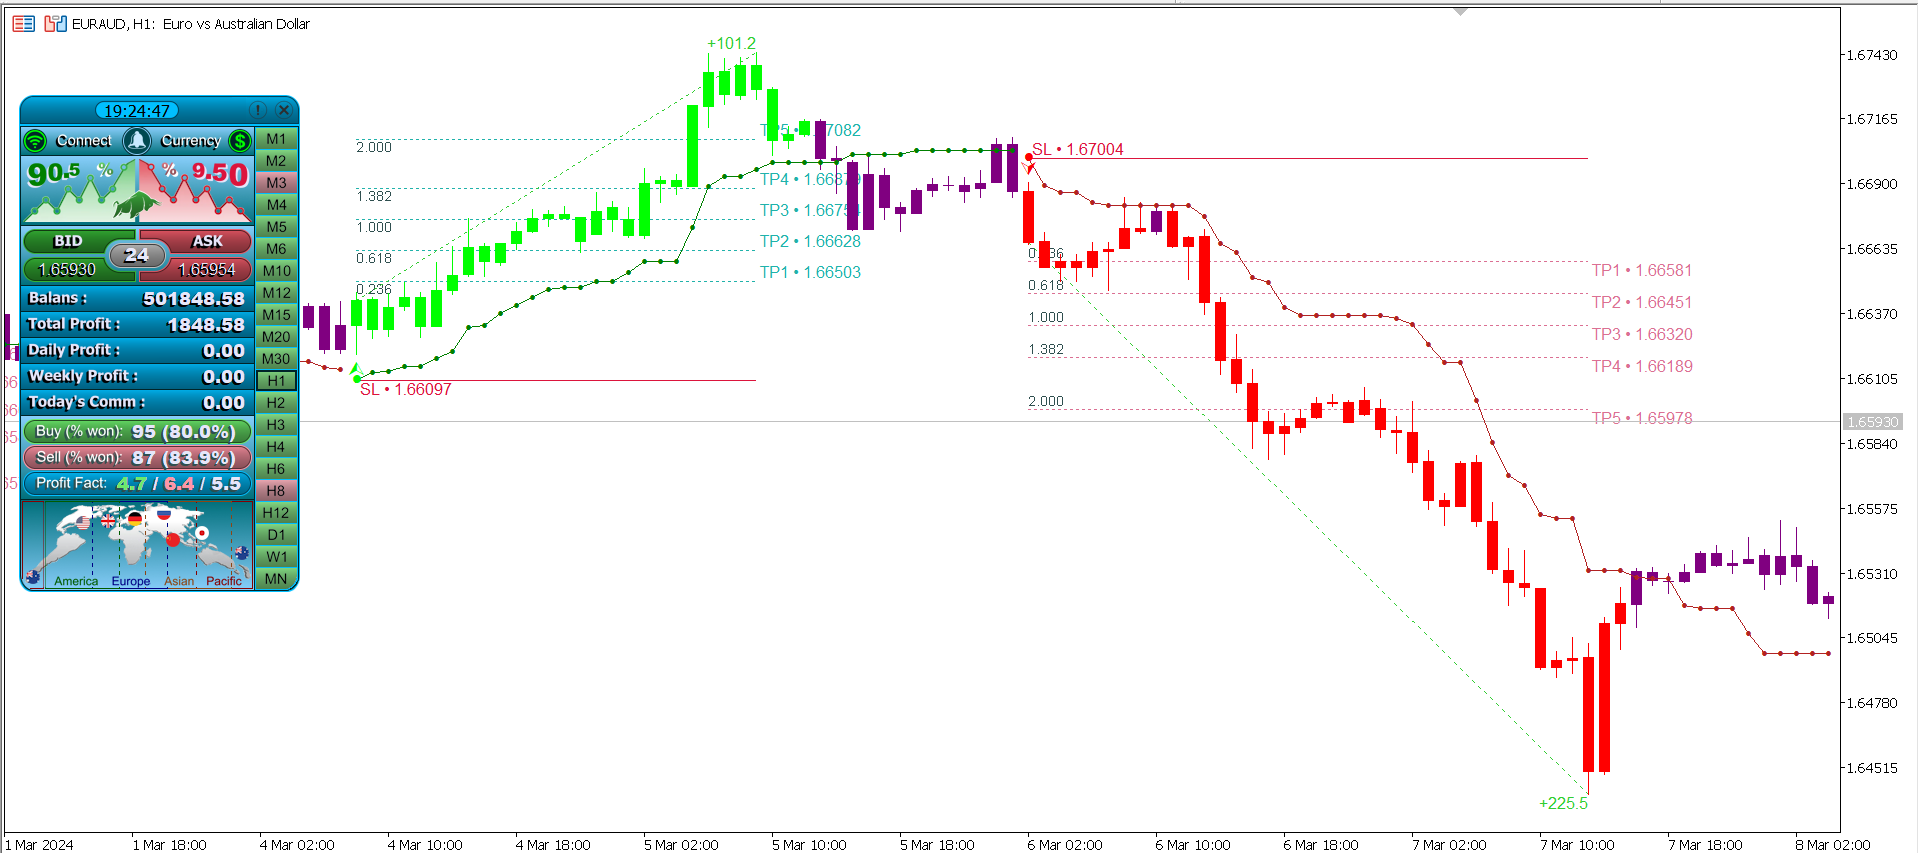
Atomic Analyst는 가격의 강도와 모멘텀을 활용하여 시장에서 더 나은 이점을 찾는 PA Price Action Indicator입니다. 고급 필터를 장착하여 잡음과 거짓 신호를 제거하고 거래 잠재력을 높이는 데 도움이 됩니다. 복잡한 지표의 다중 레이어를 사용하여 Atomic Analyst는 차트를 스캔하고 복잡한 수학적 계산을 간단한 신호와 색상으로 변환하여 초보 트레이더가 이해하고 일관된 거래 결정을 내릴 수 있도록합니다.
"Atomic Analyst"는 새로운 및 경험이 풍부한 트레이더를위한 종합적인 거래 솔루션입니다. 프리미엄 지표와 최고 수준의 기능을 하나의 거래 전략에 결합하여 모든 종류의 트레이더에 대한 다재다능한 선택지가되었습니다.
인트라데이 거래 및 스캘핑 전략 : 빠르고 정확한 일일 거래 및 단기 거래를 위해 설계되었습니다.
일일 및 스윙 거래 전략 : 가격의 큰 움직임을 목표로하는 일일 및 스윙 트레이더에게 신뢰할 수있는 도구로 사용할 수 있습니다.
다중 통화 및 시장 : 신뢰할 수있는 정확도로 다양한 기기 및 시장에서 작동합니다.
다중 시간대 : 좋은 성능으로 여러 시간대에서 사용할 수 있습니다.
안정성 : 모든 지표는 다시 그리지 않고 지연되지 않으므로 신뢰할 수있는 신호를 제공합니다.
신호의 명확성 : 명확한 진입 및 출구 지점을위한 화살표 신호를 제공합니다.
실시간 알림 : 거래 진입, SL 및 TP 알림으로 트레이더를 안내합니다.
다중 이익 실현 수준 : 피보나치를 사용하여 최대 8 개의 이익 실현 수준을 제공합니다.
심층 분석 : 고급 시간 프레임 트렌드 분석 및 실시간 거래 모니터링을 제공합니다.
적응형 색상 코딩 : 캔들 색상 코딩을 사용하여 가격의 힘과 모멘텀을 반영합니다.
현대적인 사용자 친화적 인 인터페이스 및 패널 : 전문 트레이더가 일상적으로 사용하는 모든 기본 및 고급 메트릭을 제공합니다.
특징 :
- 다시 그리지 않고, 다시 그리지 않고, 지연되지 않는 지표
- 최대 활성화
- MTF 트렌드 스캐너
- 현대적인 사용자 친화적 인 인터페이스 GUI
- 여러 인디케이터를 한 곳에 모두
- 인트라데이, 일일 및 스윙 거래 전략
- 프로 펌 준비 완료
- 진입 및 출구 지점 및 화살표
- 전화 및 이메일로 알림
- MTF 분석
- 모든 시간 프레임의 트렌드 % 계산
- 손실 제한
- 다중 이익 실현
- 트레일링 스탑
- 판매 거래 및 구매 거래
- 잠재적 이익 % 및 총 거래 수 표시
- 실시간 거래 시간 세션
- 실시간 일일, 주간 및 전체 이익
- 실시간 일일 수수료 계산
- 입찰 및 요청 가격 표시
- 실시간 스프레드 표시
- 캔들 타이머, 현지 시간 및 서버 시간
- 터미널 상태 연결/연결 끊김
- 계정 통화 표시
- 패널을 사용하여 시간대 변경
권장 사항 :
- 통화 및 페어 : EURUSD, AUDUSD, XAUUSD ...
- 시간 프레임 : H1.
- 계정 유형 : 모든 ECN 계정, 낮은 스프레드 계정.

Ho acquistato il tuo indicatore Atomic, vorrei avere maggiori dettagli per utilizzarlo al meglio grazie