• 미리보기
  • 리뷰
  • 코멘트

Angle Prices i5

The Angle Prices indicator is a tool that calculates the price angle based on price analysis, interpreting the time vector in the form of price points on the price chart. In other words, the X axis and Y axis are represented as price points, so you can actually calculate the angle with two axes of the same dimension. This allows traders to obtain information about the direction of price movement and possible entry or exit points for trades. Let's look at the main characteristics and interpretation of the signals of this indicator.

Main characteristics:
  • Price Angle: The indicator calculates the price angle based on the time vector associated with the price points on the chart. This helps determine the speed and direction of price movement.
  • Smoothing: The smoothing option allows you to average the angle value, which can make signals more stable and reduce noise.
  • Levels: The indicator displays levels for more convenient perception of signals and determination of intersections.
Signal interpretation:
  • Sell signal: When the angle line crosses the upper level from bottom to top, this can be considered a sell signal. Such a crossover indicates the possible start of a downward price movement.
  • Buy signal: Crossing the angle line of the lower level from top to bottom can be interpreted as a buy signal. This means the possible start of an upward price movement.
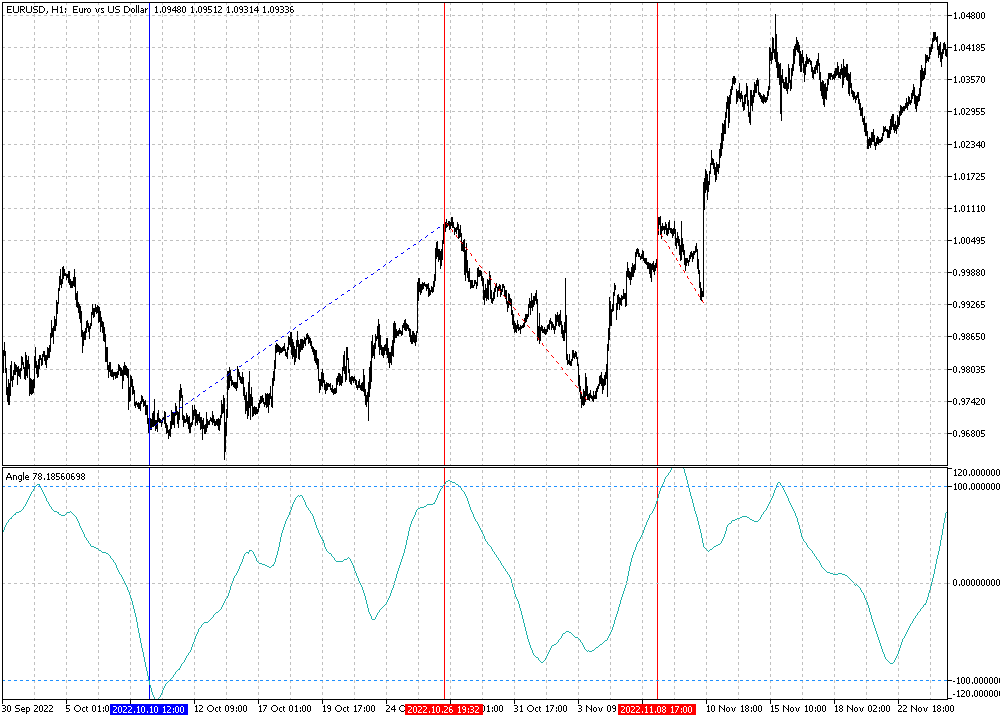
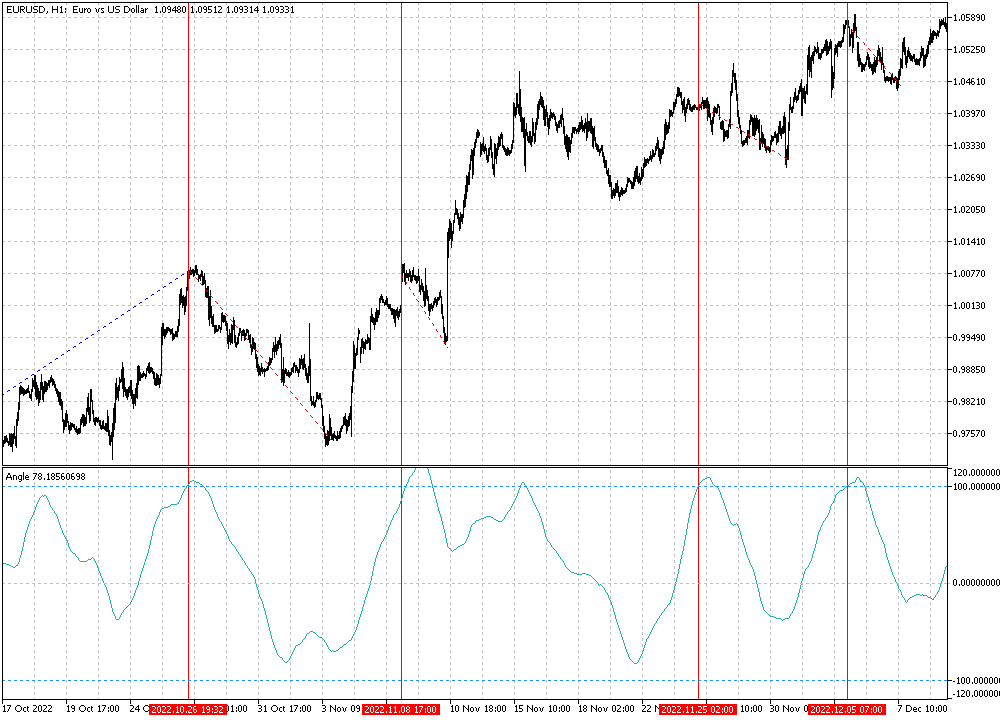
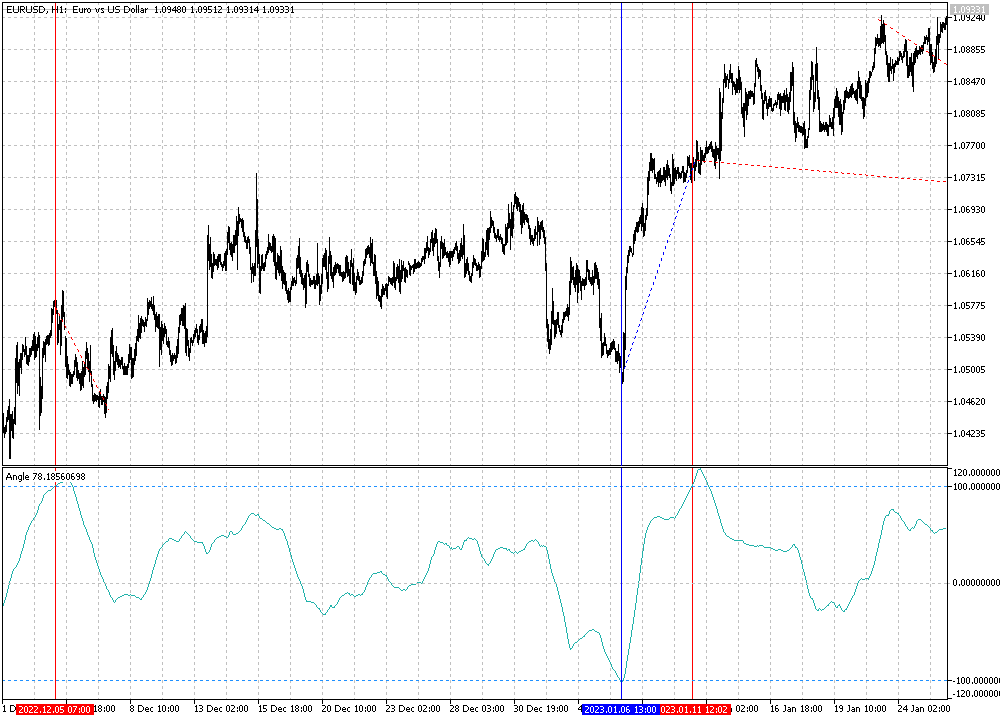
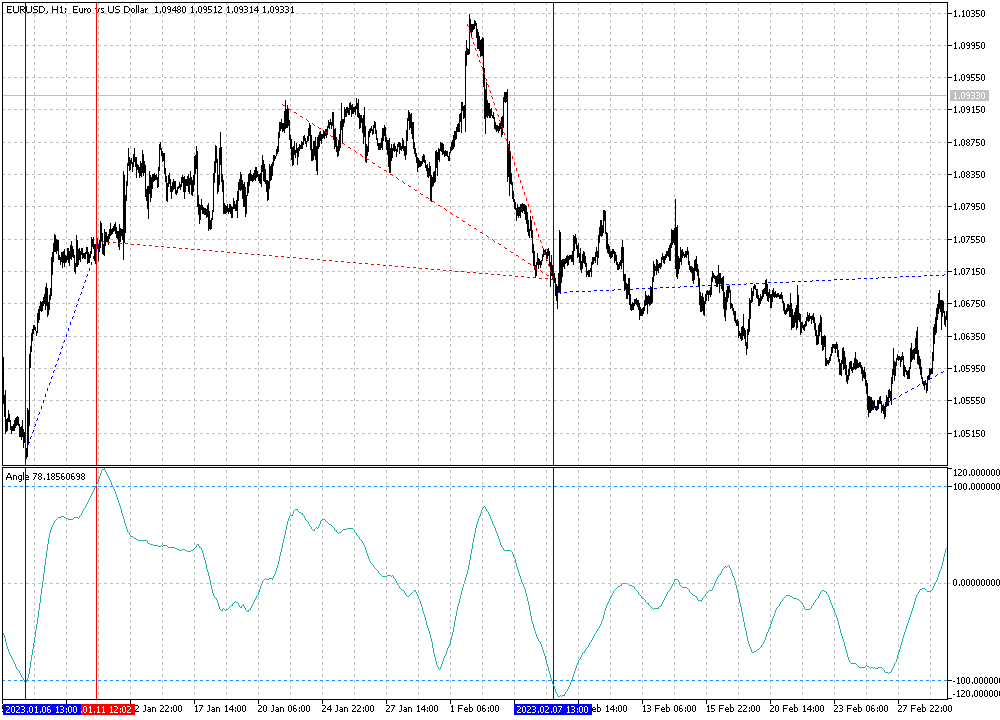
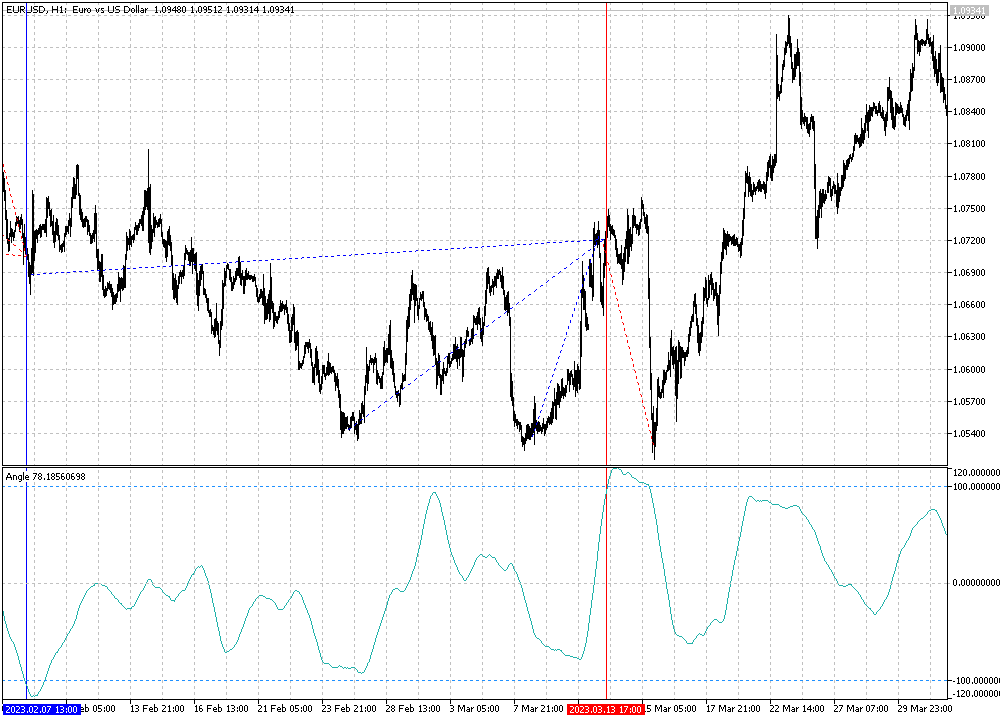
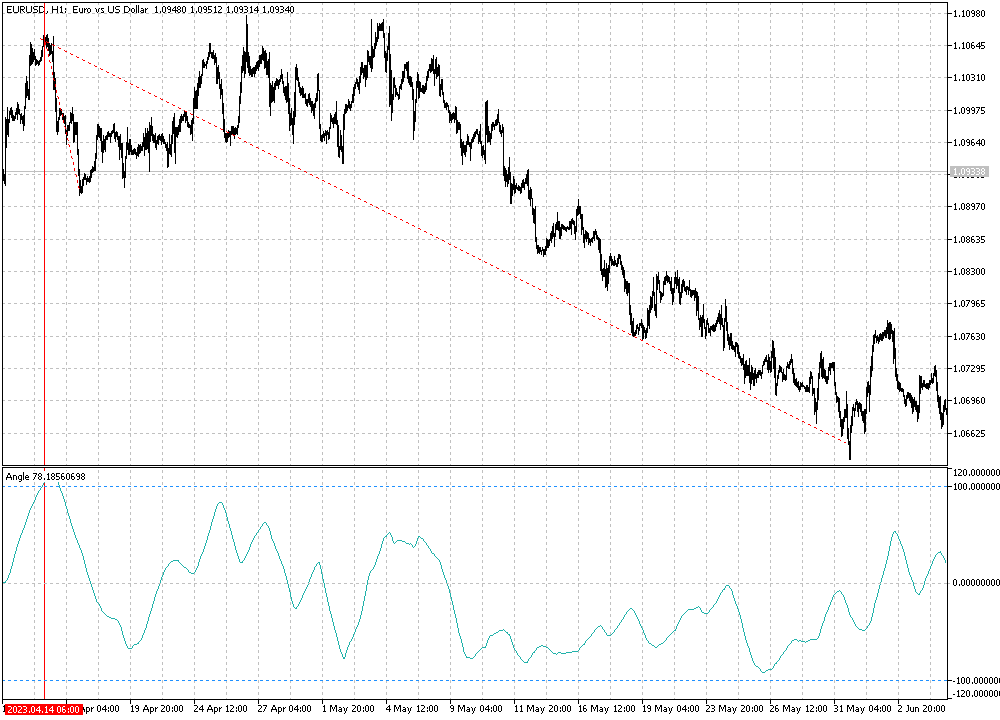
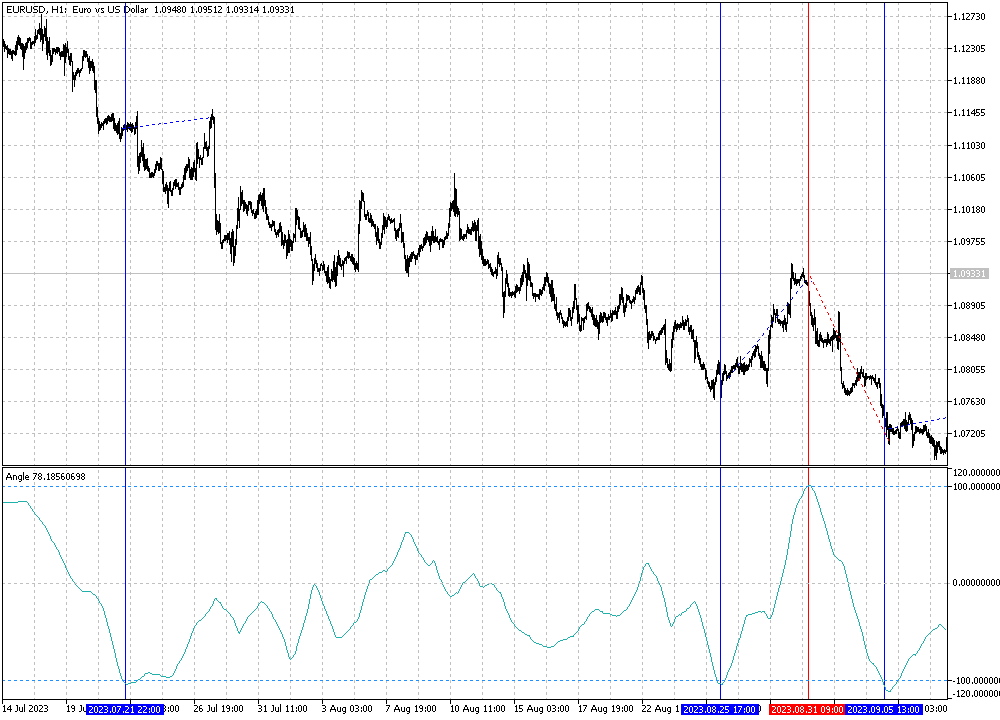
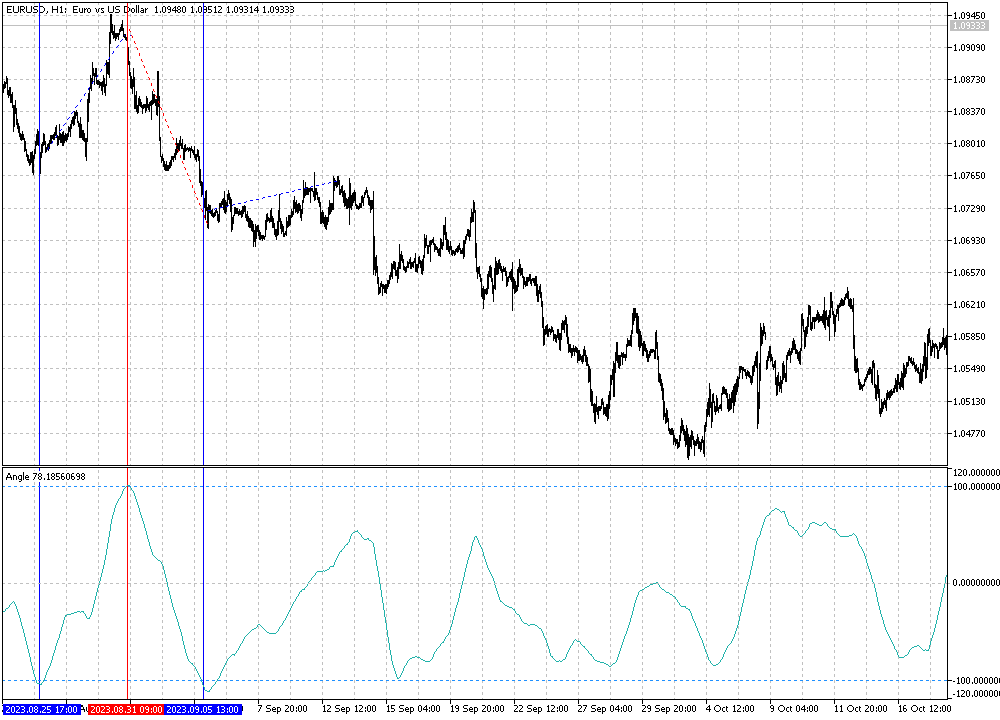
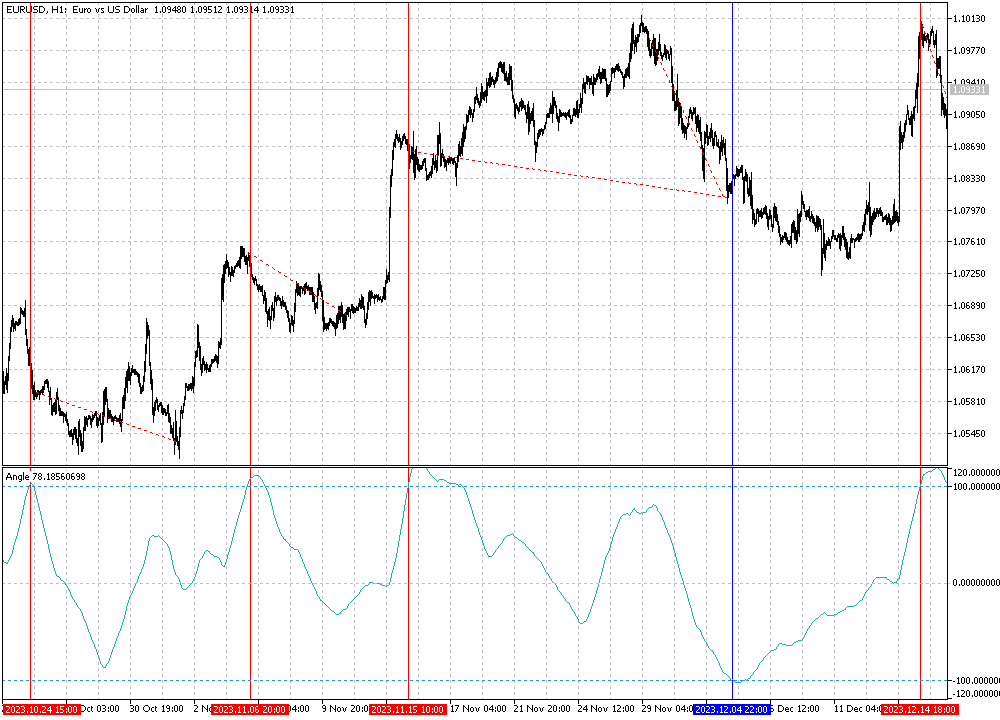
Features (see screenshots):
  • In the screenshots you can see the interpretation of the indicator signals:
    • Sell Signal: When the angle line crosses the upper level from bottom to top, it is considered a sell signal. A trader may be considering opening a short position.
    • Buy signal: Crossing the lower level angle line from top to bottom can be a buy signal. A trader may be considering opening a long position.
  • Additional interpretations:
    • Price Pullbacks: Any time price makes a pullback following an indicator signal, it could be a time to trade further in the direction of the main trend.
    • Various signal configurations: The screenshots show various situations where the angle lines cross the levels, which provides a variety of signals for the trader.
Important things to consider:
  • The indicator does not redraw even on a zero candle, so decisions can be made immediately.
  • It is important to use this indicator in combination with other tools and strategies to confirm signals.
The Angle Prices indicator can be a powerful tool for traders by providing signals based on price angle. However, as with any indicator, it is important to conduct a comprehensive analysis and use it in combination with other methods to make informed decisions in the market.


추천 제품
Rocket Trend
Andriy Sydoruk
The Rocket Trend indicator is trending. The indicator draws two-color points connected by lines along the chart. This is a trend indicator, it is an algorithmic indicator. It is easy to work and understand when a blue circle appears, you need to buy, when a red one appears, sell. The indicator is used for scalping and pipsing, and has proven itself well. Rocket Trend is available for analyzing the direction of the trend for a specific period of time. Ideal for novice traders learning the laws o
ReSu mt5
Daniel Opoku
The Wamek Support and Resistant (WSR) Indicator is a remarkable tool that stands out in the world of technical analysis. It sets itself apart by cleverly combining price action and leading indicators to delineate support and resistance levels with a high degree of accuracy. Its unique feature is its adaptability; users can fine-tune the indicator by adjusting input parameters, enabling them to create customized support and resistance levels that suit their trading strategies. Notably, one of WSR
Gartley Projections D
Oleksandr Medviediev
3 (2)
The indicator identifies the harmonic patterns (XABCD) according to developments of H.M.Gartley ( "Profits in the Stock Market" , 1935г). It projects D-point as a point in the perspective projection (specify ProjectionD_Mode = true in the settings). Does not redraw. When a bar of the working timeframe closes, if the identified pattern point has not moved during Patterns_Fractal_Bars bars, an arrow appears on the chart (in the direction of the expected price movement). From this moment on, the ar
Fibo World MT5
Pavel Verveyko
The indicator builds a graphical analysis based on the Fibonacci theory. Fibo Fan is used for the analysis of the impulses and corrections of the movement. Reversal lines (2 lines at the base of the Fibonacci fan) are used to analyze the direction of movements. The indicator displays the of 4 the target line in each direction. The indicator takes into account market volatility. If the price is above the reversal lines, it makes sense to consider buying, if lower, then selling. You can op
I  recommend you to read the   product's blog  (manual) from start to end so that it is clear from the beginning what the indicator offers. This multi time frame and multi symbol indicator scans for engulfing and tweezer formations.  The indicator can also be used in single chart mode. Combined with your own rules and techniques, this indicator will allow you to create (or enhance) your own powerful system. Features Can monitor all symbols visible in your Market Watch window at the same time. A
Signal Eskiya mt5
Vitalii Zakharuk
Signal Eskiya, in addition to channel lines, reflects entry signals in the form of arrows. Trading strategies using the channel indicator belong to the classic methods of technical analysis, are easy to execute, and therefore available even to beginners. Price ranges work equally well on any trading assets and timeframes, they can be used both independently and with additional confirmation from oscillators and market volumes. American traders say: “Trend is your friend”, which means “Trend is
MTF Candles PRO
Renato Fiche Junior
1 (2)
Tool that allows viewing candles in multiple timeframes. This way, it helps the analysis in multiple timeframes. This is another product developed by Renato Fiche Junior and available to all MetaTrader 5 users! Input Parameters - Option 1 - TimeFrame: Standard MT5 timeframe - Option 2 - Custom TimeFrame (in minutes): Or, if this value is different from zero, the timeframe will be customized. This allows you to choose timeframe other than the MT5 standard. - Total Candles: Number of candle
My Pivot
Ashok Kumar Singha
My Pivot is an Indicator based on Pivot Lines and Support-Resistance zones. This Indicator will Plot 11 SR zones including Pivot Line which will definitely help you to understand the exact SR zones of the Market. Steps to Setup the Indicator: Install the Custom Indicator; Set all the Lines Color, Width and Styles; Set visualization to All Timeframe; and DONE It can be used for: All Pairs: Forex, Cryptocurrencies, Metals, Stocks, Indices.  All Timeframe All Brokers All type of Trading
Double HMA MTF for MT5
Pavel Zamoshnikov
5 (2)
This is an advanced multi-timeframe version of the popular Hull Moving Average (HMA) Features Two lines of the Hull indicator of different timeframes on the same chart. The HMA line of the higher timeframe defines the trend, and the HMA line of the current timeframe defines the short-term price movements. A graphical panel with HMA indicator data from all timeframes at the same time . If the HMA switched its direction on any timeframe, the panel displays a question or exclamation mark with a tex
Big Black Shark MT5
Yaroslav Varankin
Tool for Identifying Potential Reversal Points and Trend Direction This tool is excellent for identifying potential reversal points and trend direction in the market. It works well with confirming indicators such as MACD, Stochastic, RSI - standard indicators available on all MT5 platforms. Together with them, it forms a reliable strategy. In the settings, you can adjust the channel distance and period. It is recommended to enter a trade when the signal line crosses the upper channel bounda
KT Horizontal Lines MT5
KEENBASE SOFTWARE SOLUTIONS
In MetaTrader, plotting multiple   horizontal lines   and then tracking their respective price levels can be a hassle. This indicator automatically plots multiple horizontal lines at equal intervals for setting price alerts, plotting support and resistance levels, and other manual purposes. This indicator is suitable for Forex traders who are new and looking for chances to make quick profits from buying and selling. Horizontal lines can help traders find possible areas to start trading when the
M & W Pattern Pro is an advanced scanner for M and W patters , it uses extra filters to ensure scanned patterns are profitable. The indicator can be used with all symbols and time frames. The indicator is a non repaint indicator with accurate statistics calculations. To use , simply scan the most profitable pair using the statistics dashboard accuracy , then enter trades on signal arrow and exit at the TP and SL levels. STATISTICS : Accuracy 1 : This is the percentage of the times price hit
Magic EA MT5
Kyra Nickaline Watson-gordon
Magic EA is an Expert Advisor based on Scalping, Elliot Waves and with filters such as RSI, Stochastic and 3 other strategies managed and decided with the robot smartly. Large number of inputs and settings are tested and optimized and embedded in the program thus inputs are limited and very simple. Using EA doesn't need any professional information or Forex Trading Knowledge. EA can trade on all symbols and all time frames, using special and unique strategies developed by the author. The EA
Price Guide Full
Robson Ferreira
Functional in the Forex market. Functional on the B3 market - Bolsa Brasil Balcão. Motivation The Price Guide indicator is a tool that helps you insert support and resistance points at the chosen price and in the quantity you want, it depends on the agility of its configuration. This   FULL version   will work in   Meta Trader 5   on all accounts and   Strategy Tester . To test on the DEMO account , download the free version at: https://www.mql5.com/pt/market/product/111620 Operation The method
이 표시기는 시장 분석을 위한 가장 효과적인 도구 중 하나인 피보나치 지원 및 저항 수준을 자동으로 계산하고 표시합니다. 계산은 선택한 기간 및 기간 동안의 평균 가격 데이터를 사용합니다. 이 기간의 최소값과 최대값은 이동의 시작과 끝으로 간주됩니다. 피보나치 수준을 사용하면 가격 움직임이 느려지거나 역전될 수 있는 잠재적인 기준점을 볼 수 있습니다. 즉, 추가 움직임을 예측하고 정지 및 지정가 주문을 하는 데 사용됩니다. 매개변수: PartsShow - 현재 막대에서 표시된 과거 레벨의 수 CalcPeriod - 가격 평균화 기간 SmoothingMethod - 가격 평균화 방법(26개 옵션) TF - 계산에 사용되는 기간 LevelColor - 레벨 라인의 색상 ZeroLevelColor - 제로 레벨 색상 ShowVerticalLine - 레벨 사이의 수직선 표시 활성화/비활성화 VLineStyle - 수직선의 스타일 VLineColor - 수직선의 색상 ShowInfo - 레
This Automatic support/resistance indicator calculates various peaks and troughs of the price action, identifies relevant levels and draws support and resistance automatically. It uses the built-in "ZigZag" indicator in Metatrader as a data source hence, very much accurate indicator.  The support and resistance lines are contineusely updated as new levels and formed. The indicator has only 5 parameters to set, and mostly it can be used with the default values:  The description of the settings is
Regression
MIKHAIL VINOGRADOV
The Regression indicator shows the direction of the trend. The graph shows up to 3 regression lines with different time periods. The straight line is built as the average inside the wave channel of the price movement (shown on one ScreenShot). In this case, you can disable any of the lines. Also, the indicator allows you to change the color for each line. It is interesting to calculate the relative angle in degrees. The angle display can also be turned off. Thanks to this indicator, you can
차트에 지지 및 저항 수준과 추진 캔들 갭을 자동으로 그려주므로 다음 가격 방향 및/또는 잠재적 반전 가능성을 확인할 수 있습니다. 이 보조지표는 제 웹사이트(시장 구조 트레이더)에서 가르치는 포지션 트레이딩 방법론의 일부로 사용하도록 설계되었으며 타겟팅 및 잠재적 진입을 위한 주요 정보를 표시합니다. MT4 Version:  https://www.mql5.com/en/market/product/97246/ 이 보조지표에는 2가지 핵심 기능과 4가지 추가 기능이 있습니다: 핵심 기능 1 - 일일, 주간 및 월간 시간대의 자동 지지선 및 저항선 이 인디케이터는 지난 2일에서 최대 6주 및 몇 달 전의 가장 최근 지원 및 저항 수준을 자동으로 가져옵니다. 이러한 레벨의 모양을 원하는 대로 완전히 사용자 지정하고 표시되는 레벨 수를 표시할 수 있습니다. 이러한 주요 레벨은 종종 가격이 하락하거나 반전되는 주요 지지 및 저항 구간으로 작용합니다. 또한 가격이 향할 목표가 되기도 하므로
Premium level Pro
Dmitriy Kashevich
Premium level is a unique indicator with more than 80% accuracy of correct predictions! This indicator has been tested for more than two months by the best Trading Specialists! The author's indicator you will not find anywhere else! From the screenshots you can see for yourself the accuracy of this tool! 1 is great for trading binary options with an expiration time of 1 candle. 2 works on all currency pairs, stocks, commodities, cryptocurrencies Instructions: As soon as the red ar
Where is the pin
Alessandro Partesotti
This incicator shows you when a pin bar is formed, and aid you perform a inversion strategy or a trend continuation based on resistence support and or channel. Typically a pin bar shows you a price rejection from the market and the signal most of time is profitable. So i suggest to use buy/sell limit order over ratrace SL little bit over or below bar and take profit based on your strategy and money management. Best timeframe are D H4 H1
Divergence Sync MT5
Pavel Verveyko
5 (1)
Divergence and Convergence are important harbingers of reversals in stock markets. The Divergence Sync indicator is designed to automatically search for divergences on a large number of indicators with different parameters. The search for divergences is carried out on these indicators: (CCI, CHO, DeMarker, MACD, MFI, Momentum, OBV, OsMA, RSI, Stochastic, WPR,   Awesome Oscillator ). To search for divergences, you can use one technical indicator or search simultaneously on any number of ind
Peaks and Troughs MT5
Pavel Verveyko
5 (1)
The indicator detects important peaks and troughs (extremes) on the chart. These points can be used to plot support/resistance levels and trend lines, as well as any other graphical analysis. These points can serve as reference points for setting trading orders. The indicator does not redraw . Settings: Size_History  - the size of the calculated history. Num_Candles_Right  - number of candles to the right of the peak or trough. Num_Candles_Left  - number of candles to the left of the pea
Nrha
Ratna Purwantari
This indicator uses Fibonacci to determine your trading levels precisely and measurably. It helps you to earn big profits. This indicator can also be used for various currency charts. You can also combine it with other indicators that you like so that the profits you get are also even greater. I hope you give me input so that this indicator can be better. We recommend using for the period M1 to M15. feel free to discuss with me. Thanks. 
Introduction to Harmonic Pattern Scenario Planner The present state of Forex market can go through many different possible price paths to reach its future destination. Future is dynamic. Therefore, planning your trade with possible future scenario is an important step for your success. To meet such a powerful concept, we introduce the Harmonic Pattern Scenario Planner, the first predictive Harmonic Pattern Tool in the world among its kind. Main Features Predicting future patterns for scenari
Pullback Hunter
Anton Polkovnikov
PULLBACK HUNTER What is every trader's cherished dream? To see without delay the places where the reversal will happen. This, of course, is from the category of magic, though... nothing is impossible. But for now I've prepared for you an indicator that marks in real time the end of corrections to the current movement or in short - catches pullbacks.What is the main point? Many people practice rebounds when the price moves in the direction of the open position. And they do them on the formation o
Atomic Analyst MT5
Issam Kassas
4.82 (11)
우선적으로 언급할 점은이 거래 지표가 다시 그리지 않고 지연되지 않으며 이를 통해 수동 및 로봇 거래 모두에 이상적이라는 점입니다. Atomic Analyst는 가격의 강도와 모멘텀을 활용하여 시장에서 더 나은 이점을 찾는 PA Price Action Indicator입니다. 고급 필터를 장착하여 잡음과 거짓 신호를 제거하고 거래 잠재력을 높이는 데 도움이 됩니다. 복잡한 지표의 다중 레이어를 사용하여 Atomic Analyst는 차트를 스캔하고 복잡한 수학적 계산을 간단한 신호와 색상으로 변환하여 초보 트레이더가 이해하고 일관된 거래 결정을 내릴 수 있도록합니다. "Atomic Analyst"는 새로운 및 경험이 풍부한 트레이더를위한 종합적인 거래 솔루션입니다. 프리미엄 지표와 최고 수준의 기능을 하나의 거래 전략에 결합하여 모든 종류의 트레이더에 대한 다재다능한 선택지가되었습니다. 인트라데이 거래 및 스캘핑 전략 : 빠르고 정확한 일일 거래 및 단기 거래를 위해 설계
ZigZagAllinOne
Alberto Da Silva Lira
Indicator focusing on the market's ZigZag, also adding 2 other already established indicators: Book of Offers and Balance Aggressor (Time & Trades), this indicator allows to detect the best price trigger (buy or sell) in the aggressions to the Book of Offers including filters important as Aggression in Candle. Recommended use on the Brazilian iBovespa B3, but it also serves in Forex as long as the assets have information from the Book, in the case of Forex it is not possible to use the Aggres
The new update makes this indicator a complete tool for studying, analyzing and operating probabilistic patterns. It includes: On-chart Multi-asset percentage monitor. Configurable martingales. Twenty-one pre-configured patterns, including Mhi patterns and C3. An advanced pattern editor to store up to 5 custom patterns. Backtest mode to test results with loss reports. Trend filter. Hit operational filter. Martingale Cycles option. Various types of strategies and alerts. Confluence between patter
이 다중 시간 프레임 및 다중 기호 표시기는 이중 상단/하단, 머리 및 어깨, 페넌트/삼각형 및 플래그 패턴을 식별합니다. 또한 네크라인/삼각형/깃대 이탈이 발생한 경우에만 경고를 설정하는 것도 가능합니다(넥라인 이탈 = 상단/하단 및 헤드&숄더에 대한 확인된 신호).       지표는 단일 차트 모드에서도 사용할 수 있습니다. 이 옵션에 대한 자세한 내용은 제품의       블로그   . 고유한 규칙 및 기술과 결합하여 이 표시기를 사용하면 자신만의 강력한 시스템을 생성(또는 강화)할 수 있습니다. 특징 Market Watch 창에 표시되는 모든 기호를 동시에 모니터링할 수 있습니다. 하나의 차트에만 지표를 적용하고 전체 시장을 즉시 모니터링하십시오. M1에서 MN까지 모든 시간 프레임을 모니터링할 수 있으며 패턴이 식별되거나 중단될 때 실시간 경고를 보냅니다. 모든 Metatrader 기본 경고 유형이 지원됩니다. RSI를 추세 필터로 사용하여 잠재적 반전을 적절히 식별할 수
VolumeDeltaWaves
Stanislav Korotky
5 (1)
This indicator is an extended implementation of Weis waves. It builds Weis waves on absolute volumes (which is the classical approach) or delta of volumes (unique feature) using different methods of wave formation and visualization. It works with real volumes, if available, or with tick volumes otherwise, but also provides an option to use so called "true volume surrogates", as an artificial substitution for missing real volumes (for example, for Forex symbols), which was introduced in correspo
이 제품의 구매자들이 또한 구매함
우선 이 거래 시스템이 리페인팅, 리드로잉 및 레이그 인디케이터가 아니라는 점을 강조하는 것이 중요합니다. 이는 수동 및 로봇 거래 모두에 이상적인 것으로 만듭니다. "스마트 트렌드 트레이딩 시스템 MT5"은 새로운 및 경험이 풍부한 트레이더를 위해 맞춤형으로 제작된 종합적인 거래 솔루션입니다. 10개 이상의 프리미엄 인디케이터를 결합하고 7개 이상의 견고한 거래 전략을 특징으로 하여 다양한 시장 조건에 대한 다목적 선택이 가능합니다. 트렌드 추종 전략: 효과적인 트렌드 추이를 타기 위한 정확한 진입 및 손절 관리를 제공합니다. 반전 전략: 잠재적인 트렌드 반전을 식별하여 트레이더가 범위 시장을 활용할 수 있게 합니다. 스캘핑 전략: 빠르고 정확한 데이 트레이딩 및 단기 거래를 위해 설계되었습니다. 안정성: 모든 인디케이터가 리페인팅, 리드로잉 및 레이그가 아니므로 신뢰할 수 있는 신호를 보장합니다. 맞춤화: 개별 거래 선호도를 고려한 맞춤형 전략을 지원합니다. 최상의 전략을 찾는
FX Volume MT5
Daniel Stein
4.94 (17)
모닝 브리핑을 통해 세부 정보와 스크린샷으로 매일 시장 업데이트를 받으세요 여기 mql5 및 텔레그램에서 FX 거래량은 브로커의 관점에서 시장 심리에 대한 실제 통찰력을 제공하는 최초이자 유일한 거래량 지표입니다. 브로커와 같은 기관 시장 참여자가 외환 시장에서 어떤 포지션을 취하고 있는지에 대한 훌륭한 통찰력을 COT 보고서보다 훨씬 빠르게 제공합니다. 차트에서 이 정보를 직접 확인하는 것은 트레이딩의 진정한 판도를 바꾸고 획기적인 솔루션입니다. 다음과 같은 고유한 시장 데이터 인사이트의 이점 비율 는 통화의 매수/매도 포지션 비율을 백분율로 표시 비율 변화 는 선택한 기간 내 매수 비율과 비율 변화를 표시 총 거래량 는 해당 통화의 총 거래량(롱 및 숏)을 로트 단위로 보여줍니다 Volumes Long 는 해당 통화의 모든 롱 포지션의 거래량을 보여줍니다 Volumes Short 는 해당 통화의 모든 숏 포지션의 거래량을 보여줍니다 Net Long 는 순 롱 포지션의 거래량
Quantum Trend Sniper
Bogdan Ion Puscasu
5 (37)
소개       Quantum Trend Sniper Indicator는   추세 반전을 식별하고 거래하는 방식을 변화시키는 획기적인 MQL5 지표입니다! 13년 이상의 거래 경험을 가진 숙련된 트레이더 팀이 개발한       Quantum Trend Sniper 표시기       매우 높은 정확도로 추세 반전을 식별하는 혁신적인 방법으로 거래 여정을 새로운 차원으로 끌어올리도록 설계되었습니다. ***Quantum Trend Sniper Indicator를 구입하면 Quantum Breakout Indicator를 무료로 받을 수 있습니다!*** Quantum Trend Sniper Indicator는 추세 반전을 식별하고 세 가지 이익실현 수준을 제안할 때 경고, 신호 화살표를 제공합니다. 초보자 거래자와 전문 거래자 모두에게 적합합니다. Quantum EA 채널:       여기를 클릭하세요 MT4 버전:       여기를 클릭하세요
Gold Stuff mt5
Vasiliy Strukov
4.89 (166)
Gold Stuff mt5는 금을 위해 특별히 설계된 추세 지표이며 모든 금융 상품에서도 사용할 수 있습니다. 표시기가 다시 그려지지 않고 지연되지 않습니다. 권장 기간 H1. 설정 및 개인 보너스를 받으려면 구매 후 즉시 저에게 연락하십시오!   설정 화살표 그리기 - 켜기 끄기. 차트에 화살표 그리기. 경고 - 가청 경고를 끕니다. 이메일 알림 - 켜기 끄기. 이메일 알림. Puch-notification - 켜기 끄기. 푸시 알림. 다음으로 색 영역을 조정합니다. Gold Stuff mt5는 금을 위해 특별히 설계된 추세 지표이며 모든 금융 상품에서도 사용할 수 있습니다. 표시기가 다시 그려지지 않고 지연되지 않습니다. 권장 기간 H1. 설정 및 개인 보너스를 받으려면 구매 후 즉시 저에게 연락하십시오!   설정 화살표 그리기 - 켜기 끄기. 차트에 화살표 그리기. 경고 - 가청 경고를 끕니다. 이메일 알림 - 켜기 끄기. 이메일 알림. Puch-noti
RelicusRoad Pro MT5
Relicus LLC
4.82 (22)
이제 $ 147 (몇 가지 업데이트 후 $ 499 증가) - 무제한 계정 (PCS 또는 MACS) RelicusRoad 사용 설명서 + 교육 비디오 + 비공개 Discord 그룹 액세스 + VIP 상태 시장을 보는 새로운 방법 RelicusRoad는 외환, 선물, 암호화폐, 주식 및 지수에 대한 세계에서 가장 강력한 거래 지표로서 거래자에게 수익성을 유지하는 데 필요한 모든 정보와 도구를 제공합니다. 우리는 초보자부터 고급까지 모든 거래자가 성공할 수 있도록 기술적 분석 및 거래 계획을 제공합니다. 미래 시장을 예측할 수 있는 충분한 정보를 제공하는 핵심 거래 지표입니다. 우리는 차트에서 말이 안 되는 여러 지표 대신 완전한 솔루션을 믿습니다. 타의 추종을 불허하는 매우 정확한 신호, 화살표 + 가격 조치 정보를 표시하는 올인원 표시기입니다. 강력한 AI를 기반으로 하는 RelicusRoad는 누락된 정보와 도구를 제공하여 교육하고 성공적인 트레이더인 트레이딩 전문
Entry Points Pro for MT5
Yury Orlov
4.54 (157)
다시 색을 칠하지 않고 거래에 진입할 수 있는 정확한 신호를 제공하는 MT5용 지표입니다. 외환, 암호화폐, 금속, 주식, 지수 등 모든 금융 자산에 적용할 수 있습니다. 매우 정확한 추정값을 제공하고 매수와 매도의 가장 좋은 시점을 알려줍니다. 하나의 시그널로 수익을 내는 지표의 예와 함께 비디오 (6:22)시청하십시오! 대부분의 거래자는 Entry Points Pro 지표의 도움으로 첫 거래 주 동안 트레이딩 결과를 개선합니다. 저희의   Telegram Group 을 구독하세요! Entry Points Pro 지표의 좋은점. 재도색이 없는 진입 신호 신호가 나타나고 확인되면(시그널 캔들이 완성된 경우) 신호는 더 이상 사라지지 않습니다. 여타 보조지표의 경우 신호를 표시한 다음 제거되기 때문에 큰 재정적 손실로 이어집니다. 오류 없는 거래 게시 알고리즘을 통해 트레이드(진입 또는 청산)를 할 이상적인 순간을 찾을 수 있으며, 이를 통해 이를 사용하는 모든 거래자의
FX Power MT5 NG
Daniel Stein
5 (4)
모닝 브리핑 여기 mql5 와 텔레그램에서 FX Power MT5 NG 는 오랫동안 인기 있는 통화 강도 측정기인 FX Power의 차세대 버전입니다. 이 차세대 강도 측정기는 무엇을 제공합니까? 기존 FX Power에서 좋아했던 모든 것 PLUS GOLD/XAU 강도 분석 더욱 정밀한 계산 결과 개별 구성 가능한 분석 기간 더 나은 성능을 위한 사용자 정의 가능한 계산 한도 특별 멀티더 많은 것을보고 싶은 사람들을위한 특별한 다중 인스턴스 설정 모든 차트에서 좋아하는 색상을위한 끝없는 그래픽 설정 수많은 알림 옵션, 중요한 것을 다시는 놓치지 않도록 Windows 11 및 macOS 스타일의 둥근 모서리가 있는 새로운 디자인 마법처럼 움직이는 인디케이터 패널 FX 파워 키 특징 모든 주요 통화의 완전한 강세 이력 모든 시간대에 걸친 통화 강세 이력 모든 브로커 및 차트에서 고유 계산 결과 100% 신뢰할 수있는 실시간100 % 신뢰할 수있는 실시간 계산-> 다시 칠하지 않음
Advanced Supply Demand MT5
Bernhard Schweigert
4.53 (15)
현재 33% 할인! 초보자나 전문 트레이더를 위한 최고의 솔루션! 이 보조지표는 우리가 다수의 독창적 기능과 새로운 공식을 통합한 독특하고 고품질이며 저렴한 거래 도구입니다. 이 업데이트를 통해 이중 시간대를 표시할 수 있습니다. 더 높은 TF를 표시할 수 있을 뿐만 아니라 차트 TF와 더 높은 TF 모두를 표시할 수 있습니다: 중첩 영역 표시. 모든 Supply Demand 트레이더들이 좋아할 것입니다. :) 중요한 정보 공개 Advanced Supply Demand의 잠재력을 극대화하려면 다음을 방문하십시오. https://www.mql5.com/ko/blogs/post/720245   진입 또는 목표의 명확한 트리거 포인트를 정확히 찾아냄으로 해서 거래가 어떻게 개선될지 상상해 보십시오. 새로운 알고리즘을 기반으로 매수자와 매도자 간의 잠재적인 불균형을 훨씬 더 쉽게 분간할 수 있습니다. 왜냐하면 가장 강한 공급영역과 가장 강한 수요 영역과 과거에 어떻게 진행 되었는지를(이
XQ Indicator MetaTrader 5
Marzena Maria Szmit
5 (1)
Step into the realm of Forex trading with confidence and precision using XQ, a cutting-edge Forex indicator designed to elevate your trading game to unprecedented heights. Whether you're a seasoned trader or just stepping into the world of currency exchange, XQ Forex Indicator empowers you with the insights and signals needed to make informed trading decisions. The signal conditions are a combination of three indicators, and XQ Forex Indicator only display  medium and long-term trends . The ind
ON Trade Gann Squares MT5
Abdullah Alrai
5 (1)
간 스퀘어 지표는 W.D. 간이 쓴 "시장 예측을 위한 수학적 공식" 기사에 기반한 강력한 시장 분석 도구입니다. 이 도구는 수학적 개념과 간 이론을 사용하여 정확한 시장 분석을 수행합니다. 144, 90, 52의 제곱과 9의 제곱을 사용합니다. 또한 의 9의 제곱근 및 해당 제곱의 채널 및 스타 패턴과의 관련성을 통합합니다. 사용자 메뉴얼 및 적용: 이 지표를 사용하기 전에 사용자 메뉴얼을 읽고 질문이 있을 경우 문의하시기 바랍니다. 전체 메뉴얼은 웹사이트에서 제공됩니다. MT5의 전체 버전을 구매하거나 MT4의 무료 버전을 테스트할 수 있습니다. 두 버전 모두 링크에서 확인하실 수 있습니다. 주요 기능 및 기능: 간 스퀘어 지표는 정확한 결정을 위해 기하학적 개념과 간 이론을 활용하는 시장 분석을 위한 포괄적인 도구 집합을 제공합니다. 주요 기능은 다음과 같습니다. 9의 제곱 분석:   이 지표는 9의 제곱에 대한 수평 선, 스타 패턴, 그리드 및 간 팬을 그릴 수 있습니다. 간
MetaBands M5
Vahidreza Heidar Gholami
4.67 (3)
MetaBands uses powerful and unique algorithms to draw channels and detect trends so that it can provide traders with potential points for entering and exiting trades. It’s a channel indicator plus a powerful trend indicator. It includes different types of channels which can be merged to create new channels simply by using the input parameters. MetaBands uses all types of alerts to notify users about market events. Features Supports most of the channel algorithms Powerful trend detection algorith
소개       Quantum Breakout PRO   , 브레이크아웃 존 거래 방식을 변화시키는 획기적인 MQL5 지표! 13년 이상의 거래 경험을 가진 숙련된 트레이더 팀이 개발한       퀀텀 브레이크아웃 PRO       혁신적이고 역동적인 브레이크아웃 존 전략으로 거래 여정을 새로운 차원으로 끌어올리도록 설계되었습니다. Quantum Breakout Indicator는 5개의 이익 목표 영역이 있는 브레이크아웃 영역의 신호 화살표와 브레이크아웃 상자를 기반으로 한 손절 제안을 제공합니다. 초보자 거래자와 전문 거래자 모두에게 적합합니다. Quantum EA 채널:       여기를 클릭하세요 중요한! 구매 후 설치 매뉴얼을 받으려면 개인 메시지를 보내주십시오. 추천: 기간: M15 통화쌍: GBPJPY, EURJPY, USDJPY,NZDUSD, XAUUSD 계정 유형: 스프레드가 매우 낮은 ECN, Raw 또는 Razor 브로커 시간: GM
Gartley Hunter Multi
Siarhei Vashchylka
5 (5)
Gartley Hunter Multi - An indicator for searching for harmonic patterns simultaneously on dozens of trading instruments and on all classic timeframes: (m1, m5, m15, m30, H1, H4, D1, Wk, Mn). Manual (Be sure to read before purchasing) | Version for MT4 Advantages 1. Patterns: Gartley, Butterfly, Shark, Crab. Bat, Alternate Bat, Deep Crab, Cypher 2. Simultaneous search for patterns on dozens of trading instruments and on all classic timeframes 3. Search for patterns of all possible sizes. Fr
TPSproTREND PrO MT5
Roman Podpora
5 (5)
TPSpro TRENDPRO  - is a trend indicator that automatically analyzes the market and provides information about the trend and each of its changes, as well as giving signals for entering trades without redrawing! The indicator uses each candle, analyzing them separately. referring to different impulses - up or down impulse. Exact entry points into transactions for currencies, crypto, metals, stocks, indices!  -  Version MT4                  DETAILED DESCRIPTION        /       TRADING SETUPS       
Golden Spikes Detector
Batsirayi L Marango
5 (1)
Golden Spikes Detector This indicator is based on an advanced strategy primarily for trading spikes on Boom and Crash Indices. Complex algorithms were implemented to detect high probability entries only. It alerts on potential Buy and Sell entries. To trade spikes on the Deriv or Binary broker, only take Buy Boom and Sell Cash alerts. It was optimised to be loaded on 5-minute timeframe although multiple timeframe analysis is done in the background. Features ·             Desktop pop up and sound
Strong Support mt5
Vasiliy Strukov
5 (9)
지원 및 저항 수준은 오랫동안 시장 분석을위한 강력한 도구였습니다. 강력한 지원 지표는 현지 가격 최소값을 기반으로 한 지원 수준과 현지 가격 최대값을 기반으로 한 저항 수준을 나타냅니다. 내 다른 개발은 여기에서 볼 수 있습니다 추세 표시기와 함께 사용하는 것이 좋습니다(예:금 물건)-추세에 따라 거래하고 동시에 통합 또는 추세 반전 영역을 결정할 수있을뿐만 아니라 정지 손실을 설정하고 지원 및 저항 수준에서 이익을 얻을 수 있습니다. 설정 및 개인 보너스를 받기 위해 구입 후 즉시 저에게 연락하십시오! 들어오는 매개 변수 - 이 표시기에는 복잡한 설정이 필요하지 않으며 주요 매개 변수는 색상 스케일 조정입니다. 지원 및 저항 수준은 오랫동안 시장 분석을위한 강력한 도구였습니다. 강력한 지원 지표는 현지 가격 최소값을 기반으로 한 지원 수준과 현지 가격 최대값을 기반으로 한 저항 수준을 나타냅니다. 내 다른 개발은 여기에서 볼 수 있습니다 추세 표
Golden Gate Algo MT5
James David Lane
4 (6)
크리스마스 40% 할인! 1월 1일에 가격이 $250로 인상됩니다! GoldenGate Entries를 소개합니다: 혁신적인 트레이딩 솔루션! GoldenGate Entries (GGE)를 사용하여 거래하는 혁신적인 방법을 발견하세요. GGE는 귀하의 거래 경험을 향상시키기 위해 디자인된 고급 지표로, 사용자에게 정확성과 자신감을 부여하는 포괄적인 기능을 제공합니다. 페어: 아무거나 (FX - 상품 - 주식 - 주식 - 암호화폐) 타임프레임: 15분에서 H1까지 주요 기능: 매수 및 매도 화살표 표시: 팝업 알림과 함께 매수 및 매도 화살표 표시를 받아 언제나 정보를 확인할 수 있습니다. GoldenGate_Algo: 시장 상황에 대한 통찰력을 얻으려면 GoldenGate_Algo를 사용하세요. 시장이 '과매도'인지 '과매수'인지 평가하는 강력한 도구입니다. 현재 트렌드 분석: 현재 보고 있는 타임프레임에서 현재 트렌드에 액세스하여 거래를 주류 시장 방
Trend Scanner mt5 GS
Vasiliy Strukov
5 (14)
Trend Scanner는 다중 기호 및 다중 시간 프레임에서 시장 동향을 스캔하고 차트의 이동 가능한 패널에 표시합니다. 분석을 위해 금색 지표를 사용합니다. 기능에는 알림 및 이메일, 푸시 알림이 포함됩니다. 거래자는 표시를 위해 자신이 선택한 여러 쌍을 선택할 수 있습니다. 추세 스캐너는 추세의 방향을 볼 수있는 훌륭한 도구이며 추세에 따른 매수 또는 매도 주문만 허용하여 수동 거래 또는 EA 거래에 사용할 수 있습니다.   추세 스캐너는 추세의 방향을 볼 수있는 훌륭한 도구이며 추세에 따른 매수 또는 매도 주문만 허용하여 수동 거래 또는 EA 거래에 사용할 수 있습니다 실시간 결과는 여기에서 볼 수 있습니다.  설정 및 개인 보너스를 받으려면 구매 직후 저에게 연락하십시오!   설정 및 개인 보너스를 받으려면 구매 직후 저에게 연락하십시오!
Bill Williams Advanced
Siarhei Vashchylka
5 (3)
Bill Williams Advanced is designed for automatic chart analysis using Bill Williams' "Profitunity" system. The indicator analyzes four timeframes at once. Manual (Be sure to read before purchasing) Advantages 1. Automatically analyzes the chart using the "Profitunity" system of Bill Williams. The found signals are placed in a table in the corner of the screen. 2. Equipped with a trend filter based on the Alligator indicator. Most of the system signals are recommended to be used only accordi
TrendMaestro5
Stefano Frisetti
note: this indicator is for METATRADER4, if you want the version for METATRADER5 this is the link:  https://www.mql5.com/it/market/product/108106 TRENDMAESTRO recognizes a new TREND in the bud, he never makes mistakes. The certainty of identifying a new TREND is priceless. DESCRIPTION TRENDMAESTRO identifies a new TREND in the bud, this indicator examines the volatility, volumes and momentum to identify the moment in which there is an explosion of one or more of these data and therefore the mome
TPA True Price Action indicator reveals the true price action of the market makers through 100% non-repainting signals strictly at the close of a candle! TPA shows entries and re-entries, every time the bulls are definitely stronger than the bears and vice versa. Not to confuse with red/green candles. The shift of power gets confirmed at the earliest stage and is ONE exit strategy of several. There are available now two free parts of the TPA User Guide for our customers. The first "The Basics"
Trades Assistant MT5
Martin Muriu Maina
Trade Assistant MetaTrader System  — a multi-timeframe system that is based on three standard indicators:   Stochastic oscillator ,   RSI   (Relative Strength Index), and   CCI   (Commodity Channel Index). It displays current trend directions for M1, M5, M15, M30, H1, H4, D1, W1, and MN1 timeframes. When you follow such an indicator you have a clear picture of the trends across all important timeframes. It doesn't matter which timeframe you attach this indicator to. Input parameters CheckCandl
Professional Scalping Tool on Deriv Attention! The indicator will be sold in limited quantities!!! Description: This trading indicator is designed for professional traders focused on scalping. Designed with the market in mind, it provides highly accurate spike trading signals. It works on the M1 timeframe and supports the following symbols: Boom 300 Index, Boom 500 Index, Boom 1000 Index, Crash 300 Index, Crash 500 Index, Crash 1000 Index. Functional Features: - Direction: - Trading is ca
TPSpro RFI Levels MT5
Roman Podpora
5 (5)
A key element in trading is zones or levels from which decisions to buy or sell a trading instrument are made. Despite attempts by major players to conceal their presence in the market, they inevitably leave traces. Our task was to learn how to identify these traces and interpret them correctly. Reversal First Impulse levels (RFI)   -  Version MT4                  INSTRUCTIONS                 RUS                 ENG                         R ecommended to use with an indicator   -  TREND PRO  
VTrende Pro
Andrii Diachenko
5 (1)
VTrende Pro - MTF indicator for trend trading with a display panel for MT5 *** Videos can be translated into any language using subtitles (video language - Russian) Although the signals of the VTrende Pro indicator can be used as signals of a full-fledged trading system, it is recommended to use them in conjunction with the Bill Williams TS. VTrende Pro is an extended version of the VTrende indicator. Difference between Pro version and VTrende: - Time zones - Signal V - signal 1-2 waves
IVISTscalp5
Vadym Zhukovskyi
5 (3)
당신에게 소개하는 iVISTscalp5 지표는 독특하면서도 거래 작업에서 효과적입니다. 이 지표는 시간 데이터를 기반으로 하며 금융 시장의 많은 경험과 깊은 분석의 결과입니다. iVISTscalp5 지표는 수동 거래에 뛰어난 도구입니다. 편리성, 간단함 및 시각화 - 모든 복잡성은 숨겨져 있습니다. 우리는 iVISTscalp5 지표의 설정과 사용을 최대한 단순화했습니다. 이 지표는 MT5 터미널에서 가지고 있는 모든 금융 상품에 적합합니다. 시간 기준으로 작동하는 시간은 4am에서 8pm (UTC+3)입니다. iVISTscalp5 지표 메뉴 (스크린샷 1 참조): History - 표시할 주간 수 계산 dT_min - 시간 설정 간격 선택 (분) TFline - 수평 볼륨 생성 (타임프레임) BARSline - 수평 볼륨 생성 (바 수) TFtrend1 - 매일 채널 생성 (타임프레임) BARStrend1 - 매일 채널 생성 (바 수) TFtrend2 - 주간 채널 생성 (타임프레임
PZ Swing Trading MT5
PZ TRADING SLU
5 (4)
Swing Trading is the first indicator designed to detect swings in the direction of the trend and possible reversal swings. It uses the baseline swing trading approach, widely described in trading literature. The indicator studies several price and time vectors to track the aggregate trend direction and detects situations in which the market is oversold or overbought and ready to correct. [ Installation Guide | Update Guide | Troubleshooting | FAQ | All Products ] Profit for market swings with
SMCpro
Arief
5 (1)
SMCpro MT5  Original Price  $440   ---  Currently Price  40% OFF  ( for unlimited use ) Hello World! Introducing.. SMCpro tool and Indicator for  MetaTrader 5 , a cutting-edge feature designed to revolutionize your trading experience. With innovative ICT Smart Money Concept, you gain unparalleled insight into market dynamics, empowering you to make informed trading decisions like never before. Built on the foundation of advanced algorithms and real-time data analysis, SMCpro tool and Indicat
[ MT4 Version ] Backtesting Simulator Are you tired of spending months on demo or live accounts to test your trading strategies? The Backtesting Simulator is the ultimate tool designed to elevate your backtesting experience to new heights. Utilizing Metatrader historical symbol information, it offers an unparalleled simulation of real market conditions. Take control of your testing speed, test ideas quickly or at a slower pace, and witness remarkable improvements in your testing performance.
Weis Wave with Alert MT5
Trade The Volume Waves Single Member P.C.
4.93 (15)
Rental/Lifetime Package Options and Privileges  * For optimum results the yearly or lifetime package is suggested due to live training ! Rent Monthly Six Months   Yearly/Lifetime Weis Wave with Speed with Alert+Speed Index x x x Manual  x x x Quick Set up Video x x x Blog x x x Lifetime Updates x x x Setup and Training Material x x Free Rectangle Break Alert Tool      x Discord Access Channel "The SI traders" x 2-hour live methodology training x How to trade with it:    http://
제작자의 제품 더 보기
Cryo
Sabina Fik
5 (1)
Cryo is based on the process of identifying the rate of change in price growth and allows you to find entry and exit points from the market. A fundamental technical indicator that allows you to assess the current market situation in order to enter the market of the selected currency pair in a trend and with minimal risk. The Cryo indicator was created on the basis of the original indicators for searching for extremes, the indicator is well suited for determining a reversal or a large sharp je
The Compare Graphs indicator is an analysis tool that allows traders to compare two or more graphs on the same chart window. This indicator is commonly used in trading platforms such as MetaTrader and provides a clearer comparison of different financial instruments or time frames. Functions of the Compare Graphs indicator may include: Selecting Charts: The trader can select the charts he wants to compare, such as price charts of different currency pairs or indicators on the same chart. Settin
The Trend Bureaucrat indicator helps analyze the market on a selected time interval. They define the prevailing trend. Easy to set up and works on all pairs and all time intervals. Trend indicators make it possible to classify the direction of price movement, determining its strength. Solving this problem helps investors enter the market on time and get good returns. For any trader, it is extremely important to correctly determine the direction and strength of trend movement. Unfortunately, ther
The   Angle Prices   indicator is a tool that calculates the price angle based on price analysis, interpreting the time vector in the form of price points on the price chart. In other words, the X axis and Y axis are represented as price points, so you can actually calculate the angle with two axes of the same dimension. This allows traders to obtain information about the direction of price movement and possible entry or exit points for trades. Let's look at the main characteristics and interpr
The " Fortune Long " bot works using pending orders and reacts to a channel breakdown with the direction of work in the channel; it is necessary to correctly calculate the levels of entry, stop loss, take profit, and the level of deviation of the pending order from the price. The bot needs to be optimized for 2 years with a forward period of 1/2. Once optimization is complete, select the best settings and save them. Work for 6 months. The bot automatically calculates all levels and the entry le
In the world of trading, one of the main concerns is finding a reliable trading system. Meet the TrendEdge Channel indicator - your reliable companion in this search. Developed based on complex mathematical calculations, this indicator predicts the most likely short-term price movements. TrendEdge Channel is designed specifically to identify trends in price movements. Thanks to it, you can quickly determine not only the direction of the trend, but also the levels of interaction between buyers
The TrendScope Pro indicator views the chart as a function with the X-axis representing time and the Y-axis representing price, expressed in bars and pips respectively. The main objective of the indicator is to provide users with signals for actions when the function forms continuous movement in one direction over a specific period of time. The indicator parameters need to be adjusted individually for each currency pair, as the price function varies for different pairs. The indicator provides
Trend Api
Sabina Fik
The "Trend Api" indicator is an innovative tool for trend analysis in the Forex market. It has unique features and a wide range of settings that will help traders make informed decisions when trading. This indicator is based on the analysis of the market trend and helps to identify the direction of price movement. It uses various mathematical algorithms and statistical methods to determine the strength and sustainability of a trend in the market. One of the key features of the "Trend Api" i
The Plasma Trend indicator is a simple technical indication that is used to determine the current trend direction in the market. The Plasma Trend indicator is a powerful tool for determining the direction of the trend in the Forex market. It is based on both standard technical indicators and proprietary mathematical calculations, which provides a more accurate and reliable trend determination. Its implementation in the form of lines of two colors simplifies the visual determination of a change
The " Fortune Long " bot works using pending orders and reacts to a channel breakdown with the direction of work in the channel; it is necessary to correctly calculate the levels of entry, stop loss, take profit, and the level of deviation of the pending order from the price. The bot needs to be optimized for 2 years with a forward period of 1/2. Once optimization is complete, select the best settings and save them. Work for 6 months. The bot automatically calculates all levels and the entry le
PricePulse Pro - Indicator of Simple Solutions! Using this indicator is very easy - just follow the colored arrows on the chart. The indicator algorithm takes into account daily price fluctuations and focuses on measuring the "candlestick" share in the trend. This indicator uses an algorithm that considers price changes based on various parameters such as H/C (high price/close), H/O (high price/open), LC (low price/close), LO (low price/open). This allows for a more detailed analysis of price
Introducing the PriceStream Channel - a classic channel indicator that allows traders to timely react to price movements beyond the established channel boundaries. This corridor is built based on the analysis of several candles, starting from the last one, which helps identify the extremes of the studied period. These extremes then create the channel lines. Trading within a channel is one of the most popular strategies in forex, and its simplicity makes it suitable even for beginners. The Pri
The "Trend Orbital" indicator is a tool for tracking trends in the financial asset market. It is based on the analysis of price data and provides a visual interpretation of the current direction of price movement. Options: InpAmplitude: Amplitude - determines the amount of volatility that the indicator takes into account when determining the trend. Group "Arrow": InpCodeUpArrow: Up Arrow Code - Defines the arrow symbol to display an uptrend. InpCodeDnArrow: Down Arrow Code - Defines the arrow
필터:
리뷰 없음
리뷰 답변