Time Levels for MT5
- 지표
- Yurij Izyumov
- 버전: 1.3
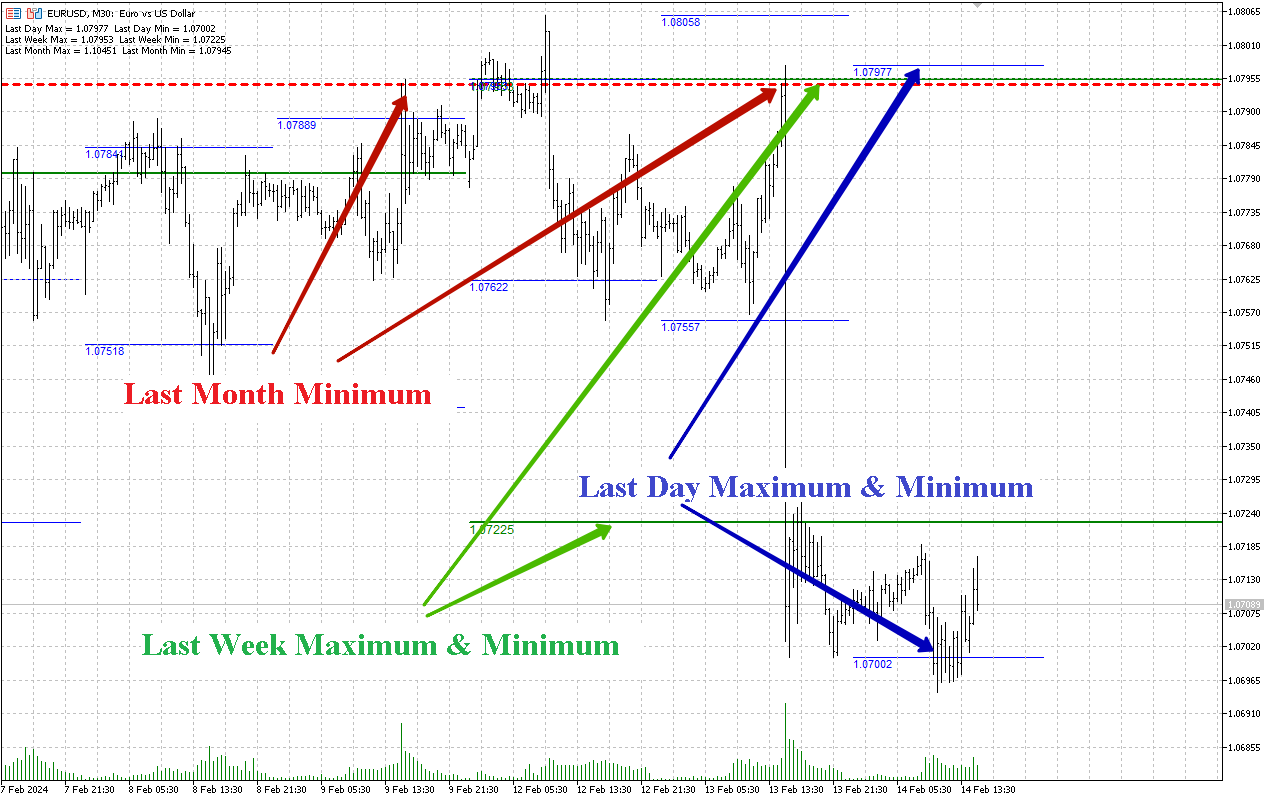
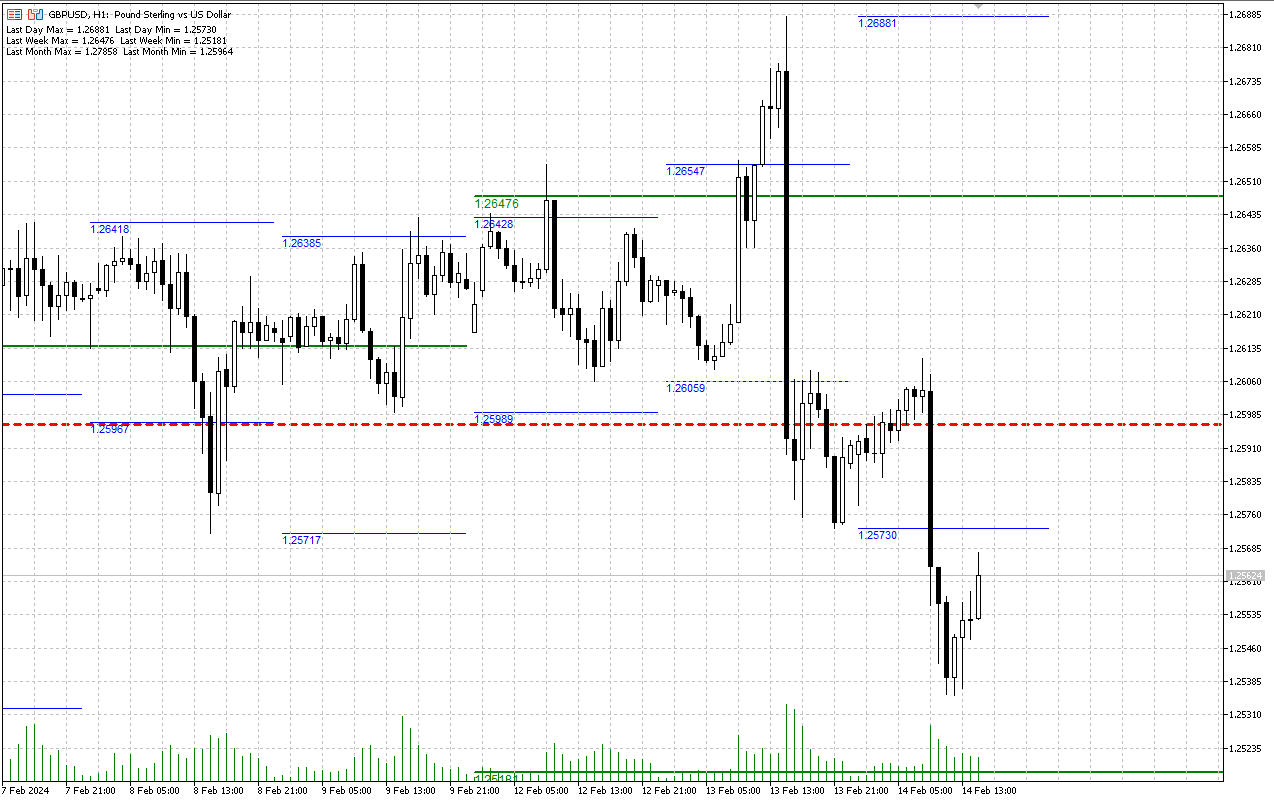
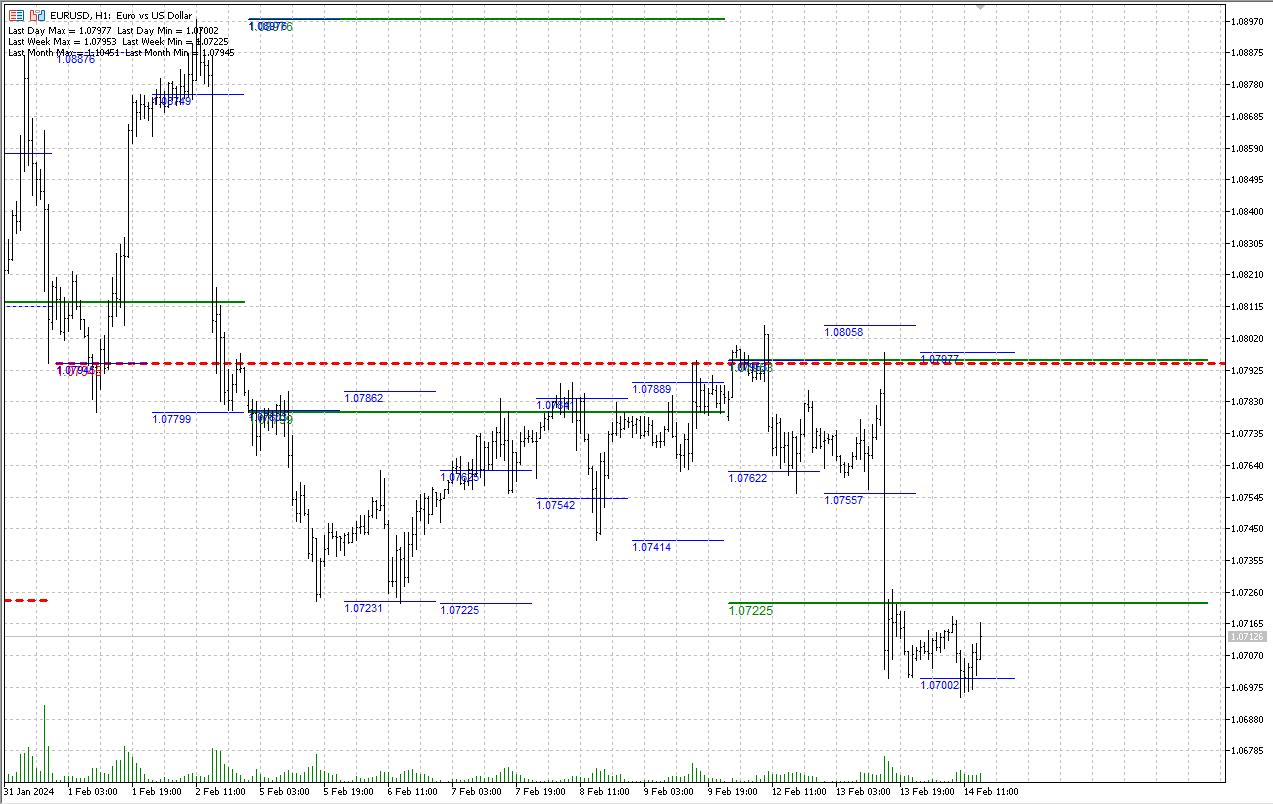
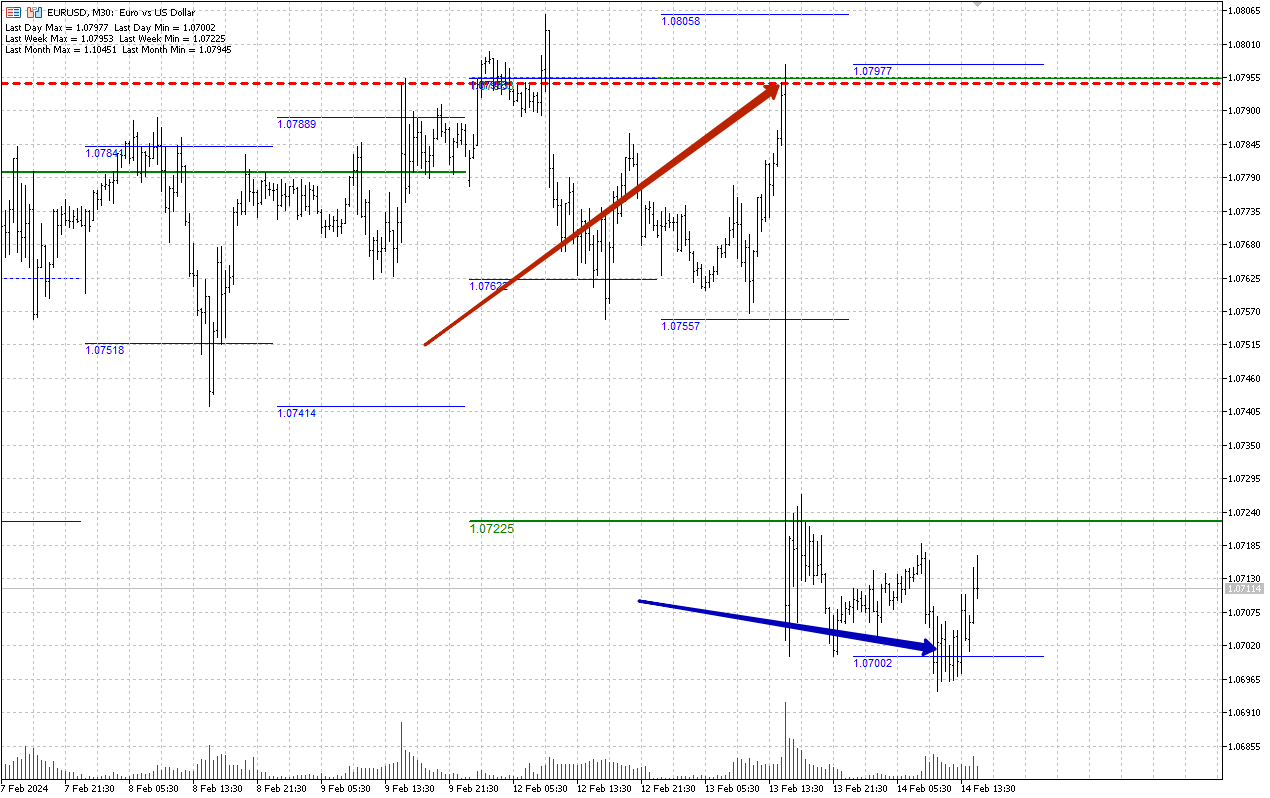
The indicator is designed for displaying the following price levels on the chart:
- Previous day's high and low.
- Previous week's high and low.
- Previous month's high and low.
Each of the level types is customizable. In the indicator settings, you set line style, line color, enable or disable separate levels.
Configurations
- ----Day-------------------------------------------------
- DayLevels - enable/disable previous day's levels.
- WidthDayLines - line width of daily levels.
- ColorDayLines - line color of daily levels.
- StyleDayLines - line style of daily levels. The parameter only works if WidthDayLines =1.
- DayFontSize - font size for the daily level labels.
- ----Week------------------------------------------------
- WeekLevels - enable/disable previous week's levels.
- WidthWeekLines - line width of weekly levels.
- ColorWeekLines - line color of weekly levels.
- StyleWeekLines - line style of weekly levels. The parameter only works if WidthWeekLines =1.
- WeekFontSize - font size for the weekly level labels.
- ----Month-----------------------------------------------
- MonthLevels - enable/disable previous month's levels.
- WidthMonthLines - line width of monthly levels.
- ColorMonthLines - line color of monthly levels.
- StyleMonthLines - line style of monthly levels. The parameter only works if WidthMonthLines =1.
- MonthFontSize - font size for the monthly level labels.
- ----Settings-----------------------------------------------
- GMThour - terminal time zone.
- WriteComments - show text comments featuring level values.