RaysFX 3 Stoch
- 지표
- Davide Rappa
- 버전: 6.0
- 활성화: 5
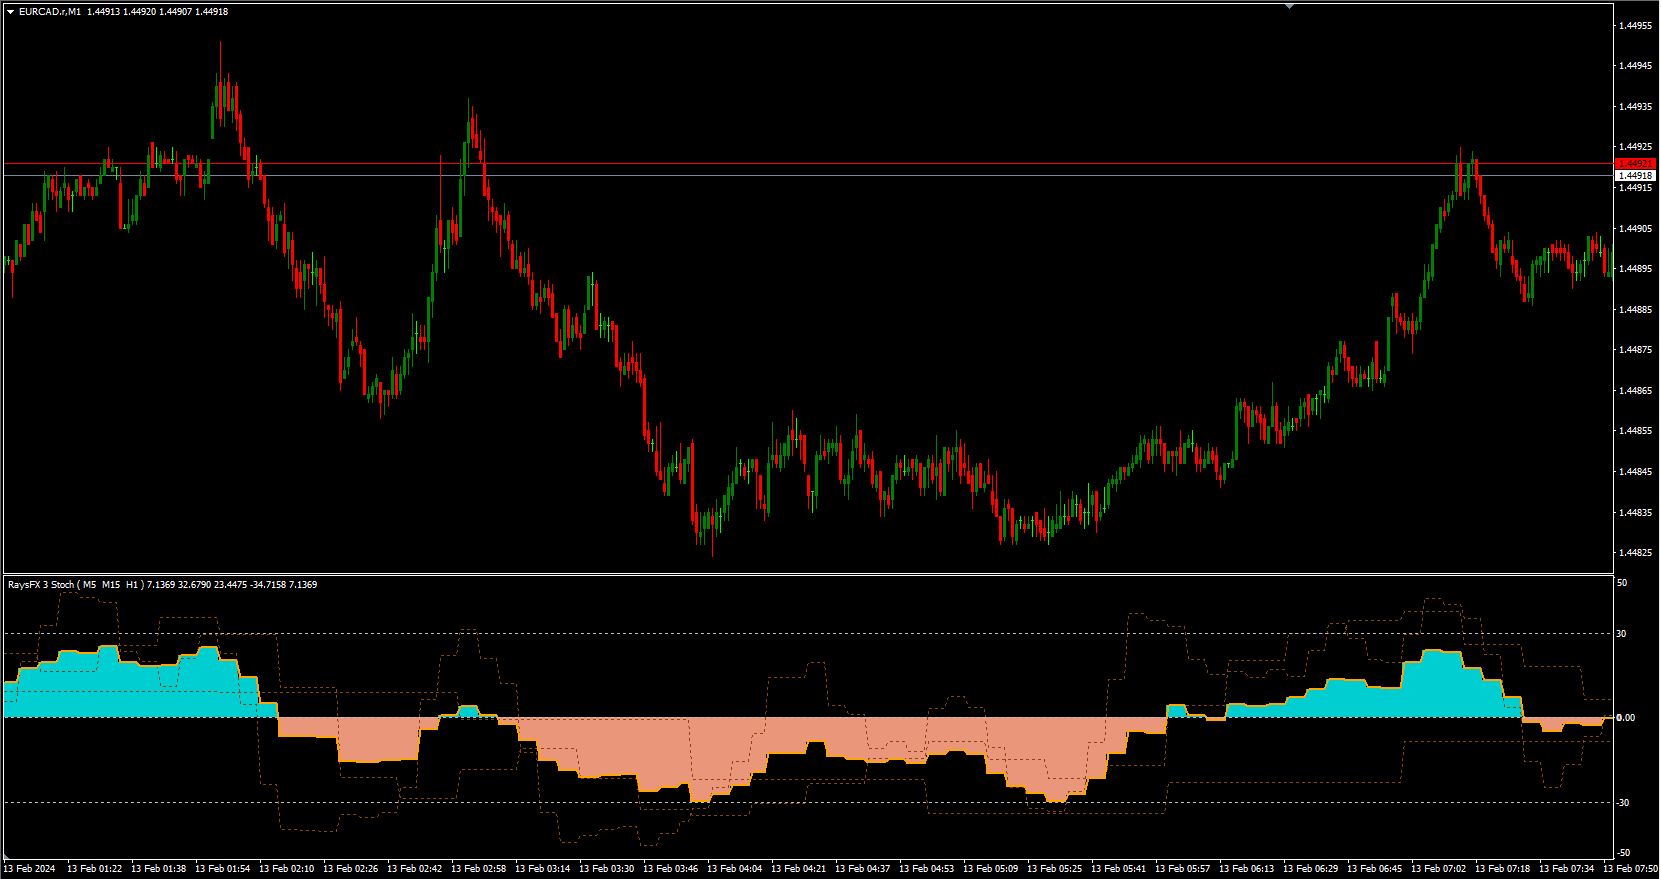
🔥 RaysFX 3 Stoch! 🔥
Sei un trader alla ricerca di un vantaggio competitivo? L’indicatore RaysFX 3 Stoch è l’aggiunta perfetta al tuo arsenale di trading.
Caratteristiche principali:
- Stocastico a 3 livelli: L’indicatore RaysFX 3 Stoch utilizza tre livelli di stocastico per fornire segnali di trading accurati e tempestivi.
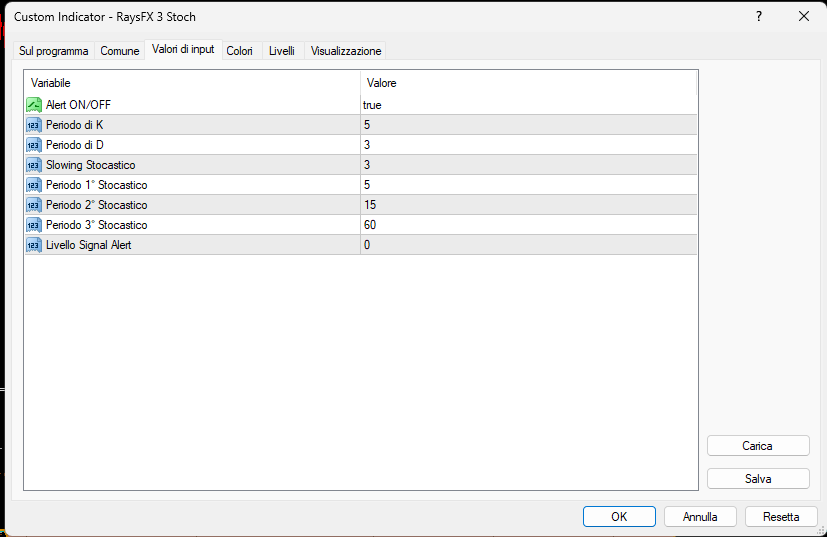
- Personalizzabile: Puoi personalizzare i periodi di K, D e Slowing, così come i periodi dei tre stocastici, per adattarsi al tuo stile di trading.
- Allerta integrata: L’indicatore ha un sistema di Alert integrato che ti avvisa quando il livello di segnale attraversa lo zero o raggiunge un livello specificato.