• 미리보기
  • 리뷰
  • 코멘트

Force Directional

포스 디렉셔널 지표

포스 디렉셔널 기술 지표는 가격 움직임의 상대적 강도를 측정하고 동시에 트렌드의 방향성을 식별하고 추적하는 데 도움이 되는 요소 세트를 모으는 아이디어에 기반합니다.

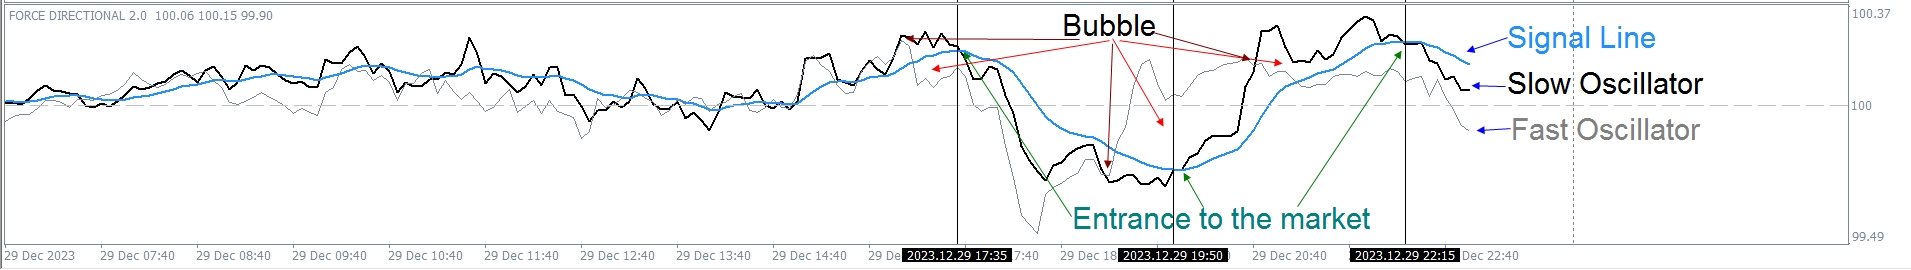
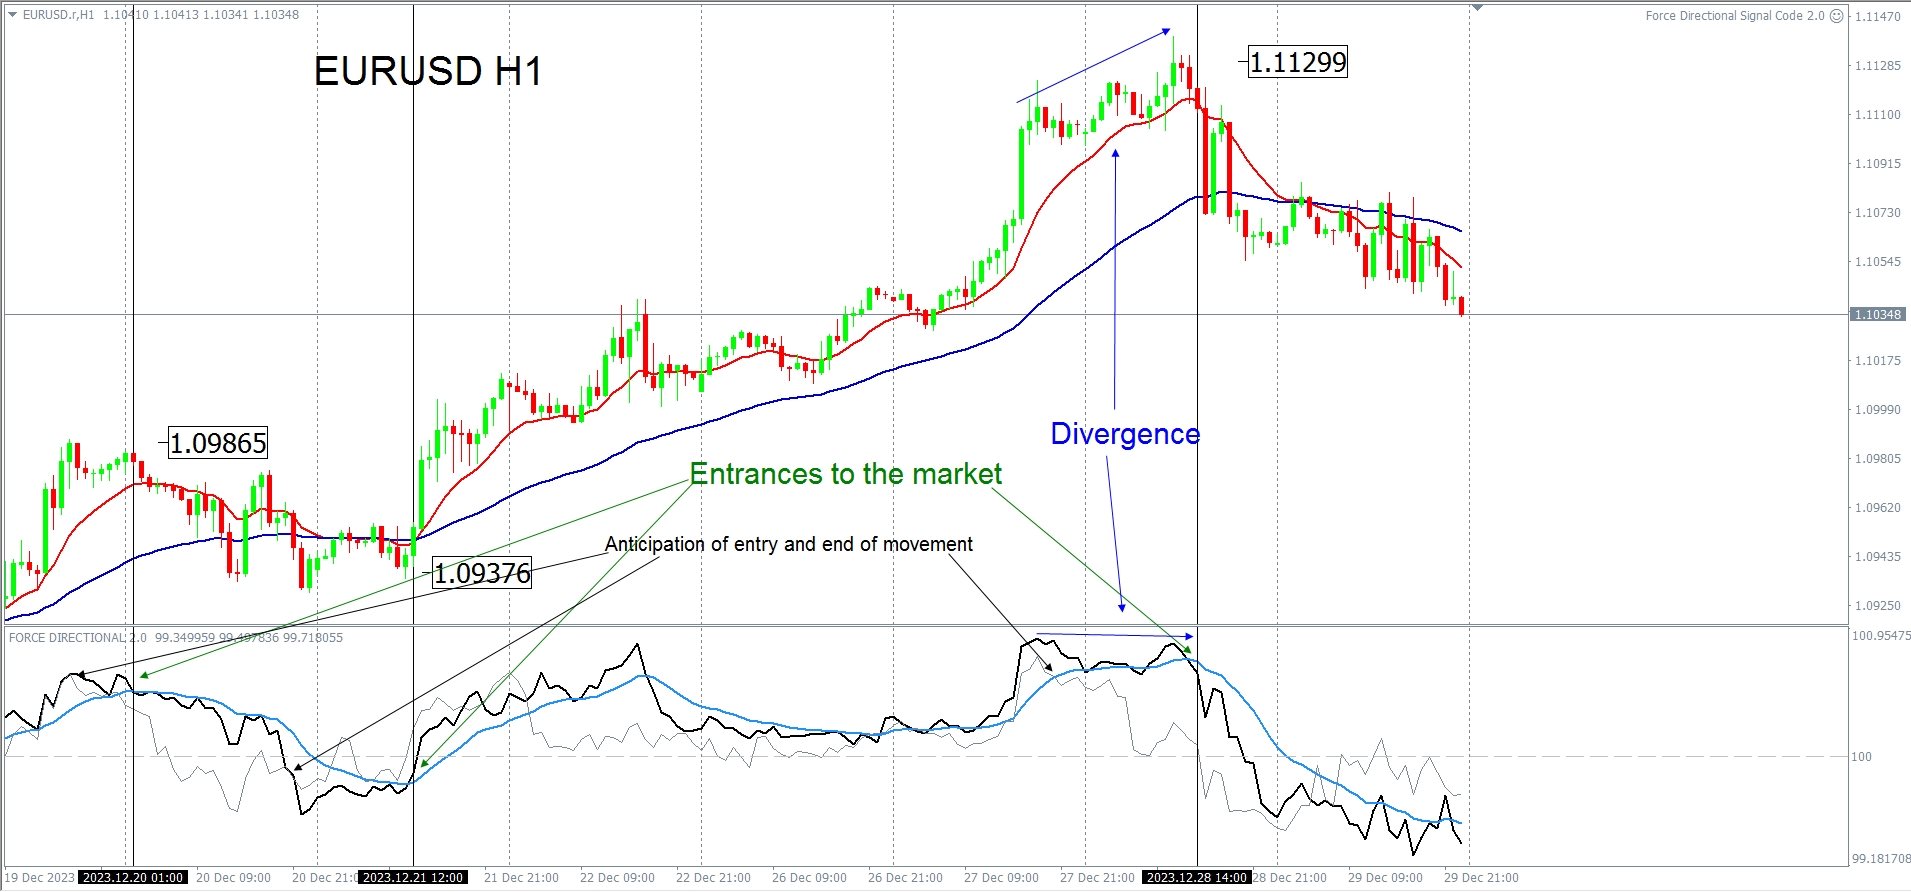
이 지표는 느린 오실레이터(검은 선), 빠른 오실레이터(회색 선) 및 지수의 중앙 선으로 작동하는 값이 감소한 신호 선(파란 선)으로 구성되어 있습니다. 이는 움직임의 반전을 식별하고 방향 가이드로도 작동합니다. 지표의 오실레이터는 100의 값 위나 아래로 이동하여 다른 기간 및 시간 프레임에서 마지막 가격의 종가와 이전 종가를 비교합니다.

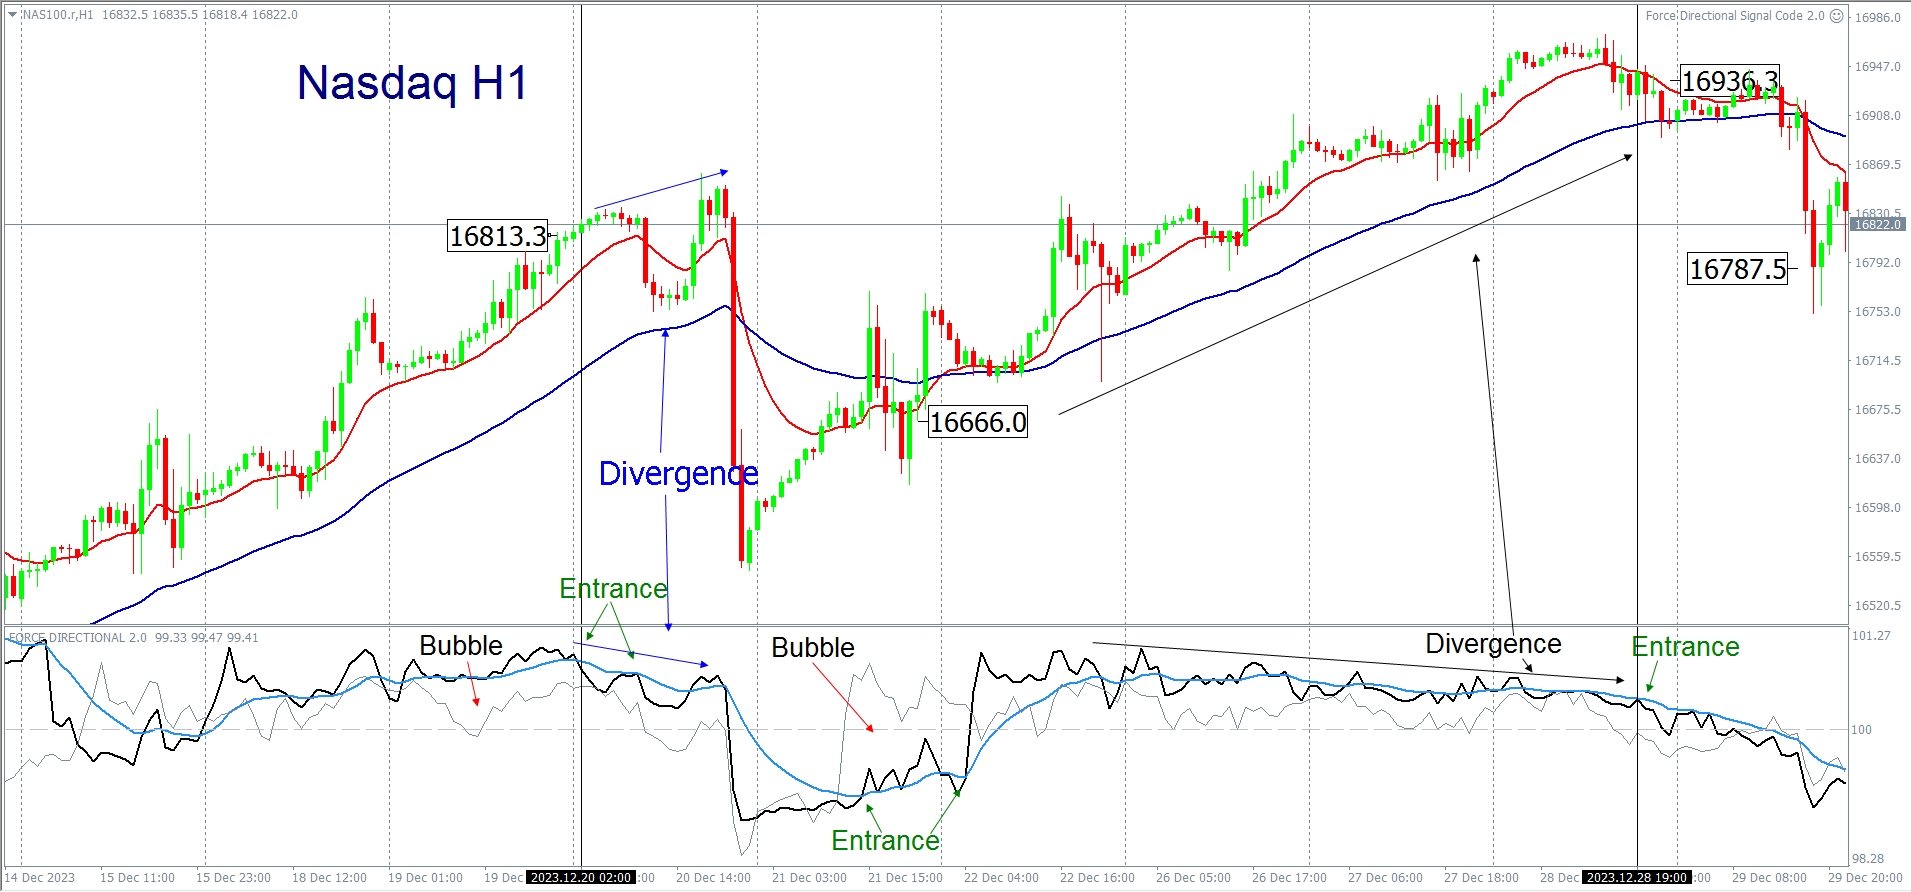
이 지표는 특히 트렌드 반전을 식별하는 데 효과적이며 어떤 시간 프레임에서도 성공적으로 사용될 수 있습니다. 그러나 보다 정확한 결정을 내리기 위해 움직임이나 트렌드의 강도를 평가하기 위해 보다 긴 시간 프레임에서 사용하는 것이 좋습니다.

사용 방법:
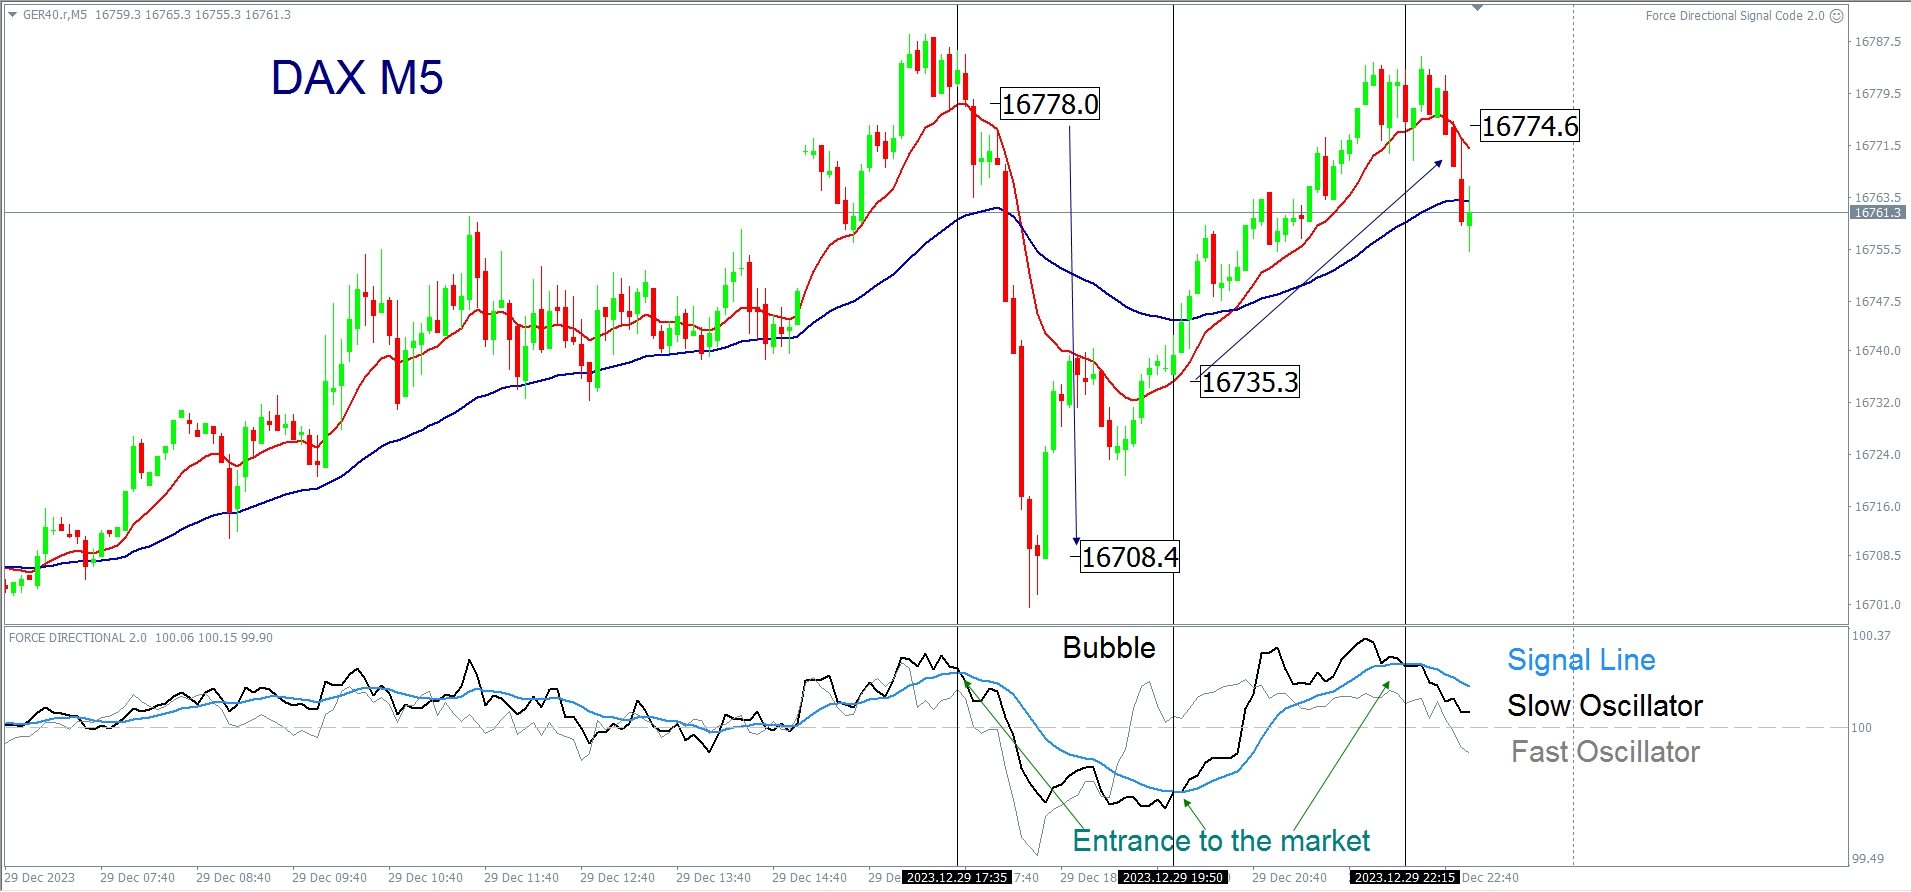
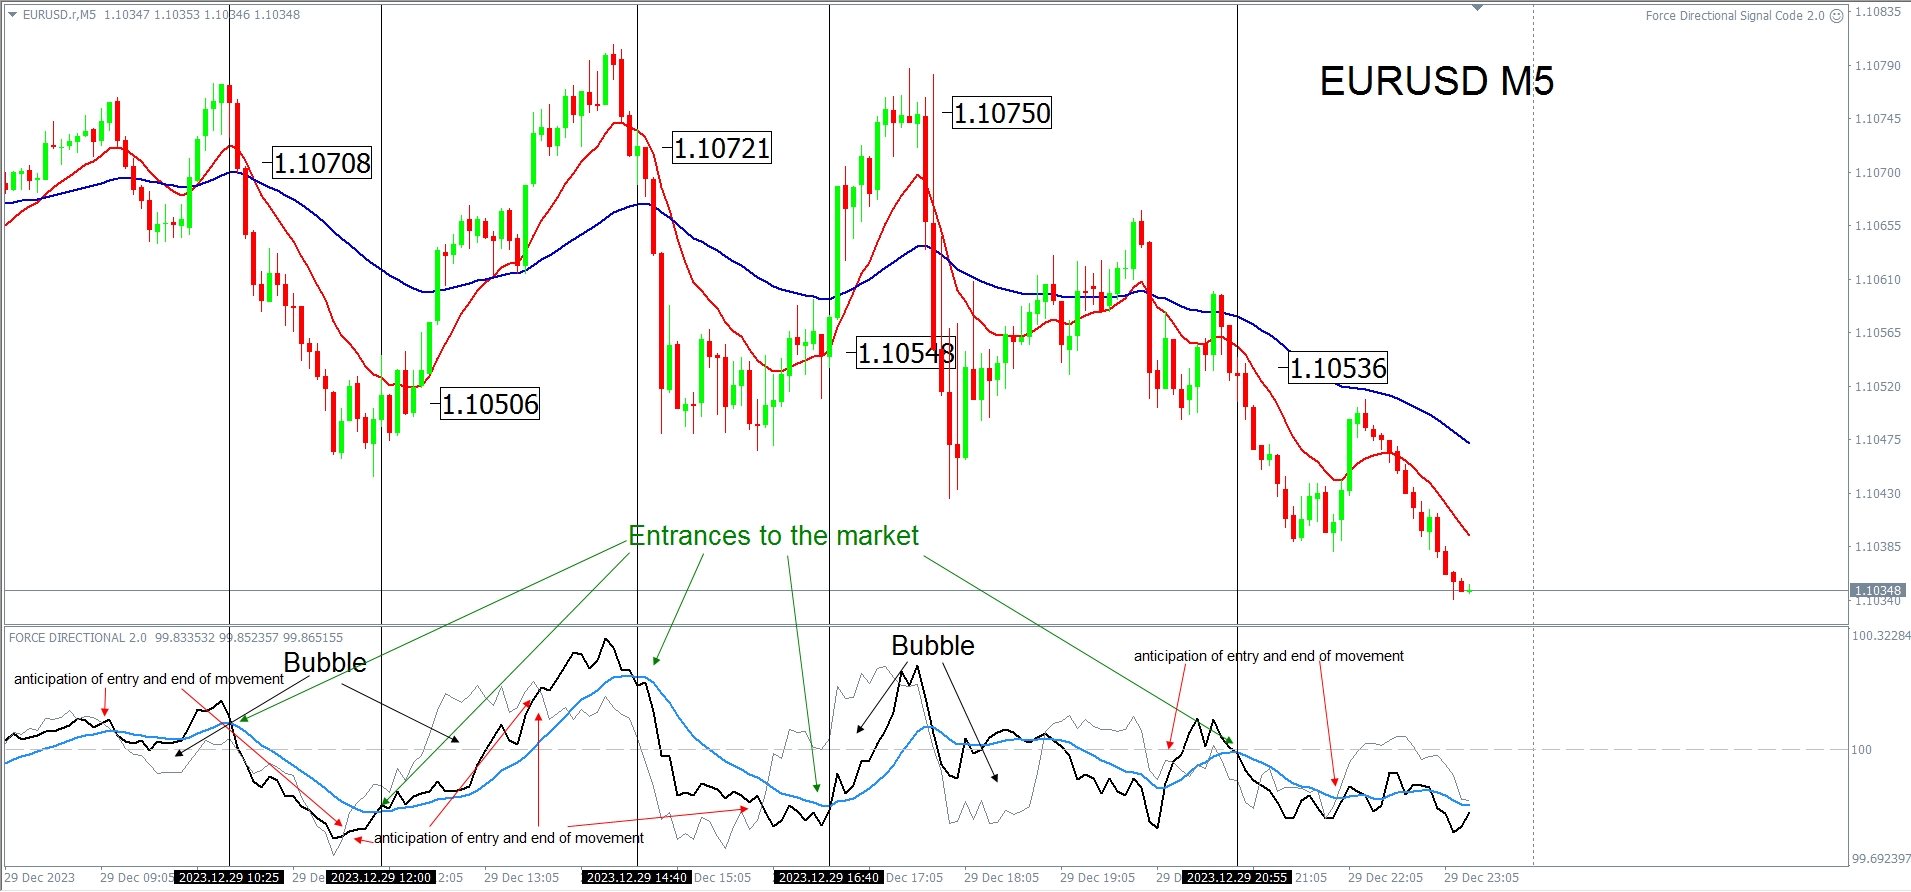
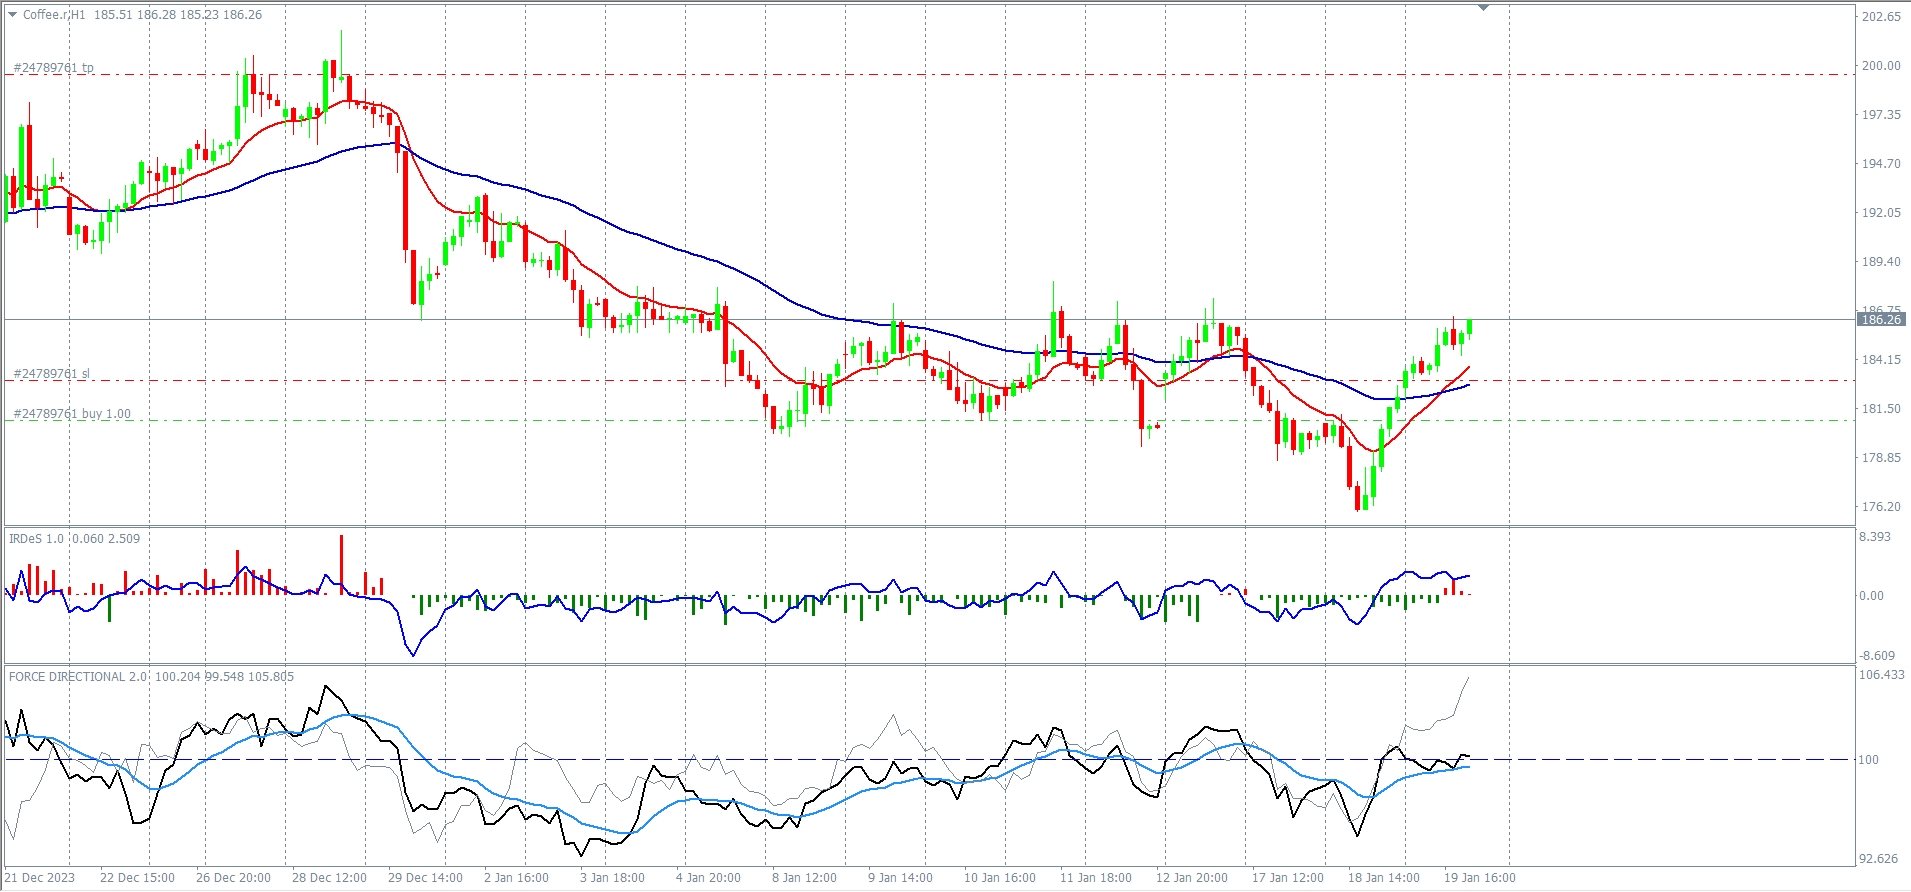
권장되는 전략은 느린 오실레이터가 100보다 작은 값을 가지고 신호 선을 상향으로 통과할 때 매수 포지션을 취하고, 100보다 큰 값을 가지고 하향으로 통과할 때 매도 포지션을 취하는 것입니다. 값의 확장이 클수록 진입이 더 효과적입니다. 느린 오실레이터가 신호 선 위에 있는 한 매수 포지션을 유지하고, 신호 선 아래에 있는 한 매도 포지션을 유지합니다.

주요 패턴:
버블: 종종 트렌드 반전을 예측하거나 포지션의 청산을 강조합니다. 빠른 오실레이터가 느린 오실레이터를 상향으로 통과하면(상승 트렌드 예측) 또는 하향으로 통과하면(하락 트렌드 예측) 형성됩니다. 버블은 트렌드의 강도와 그의 임
추천 제품
Diamond PRO
Fanur Galamov
5 (9)
Diamond PRO is enhanced powerful version of Diamond for advanced traders. Pro version includes optimized cores, new impoved entry points filters, new multistage profit closure algorithm and сontains number of external control parameter that allows build and fine tune own tradind decisions and algorithms. The system provides more accurate market entries, analyzes and filters upcoming economic news, contains spread protection and an advanced position management algorithm. Main goal of Diamond PRO
This is a new strategy for SUPPLY DEMAND areas It is based on a calculation using the tick volume to detect the big price action in market for both bear /bull actions this smart volume action candles are used to determine the supply and demand areas prices in between main supply and demand lines indicate sideway market  up arrows will be shown when prices moves above the main supply and the secondary supply lines Down arrows will be shown when prices moves below the main demand and the secondary
Black series MT4
Dmitriy Kashevich
1 (1)
Black series MT4 - The indicator is designed for trading on binary options with Timeframe M1-M5-M15 Multicurrency (Works on cryptocurrency and currency pairs) The signal appears when the candle opens Up to 90% correct signals There is no signal redrawing at all Can be used with other indicators. Good for scalping! In Settings there is: -Indicator working methods -I Allert Arrow color Red signal down Blue signal up Also watch the video how the indicator works and signals
Introduction It is common practice for professional trades to hide their stop loss / take profit from their brokers. Either from keeping their strategy to the themselves or from the fear that their broker works against them. Using this indicator, the stop loss / take profit points will be drawn on the product chart using the bid price. So, you can see exactly when the price is hit and close it manually.  Usage Once attached to the chart, the indicator scans the open orders to attach lines fo
Max LotSize
Luis Alberto Atuncar Sanchez
5 (2)
LotSize Indicator Discover the appropriate lot size to use in your trades based on the available margin. This indicator provides valuable information for risk management. If the indicator shows a value of 0, it means that your balance or available margin is insufficient for trading. It is important to maintain adequate margin levels for safe trading practices. This indicator is exclusively designed for the MT4 platform, a popular and reliable trading platform in the market. With the LotSize Indi
FREE
VR Cub
Vladimir Pastushak
VR Cub 은 고품질 진입점을 얻는 지표입니다. 이 지표는 수학적 계산을 용이하게 하고 포지션 진입점 검색을 단순화하기 위해 개발되었습니다. 지표가 작성된 거래 전략은 수년 동안 그 효율성을 입증해 왔습니다. 거래 전략의 단순성은 초보 거래자라도 성공적으로 거래할 수 있다는 큰 장점입니다. VR Cub은 포지션 개시 지점과 이익 실현 및 손절매 목표 수준을 계산하여 효율성과 사용 편의성을 크게 높입니다. 간단한 거래 규칙을 이해하려면 아래 전략을 사용한 거래 스크린샷을 살펴보세요. 설정, 세트 파일, 데모 버전, 지침, 문제 해결 등은 다음에서 얻을 수 있습니다. [블로그] 다음에서 리뷰를 읽거나 작성할 수 있습니다. [링크] 버전 [MetaTrader 5] 진입점 계산 규칙 포지션 개설 진입점을 계산하려면 VR Cub 도구를 마지막 최고점에서 마지막 최저점까지 늘려야 합니다. 첫 번째 지점이 두 번째 지점보다 빠른 경우, 거래자는 막대가 중간선 위에서 마감될 때까지 기다립
Blahtech Market Profile
Blahtech Limited
4.61 (18)
Was: $249  Now: $99   Market Profile defines a number of day types that can help the trader to determine market behaviour. A key feature is the Value Area, representing the range of price action where 70% of trading took place. Understanding the Value Area can give traders valuable insight into market direction and establish the higher odds trade. It is an excellent addition to any system you may be using. Blahtech Limited presents their Market Profile indicator for the MetaTrader community. Ins
캔들의 종가를 예측하는 지표입니다. 지표는 주로 D1 차트에서 사용하기 위한 것이. 이 지표는 전통적인 외환 거래와 바이너리 옵션 거래 모두에 적합합니다. 지표는 독립형 거래 시스템으로 사용하거나 기존 거래 시스템에 추가로 사용할 수 있습니다. 이 표시기는 현재 양초를 분석하여 양초 본체 내부의 특정 강도 요인과 이전 양초의 매개변수를 계산합니다. 따라서 지표는 시장 움직임의 추가 방향과 현재 양초의 종가를 예측합니다. 이 방법 덕분에 지표는 단기 및 중장기 거래 모두에 적합합니다. 지표를 사용하면 시장 상황을 분석하는 동안 지표가 생성할 잠재적 신호의 수를 설정할 수 있습니다. 표시기 설정에는 이를 위한 특별한 매개변수가 있습니다. 또한 인디케이터는 새로운 신호에 대해 차트의 메시지 형태, 이메일 및 PUSH 알림 형태로 알릴 수 있습니다. 구매 후 저에게 꼭 써주세요! 나는 당신에게 지표와 거래에 대한 나의 추천을 줄 것입니다! 또한 보너스를 받으세요!
here is a link to back test results https://youtu.be/9BYDwS9aaqM https://youtu.be/iLxh43HV91Y However, the difficult task here for traders is to understand and select the indicator or tool that can help them with their trading plan and benefit their trading style. Traders want a tool that requires minimal effort and provides as much support as it can. There are multiple reasons for which traders need an indicator. One such reason is to determine the buy-sell signals in the market. The
Noize Absorption Index MT4
Ekaterina Saltykova
5 (1)
Noize Absorption Index - is the manual trading system that measures the difference of pressure between bears forces and bulls forces. Green line - is a noize free index that showing curent situation. Zero value of index shows totally choppy/flat market.Values above zero level shows how powerfull bullish wave is and values below zero measures bearish forces.Up arrow appears on bearish market when it's ready to reverse, dn arrow appears on weak bullish market, as a result of reverse expectation. S
Delta Pairs
Anatolii Zainchkovskii
1 (1)
Delta Pairs is an indicator for pair trading, it displays the divergence of two currency pairs. Does not redraw. A useful tool for the analysis of the behavior of two currency pairs relative to each other. Purpose The Delta Pairs indicator is designed for determining the divergences in the movements of two currency pairs. This indicator is displayed as two line charts and the difference (delta) between these charts in the form of a histogram. The Delta Pairs indicator will be useful for those
Moving VVC mt4
Andriy Sydoruk
The   Visual Volatility Clustering   indicator clusters the market based on volatility. The indicator does not redraw and gives accurate data, does not use closing prices. Uses the opening prices or the highs or lows of the previous completed bar. Therefore, all information will be clear and unambiguous. The essence of the indicator is to divide the price market into certain areas according to a similar type of volatility. This can be done in any way. In this example, the indicator is configure
Infinity Trend Pro
Yaroslav Varankin
1 (1)
This is a trend indicator without redrawing Developed instead of the binary options strategy (by the color of the Martingale candlestick) Also works well in forex trading When to open trades (binary options) A signal will appear in the place with a candle signaling the current candle It is recommended to open a deal for one candle of the current timeframe M1 and M5 When a blue dot appears, open a deal up When a red dot appears, open a trade down. How to open trades on Forex. When a signal is rec
PipFinite Exit EDGE
Karlo Wilson Vendiola
4.89 (160)
Did You Have A Profitable Trade But Suddenly Reversed? In a solid strategy, exiting a trade is equally important as entering. Exit EDGE helps maximize your current trade profit and avoid turning winning trades to losers. Never Miss An Exit Signal Again Monitor all pairs and timeframes in just 1 chart www.mql5.com/en/blogs/post/726558 How To Trade You can close your open trades as soon as you receive a signal Close your Buy orders if you receive an Exit Buy Signal. Close your Sell orde
Trend Catcher with Alert
Issam Kassas
4.8 (44)
트렌드 캐쳐: 알림 인디케이터와 함께 하는 트렌드 캐쳐 전략은 시장 트렌드와 잠재적인 진입 및 체크 포인트를 식별하는 데 도움이 되는 다목적 기술 분석 도구입니다. 이는 시장 상황에 적응하여 트렌드 방향을 명확하게 시각적으로 표현하는 동적 트렌드 캐쳐 전략을 제공합니다. 트레이더는 선호도와 위험 허용도에 맞게 매개변수를 사용자 정의할 수 있습니다. 이 인디케이터는 트렌드 식별을 지원하고 잠재적인 반전을 신호로 제공하며 트레일링 스탑 메커니즘으로 작동하며 실시간 경고를 제공하여 신속한 시장 대응을 돕습니다. 특징: - 트렌드 식별: 상승 트렌드와 하락 트렌드를 신호합니다. - 트렌드 반전: 양봉 색상이 상승에서 하락으로 변경되거나 그 반대의 경우 잠재적인 반전을 경고합니다. - 실시간 경고: 새로운 트렌드 식별을 위한 경고를 생성합니다. 추천사항: - 통화 및 페어: EURUSD, AUDUSD, XAUUSD 등... - 시간 프레임: H1. - 계정 유형: 모든 E
FREE
Gyroscopes
Nadiya Mirosh
Gyroscope        professional forex expert   (for EURUSD, GBPUSD, USDJPY, AUDUSD, USDCHF, EURGBP, EURJPY, NZDUSD, USDCAD, EURCHF, AUDJPY, CADJPY pairs)   alyzing the market using the Elliot Wave Index. Elliott wave theory is the interpretation of processes in financial markets through a system of visual models (waves) on price charts. The author of the theory, Ralph Elliott, identified eight variants of alternating waves (of which five are in the trend and three are against the trend). The mo
DracoAI
Hua Manh Hung
DracoAI is a revolutionary automated forex trading robot based on neural network.  Loss coverage is our premium exclusive feature. DracoAI IS: THE BEST MONEY MAKING SERVICE & STABLE PASSIVE INCOME PROFIT, EVEN IF YOU DO NOT PARTICIPATE IN BIDDING FINANCIAL INDEPENDENCE AND STABILITY DracoAI IS SAFE, BECAUSE: WE GUARANTEE THE SAFETY OF YOUR FUNDS NEGATIVE RESULTS OF TRADING ARE COVERED BY OUR RESERVE FUND 100% CONFIDENTIALITY Monitoring  - most popular signal at MQL5 :  https://www.mql5.com/en/
Signaline
Ahmet Metin Yilmaz
SIGNALINE INDICATOR This indicator for all pairs and all timeframes I have just completed the M5 timeframe for deep optimization EURJPY yet. EURJPY M5 Optimization ( TP=150 , SL=130 , IndicatorPeriod=6 , Mov1=22 , Mov2=48 ) (*)Added 20.05.2019 You can find this signal page below https://www.mql5.com/en/signals/583477 Other optimizasyon results will be added on this signalpage. Input Parameters: IndicatorPeriod: Default is 8. Mov1               : Default is 21. Mov2               : Default is 48.
Night ghost
Dmitriy Kashevich
Night Ghost - Arrow indicator for binary options. This is a reliable assistant to you in the future! - No redrawing on the chart -Works great on EUR/USD currency pairs! -Indicator accuracy up to 90% (Especially at night) -No long setup required (Perfectly set up for Binary Options) - Not late signals - The appearance of a signal on the current candle -Perfect for M1 period (No More!) - Eye-friendly candle color (Red and Blue) -Installed Alert Working with it: - Blue arrow
Owl smart levels
Sergey Ermolov
4.63 (54)
MT5 버전  |   FAQ Owl Smart Levels Indicator 는   Bill Williams 의 고급 프랙탈, 시장의 올바른 파동 구조를 구축하는 Valable ZigZag, 정확한 진입 수준을 표시하는 피보나치 수준과 같은 인기 있는 시장 분석 도구를 포함하는 하나의 지표 내에서 완전한 거래 시스템입니다. 시장과 이익을 취하는 장소로. 전략에 대한 자세한 설명 표시기 작업에 대한 지침 고문-거래 올빼미 도우미의 조수 개인 사용자 채팅 ->구입 후 나에게 쓰기,나는 개인 채팅에 당신을 추가하고 거기에 모든 보너스를 다운로드 할 수 있습니다 힘은 단순함에 있습니다! Owl Smart Levels   거래 시스템은 사용하기 매우 쉽기 때문에 전문가와 이제 막 시장을 연구하고 스스로 거래 전략을 선택하기 시작한 사람들 모두에게 적합합니다. 전략 및 지표에는 눈에 보이지 않는 비밀 공식 및 계산 방법이 없으며 모든 전략 지표는 공개되어 있습니다. Owl Smart Lev
Blahtech Supply Demand
Blahtech Limited
4.63 (35)
Was: $299  Now: $99   Supply Demand uses previous price action to identify potential imbalances between buyers and sellers. The key is to identify the better odds zones, not just the untouched ones. Blahtech Supply Demand indicator delivers functionality previously unavailable on any trading platform. This 4-in-1 indicator not only highlights the higher probability zones using a multi-criteria strength engine, but also combines it with multi-timeframe trend analysis, previously confirmed swings
The Chaikin Oscillator is a technical indicator developed by Marc Chaikin that combines price and volume data to measure the accumulation and distribution of a financial instrument. It aims to identify potential buying and selling opportunities in the market. The Chaikin Oscillator is calculated by subtracting a 10-day exponential moving average of the Accumulation Distribution Line (ADL) from a 3-day exponential moving average of the ADL. Here's how to use the Chaikin Oscillator indicator in tr
Awesome Oscillator by Bill Williams with the ability to fine-tune and replace the averaging algorithms of the indicator, which significantly expands the possibilities of using this oscillator in algorithmic trading and brings it closer in its properties to such an indicator as the MACD. To reduce price noise, the final indicator is processed with an additional Smooth averaging. The indicator has the ability to give alerts, send mail messages and push signals when the direction of movement of th
The Th3Eng PipFinite indicator is based on a very excellent analysis of the right trend direction with perfect custom algorithms. It show the true direction and the best point to start trading. With StopLoss point and Three Take Profit points. Also it show the right pivot of the price and small points to order to replace the dynamic support and resistance channel, Which surrounds the price. And Finally it draws a very helpful Box on the left side on the chart includes (take profits and Stop loss
Binary Option Signal
Yaroslav Varankin
Indicator for binary options arrow is easy to use and does not require configuration works on all currency pairs, cryptocurrencies buy signal blue up arrow sell signal red down arrow tips do not trade during news and 15-30 minutes before their release, as the market is too volatile and there is a lot of noise it is worth entering trades one or two candles from the current period (recommended for 1 candle) timeframe up to m 15 recommended money management fixed lot or fixed percentage of the depo
Market Profile 3
Hussien Abdeltwab Hussien Ryad
4 (4)
Market Profile 3 MetaTrader 4 indicator  — is a classic Market Profile implementation that can show the price density over time, outlining the most important price levels, value area, and control value of a given trading session. This indicator can be attached to timeframes between M1 and D1 and will show the Market Profile for daily, weekly, monthly, or even intraday sessions. Lower timeframes offer higher precision. Higher timeframes are recommended for better visibility. It is also possible t
FREE
Candle EA MT4
Mansour Babasafary
4.58 (38)
This expert is based on patterns The main patterns of this specialist are candlestick patterns Detects trends with candlestick patterns It has a profit limit and a loss limit, so it has a low risk The best time frame to use this expert is M30 time frame The best currency pairs to use with this expert is the EURUSD, GBPUSD, AUDUSD, USDCAD currency pairs The price will increase by 100$ after every 10 purchases! Final price 2450$ Get a 50% bonus by buying (or even renting) any of our product
Reversal Monster Mini
Abdulfattah Yahya Mohammed Alhazmi
The Most advanced and comprehensive EA to trade Trend Reversals/Pullbacks It is a very profitable EA, to trade trends breakout, and manage trades, takeprofit, stoploss, move to breakeven, and trailing stop. The   “Reversal Monster EA”   trades Reversal/Pullbacks when the current price of the pair pullback to a predefined horizontal level or trendline on the currency chart. The opening of the position can be immediate after pullback to the drawn trendline or after closing the candle below/abov
FREE
This system created by using Corrected MACD,ADX, Different time zone support and resistant points,  tree Parabolic Sars,two Bollinger band, 3 moving average, stochastic oscillator and ADX. In this system, Using parabolic Sars reverse bar count,  Pips difference between closing price and last parabolic Sars in the direction of signal and Trend strength.   Note that this system is not martingale, this system is creating limit order.    Best result for the orders are 45 Pips in USD, 75 Pip
This indicator prepared by using 57 days moving averagr and least square method. It can only work for 1 hr time interval. Once a signal created. It is creating order and 2 limit orders. It works in CFD pairs as well as in Forex pairs. You can fins our other products from link : https://www.mql5.com/en/users/drbastem/seller Also, you can ask all your questins from email : haskayafx@gmail.com or mobile : +90 530 867 5076 or @MehmetBastem on telegram application This system is for Long term and pr
이 제품의 구매자들이 또한 구매함
IA Trendx3 PRO
Marco Aurelio Santos Costa
What if God Created a Trade System? No miracles... Just see how mathematics can be effective in the market. We managed to combine technical analysis / price action into indicators, creating the best setup for trading, be it in Forex, Indices, or stocks. It took us 2 years to create something that really works, and now it's time for you to discover it. TrendX3 is a revolution in trend analysis. Based on advanced algorithms and real-time data, it provides valuable insights so that you can make inf
Ferox Breakout
Tat Dat Nguyen
The breakout algorithm is a technique based on price, price features, to shape a breakout strategy. The strategy in this indicator will not be redrawn (none-repaint indicator), it is suitable for short or long term traders In the screenshot is the EURUSD pair, these currency pairs, commodities or stocks, it have similar strength *Non-Repainting (not redrawn) *For Metatrader4 Only *Great For Scalping *Great For Swing Trading *Arrow Entry, Green is Long, Red is Short *Works On Any Timeframe *Work
The indicator displays the probable ( Support and resistance ) levels. The indicator draws horizontal and trend levels of support and resistance. The indicator settings: Trends - the mode for displaying trend lines or horizontal lines of support and resistance Yes - display trend lines only No - display horizontal lines only UseResource - use the resources built into the indicator. Yes - use the ZigZag indicator from the resources of the product. No - use a custom ZigZag indicator. HistoryBar -
THE GRAFF III
Antonin Skaryd
The [GRAFF] III manual trading system is based on multiple MetaTrader (MT4) indicators. Together, the entire PACK of GRAFF III indicators makes an advanced trading tool. The system consists of over 20 different custom-built indicators which have been carefully selected and tested in the long term to produce strong and efficient trading signals. The particular indicators are based on different mathematical formulas, so the entire system is calibrated to remove false signals from its own indicator
Sweet Waffle
Christophe Godart
The arrows are calculated with: -     2 Parabolic  parameters -     2 ADX parameters -     4 Stochastic parameters We recommend to combine it with Parabolic, ZigZag or Elliot waves indicator. Always trade the trend! If you make sure to draw your trend lines and support/resistance zones you will just have to wait for the signal to appear. Take the trade. For Binary Options it is advisable to set the expiry time to 5-15 min in M1 chart. THIS INDICATOR IS ZERO REPAINT Best assets to trade: -
Let´s try to make some real money! Call me profit addicted. I thought why not try to make THE dream come reality. With discipline, a clear strategy and this indicator I focus on entering the perfect trades. This indicator is very easy to use as you will get perfect entry points for Put or Call trades. The arrows are calculated with: -     Momentum  parameters -     Candle stick patterns -     Fundamental Price action We recommend to combine it with Parabolic, ZigZag or Elliot waves indic
Golden Chip
Daishon Cotman
Golden Chip provides Basic Market Structure, Fibonacci, supply and Demand Zones. Letting you identify when a sell off point is approaching or whne a buy opportunity is arriving. The awesome thing about Golden Chip is that, you will see rejection levels or continuation before ANYBODY ! This indicator moves directly with price and lines up perfectly with the Chart. Some indicators would lag but NOT this one ! Golden Chip is amazing for Clean chart (Naked Chart). GOLDEN CHIP IS ONLY ON METATRADER (
The channels
Mansour Rahkhofteh
Counter trade type indicator. Jcounter can capture the timing of the trend collapse phase. There are signs of a trend collapse. It is the world standard to confirm the sign with LSMA adopted by Jcounter. The numerical setting of LSMA is very important, but after many years of verification, the numerical value was identified and completed. When the trend starts, the rising market moves like a support, and the falling market moves like a resistance. Gradually overtake the candlest
Axebagsh
Batsukh Sumchin Khuyagbaatar
Only work on Crude Oil H1  time frame  Swing follow trend.  do not trade against trends Specifies the first destination and entry and exit points For 16 years, I only traded on CrudeOil. Crude oil is one of the most extreme combinations in the world and it is safe to say that such a good indicator has never been made before.   This indicator will save you a lot of money because it introduces a new type of approach, Good luck
Forex Signal Generator is a cutting edge technology for Trend Trading, and filtering all inbuilt in one tool. The Signal Generator  analysis the market like a Pro  by using its smart algorithms to detect  the trend, filter out market noise  and display on  your chart with the : ENTRY, STOPLOSS AND TARGET PROFIT Advantages You Get     Access to the proven reliable trend indicator based     Easy and  effective trend detection.     Gives you the ability to filter  out  'NOISE' from the ma
Premium support and resistance - the best combination of different indicators allowed us to create the best product on the market! And that's Premium support and resistance! A convenient and flexible tool that will help you in trading! Shows where the price will go from the support and resistance levels! The arrows Blue buy Red sell will help you with this! Alert is already built into the indicator for your convenience! Alert in order not to miss the "Own" signal! It is already co
CFF Dark M Volume
Abdalla Mohamed Kandil
CFF Dark M Volume This is the most accurate Volume Reversal & Trend Following System for MT4 providing accurate signals to enter a trade without redrawing or delays.   It can be applied to:  All MT4 Charts . . The best results are on the timeframe 1H & 4H     IMPORTANT! Contact me after your purchase to get the detailed guide.   Most traders are %99 accurate with the help of CFF Dark Money Volume System.    Benefits of CFF Dark M Volume System  Entry signals  based on real volume of
MMM Gold Sniper
Gilang Wardhana Purnama Putra
Indicator is based on Market Maker Strategy. NO REPAINT. MM's are traders and their objective is to make money.  This includes strategies to trade against retails traders.  The major difference between them and other traders is that they have the ability, through access to massive volumes, to move price at their will.  So to make money, they aim to buy at a lower price and then sell at a higher price. They achieve this by:  1. Inducing traders to take positions. This is achieved by using a ran
IconTrade
Vadim Gorodetskii
Place the indicator on the chart, preferably with a timeframe of H1 or H4. If you are trading in the daily range or, conversely, on lower timeframes, you will need to adjust the RSI and ATR levels accordingly.  The blue arrows of the indicator will be a signal to open a long position, the red arrows will be a signal to open a short position: 1) Blue arrow for longs (growth) and red arrow for shorts (decline). 2) Two horizontal lines for current positions (one for entry and one for stop). 
WARNING!! THIS SWORD IS TOO SHARP!    ONLY 10 COPIES LEFT FOR THE NEXT PRICE TO BE 8,000$ FOR UNLIMITED PLAN. Dear traders I am very glad once again to introduce to you my other tool called "Forex Sword Indicator". In short this tool is meant to give you an edge over the market that you have been waiting for  so long. Now, here it is. It is a very very simple tool but yet a dangerous sword. I call it a  Holy grail indicator!. I will not talk a lot about this tool. Just let the tool speak by itse
IconTradeSL
Vadim Gorodetskii
IconTradeSL.  Возможность выставлять sl по уровням. В индикаторе установлена возможность показывать историю уровней на графике. Возможность выставлять sl по уровням. Настройки индикатора: ЦВЕТ_BAR - цвет баров по которым ищем SL ЦВЕТ_Тек_BAR - Purple;//цвет текущего бара BAR - поиск в последних BAR барах (по умолчанию 200) show_bar - показывать бары по которым ищем SL
Jeslyn
Justine Kelechi Ekweh
이것은 스캘퍼 시스템 또는 매우 강력한 모멘텀, 바이너리 옵션 거래자 또는 자동화 거래에 서 범용 EA가 사용하는 전략으로 Forex 수동 거래자 모두에게 적합한 다목적 시스템입니다. Jeslyn은 수년간의 연구를 기반으로 한 전략이며 특정 가격 행동 전략에 중점을 둡니다. 단순한 화살표 표시처럼 보이지만 정교하고 논리적인 알고리즘을 가지고 있습니다. 지표에서 계산을 하지 않고 가격 행동에 대한 계산만 합니다. 나는 추세, 모멘텀과의 차이, 다이버전스와 볼륨 스프레드 분석 사이의 관계를 해석하는 방 법을 찾았습니다. 모멘텀으로 포지션이 채워지는 미니 공급 및 수요 영역이 있습니다. 이것이 우리가 그들이 시작할 때 있기를 원하는 곳입니다. 또한 그들은 Metatrader에서 실제 볼륨을 얻을 수 없다고 말합니다. 음, 가격 모멘텀으로 볼륨을 얻고 조작하는 방법을 찾았습니다. Jeslyn은 수년간의 연구를 기반으로 한 전략이며 특정 가격 행동 전략에 중점을 둡니다. 단순한 화
FxBears Super
Rachid Lafhil
Welcome to the world of advanced trading with the FxBears Super Trading Indicator. Designed exclusively for the MT4 platform, this innovative tool combines the power of Elliott Waves, supply and demand zones, and internal indicators to provide traders with high-quality signals for informed trading decisions. With a track record of over 90% success rate, FxBears Super brings a new level of precision and profitability to your trading strategy. Of Corse No Repaint and No Redraw . Elliott Wav
IRDeS 1 0
Jan Carlos Pagano
**IRDeS(거리 및 스파이크 감지 지표)**는 거의 완벽한 타이밍으로 시장에 진입할 수 있는 힘과 제로로부터의 거리를 나타내는 지표입니다. 이는 제로로부터의 거리 및 변동성을 감지하는 파란색 연속 선과, 제로를 넘는 빨간색 히스토그램 및 제로 아래의 녹색 히스토그램으로 구성되어 특정 양초에서 거래의 강도와 힘을 측정하며 차트의 특정 지점에서 강력한 추진, 즉 "스파이크"를 생성합니다. IRDeS는 기술적 분석에 유용한 혁신적이고 다재다능한 도구로, 현대 상황에 적합하게 두 지표를 하나로 통합하여 시장 진입 후의 움직임의 힘의 품질을 측정할 수 있습니다. IRDeS의 명백한 장점에도 불구하고 다른 지표들과 마찬가지로, 분석가는 신중하게 행동하고 특정 차트 영역에 중점을 두어 다른 영역을 피해야 합니다. 특히 트레이더들은 이 지표를 초과매수 또는 초과매도 조건을 찾는 수단으로 사용하려 할 수 있지만, 이것이 항상 작동하는 것은 아닙니다. IRDeS는 어떤 값이든 가질 수 있기 때문에
LiquidityHunger
Tomas Bystriansky
The indicator is based on the calculation of liquidity on the market and thus shows where the market can most likely turn.. It shows the places of liquidity where the price will reach sooner or later... The indicator can be set to several types of liquidity and therefore can display several levels on the graph.. It is a unique tool that can help you very well in your trading The indicator is suitable for currency pairs with the most liquidity (EURUSD/GBPUSD...)
Gann Made Easy
Oleg Rodin
4.96 (46)
Gann Made Easy 는 mr.의 이론을 사용하여 최고의 거래 원칙을 기반으로 하는 전문적이고 사용하기 쉬운 Forex 거래 시스템입니다. W.D. 간. 이 표시기는 Stop Loss 및 Take Profit Levels를 포함하여 정확한 BUY 및 SELL 신호를 제공합니다. PUSH 알림을 사용하여 이동 중에도 거래할 수 있습니다. 구매 후 연락주세요! 내 거래 팁과 훌륭한 보너스 지표를 무료로 공유하겠습니다! 아마도 Gann 거래 방법에 대해 이미 여러 번 들었을 것입니다. 일반적으로 Gann의 이론은 초보자 거래자뿐만 아니라 이미 거래 경험이 있는 사람들에게도 매우 복잡한 것입니다. Gann의 거래 방식은 이론적으로 적용하기 쉽지 않기 때문입니다. 나는 그 지식을 연마하고 Forex 지표에 최고의 원칙을 적용하기 위해 몇 년을 보냈습니다. 표시기는 적용하기가 매우 쉽습니다. 차트에 첨부하고 간단한 거래 권장 사항을 따르기만 하면 됩니다. 지표는 지속적으로 시장 분석 작업
Atomic Analyst
Issam Kassas
5 (1)
우선적으로 언급할 점은이 거래 지표가 다시 그리지 않고 지연되지 않으며 이를 통해 수동 및 로봇 거래 모두에 이상적이라는 점입니다. Atomic Analyst는 가격의 강도와 모멘텀을 활용하여 시장에서 더 나은 이점을 찾는 PA Price Action Indicator입니다. 고급 필터를 장착하여 잡음과 거짓 신호를 제거하고 거래 잠재력을 높이는 데 도움이 됩니다. 복잡한 지표의 다중 레이어를 사용하여 Atomic Analyst는 차트를 스캔하고 복잡한 수학적 계산을 간단한 신호와 색상으로 변환하여 초보 트레이더가 이해하고 일관된 거래 결정을 내릴 수 있도록합니다. "Atomic Analyst"는 새로운 및 경험이 풍부한 트레이더를위한 종합적인 거래 솔루션입니다. 프리미엄 지표와 최고 수준의 기능을 하나의 거래 전략에 결합하여 모든 종류의 트레이더에 대한 다재다능한 선택지가되었습니다. 인트라데이 거래 및 스캘핑 전략 : 빠르고 정확한 일일 거래 및 단기 거래를 위해 설계
Gold Stuff
Vasiliy Strukov
4.89 (250)
Gold Stuff는 금을 위해 특별히 설계된 추세 지표이며 모든 금융 상품에서도 사용할 수 있습니다. 표시기가 다시 그려지지 않고 지연되지 않습니다. 권장 기간 H1. 표시기에서 완전 자동 Expert Advisor EA Gold Stuff를 작동합니다. 내 프로필에서 찾을 수 있습니다. 설정 및 개인 보너스를 받으려면 구매 후 즉시 저에게 연락하십시오!   설정 화살표 그리기 - 켜기 끄기. 차트에 화살표 그리기. 경고 - 가청 경고를 끕니다. 이메일 알림 - 켜기 끄기. 이메일 알림. Puch-notification - 켜기 끄기. 푸시 알림. 다음으로 색 영역을 조정합니다. Gold Stuff는 금을 위해 특별히 설계된 추세 지표이며 모든 금융 상품에서도 사용할 수 있습니다. 표시기가 다시 그려지지 않고 지연되지 않습니다. 권장 기간 H1. 표시기에서 완전 자동 Expert Advisor EA Gold Stuff를 작동합니다. 내 프로필에서 찾을 수 있습니
Scalper Vault
Oleg Rodin
5 (27)
Scalper Vault 는 성공적인 스캘핑에 필요한 모든 것을 제공하는 전문 스캘핑 시스템입니다. 이 표시기는 외환 및 바이너리 옵션 거래자가 사용할 수 있는 완전한 거래 시스템입니다. 권장 시간 프레임은 M5입니다. 시스템은 추세 방향으로 정확한 화살표 신호를 제공합니다. 또한 상단 및 하단 신호와 Gann 시장 수준을 제공합니다.  이 시스템은 사용하기가 매우 쉽습니다. 원하는 시장 지역의 화살표만 따라가면 됩니다. 엑시트는 가격이 적정 수준에 도달하거나 시장의 고점 또는 저점 신호가 나타날 때 수행됩니다.  표시기는 PUSH 알림을 포함한 모든 유형의 경고를 제공합니다. 인디케이터 구매 후 연락주세요. 내 개인 거래 권장 사항과 훌륭한 보너스 지표를 무료로 공유합니다! 나는 당신에게 행복하고 유익한 거래를 기원합니다!
Advanced Currency Strength28 Indicator
Bernhard Schweigert
4.9 (663)
현재 26% 할인 초보자 또는 전문가 트레이더를 위한 최고의 솔루션! 이 지표는 우리가 독점 기능과 새로운 공식을 통합했기 때문에 독특하고 고품질이며 저렴한 거래 도구입니다. 단 하나의 차트로 28 Forex 쌍의 통화 강도를 읽을 수 있습니다! 새로운 추세 또는 스캘핑 기회의 정확한 트리거 포인트를 정확히 찾아낼 수 있기 때문에 거래가 어떻게 개선될지 상상해 보십시오. 사용 설명서: 여기를 클릭  https://www.mql5.com/en/blogs/post/697384 그것이 첫 번째, 원본입니다! 쓸모없는 지망생 클론을 사지 마십시오. 더 스페셜  강력한 통화 모멘텀을 보여주는 하위 창의 화살표 GAP가 거래를 안내합니다! 기본 또는 호가 통화가 과매도/과매도 영역(외부 시장 피보나치 수준)에 있을 때 개별 차트의 기본 창에 경고 표시가 나타납니다. 통화 강도가 외부 범위에서 떨어질 때 풀백/반전 경고. 교차 패턴의 특별 경고 추세를 빠르게 볼 수 있는
Trend Screener
STE S.S.COMPANY
4.83 (86)
트렌드 표시기, 트렌드 트레이딩 및 필터링을 위한 획기적인 고유 솔루션, 하나의 도구 안에 내장된 모든 중요한 트렌드 기능! Forex, 상품, 암호 화폐, 지수 및 주식과 같은 모든 기호/도구에 사용할 수 있는 100% 다시 칠하지 않는 다중 시간 프레임 및 다중 통화 표시기입니다. Trend Screener는 차트에 점이 있는 화살표 추세 신호를 제공하는 효율적인 지표 추세 추종 지표입니다. 추세 분석기 표시기에서 사용할 수 있는 기능: 1. 트렌드 스캐너. 2. 최대 이익 분석이 있는 추세선. 3. 추세 통화 강도 측정기. 4. 경고가 있는 추세 반전 점. 5. 경고가 있는 강력한 추세 점. 6. 추세 화살표 Trend Screener Indicator가 있는 일일 분석 예, 일일 신호 성능...등은 여기에서 찾을 수 있습니다.   여기를 클릭하십시오. LIMITED TIME OFFER : Trend Screener Indicator는 50 $ 및 평생 동안만 사용할 수 있
현재 20% 할인 ! 초보자 또는 전문가 트레이더를 위한 최고의 솔루션! 이 대시보드 소프트웨어는 28개의 통화 쌍에서 작동합니다. 2가지 주요 지표(Advanced Currency Strength 28 및 Advanced Currency Impulse)를 기반으로 합니다. 전체 Forex 시장에 대한 훌륭한 개요를 제공합니다. 고급 통화 강도 값, 통화 이동 속도 및 모든(9) 시간대의 28 Forex 쌍에 대한 신호를 보여줍니다. 추세 및/또는 스캘핑 기회를 정확히 파악하기 위해 차트의 단일 지표를 사용하여 전체 시장을 볼 수 있을 때 거래가 어떻게 개선될지 상상해 보십시오! 잠재적인 거래를 식별하고 확인하면서 강력한 통화와 약한 통화를 더욱 쉽게 식별할 수 있도록 이 지표에 기능을 내장했습니다. 이 표시기는 통화의 강세 또는 약세가 증가 또는 감소하는지 여부와 모든 시간대에서 수행되는 방식을 그래픽으로 보여줍니다. 추가된 새로운 기능은 현재 시장 조건 변화에 적
우선적으로, 이 거래 도구는 전문적인 거래에 이상적인 비-다시 그리기 및 지연되지 않는 지표입니다.  스마트 가격 액션 컨셉트 인디케이터는 신규 및 경험 많은 트레이더 모두에게 매우 강력한 도구입니다. Inner Circle Trader Analysis 및 Smart Money Concepts Trading Strategies와 같은 고급 거래 아이디어를 결합하여 20가지 이상의 유용한 지표를 하나로 결합합니다. 이 인디케이터는 스마트 머니 컨셉트에 중점을 두어 대형 기관의 거래 방식을 제공하고 이동을 예측하는 데 도움을 줍니다.  특히 유동성 분석에 뛰어나 기관이 어떻게 거래하는지 이해하는 데 도움을 줍니다. 시장 트렌드를 예측하고 가격 변동을 신중하게 분석하는 데 탁월합니다. 귀하의 거래를 기관 전략에 맞추어 시장의 동향에 대해 더 정확한 예측을 할 수 있습니다. 이 인디케이터는 시장 구조를 분석하고 중요한 주문 블록을 식별하고 다양한 패턴을 인식하는 데 뛰어납니다. 
TPSproTREND PrO
Roman Podpora
5 (15)
TPSpro TRENDPRO  - is a trend indicator that automatically analyzes the market and provides information about the trend and each of its changes, as well as giving signals for entering trades without redrawing! The indicator uses each candle, analyzing them separately. referring to different impulses - up or down impulse. Exact entry points into transactions for currencies, crypto, metals, stocks, indices!  -  Version MT5               DETAILED DESCRIPTION        /       TRADING SETUPS           
Scalper Inside PRO
Alexey Minkov
4.75 (55)
SALE NOW! Limited Time Offer! An exclusive indicator that utilizes an innovative algorithm to swiftly and accurately determine the market trend. The indicator automatically calculates opening, closing, and profit levels, providing detailed trading statistics. With these features, you can choose the most appropriate trading instrument for the current market conditions. Additionally, you can easily integrate your own arrow indicators into Scalper Inside Pro to quickly evaluate their statistics and
제작자의 제품 더 보기
IRDeS 1 0
Jan Carlos Pagano
**IRDeS(거리 및 스파이크 감지 지표)**는 거의 완벽한 타이밍으로 시장에 진입할 수 있는 힘과 제로로부터의 거리를 나타내는 지표입니다. 이는 제로로부터의 거리 및 변동성을 감지하는 파란색 연속 선과, 제로를 넘는 빨간색 히스토그램 및 제로 아래의 녹색 히스토그램으로 구성되어 특정 양초에서 거래의 강도와 힘을 측정하며 차트의 특정 지점에서 강력한 추진, 즉 "스파이크"를 생성합니다. IRDeS는 기술적 분석에 유용한 혁신적이고 다재다능한 도구로, 현대 상황에 적합하게 두 지표를 하나로 통합하여 시장 진입 후의 움직임의 힘의 품질을 측정할 수 있습니다. IRDeS의 명백한 장점에도 불구하고 다른 지표들과 마찬가지로, 분석가는 신중하게 행동하고 특정 차트 영역에 중점을 두어 다른 영역을 피해야 합니다. 특히 트레이더들은 이 지표를 초과매수 또는 초과매도 조건을 찾는 수단으로 사용하려 할 수 있지만, 이것이 항상 작동하는 것은 아닙니다. IRDeS는 어떤 값이든 가질 수 있기 때문에
필터:
리뷰 없음
리뷰 답변