• 미리보기
  • 리뷰
  • 코멘트

Reflection Surface

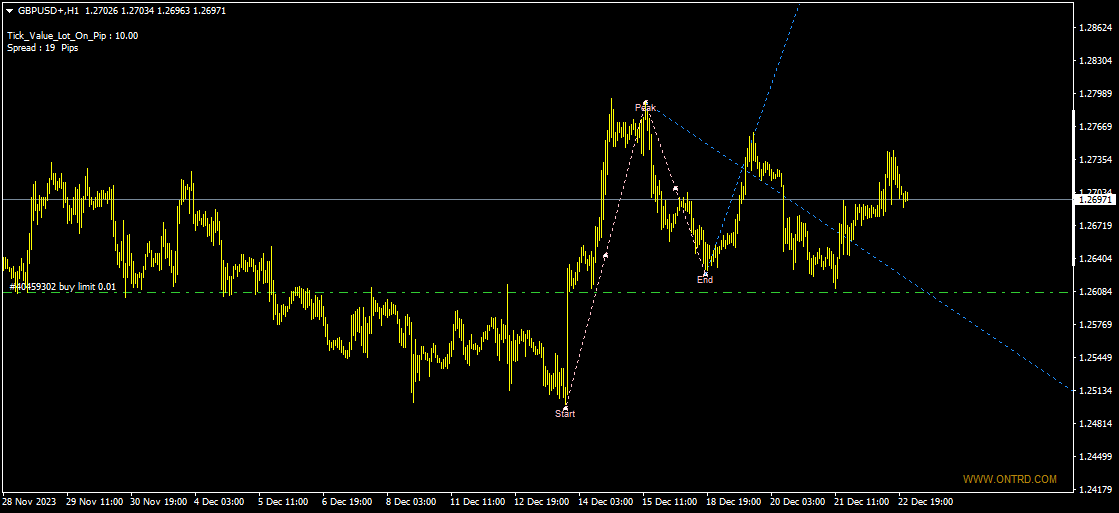
Introducing our innovative trading indicator, designed to transform the way you analyze price movements. The [Indicator Name] goes beyond traditional methods by dynamically drawing two distinct trends on the chart. The space between these trends acts as a unique reflection surface, providing valuable insights into potential market reversals and trend continuations.

Key Features:

  1. Dual Trend Drawing:

    • Automatically draws two trends on the chart, creating a visually distinctive analysis of price movements.
    • Provides a clear representation of the market's directional dynamics with two dynamically adjusted trends.
  2. Reflection Surface for Price:

    • Identifies the area between the two trends as a reflection surface for price movements.
    • Acts as a visual guide for traders, highlighting potential reversal and continuation zones based on the relationship between the trends.
  3. Price Reversal Indication:

    • Enhances market analysis by signaling potential price reversals when the price interacts with the reflection surface.
    • Offers traders valuable information for decision-making in response to changes in market sentiment.
  4. Trend Continuation Zones:

    • Pinpoints areas on the chart where the space between trends indicates a high likelihood of trend continuation.
    • Helps traders stay aligned with prevailing market trends, offering insights for strategic entry and exit points.
  5. Customization Options:

    • Provides users with the ability to customize the appearance of the trends and reflection surface.
    • Tailor the indicator to your individual preferences, ensuring a personalized and visually appealing chart setup.

How to Use:

  • Install the indicator on your MetaTrader platform and apply it to the desired charts.
  • Leverage the dual trends and the reflection surface to make informed trading decisions, whether anticipating reversals or identifying trend continuation opportunities.

Why Choose Our Indicator:

  • Visual Clarity: Stand out in the market with a visually distinctive representation of dual trends and their reflection surface.
  • Reflection-Based Insights: Gain unique insights into potential price reversals and trend continuations based on the interplay between the two trends.
  • Adaptable to Trading Strategies: Suited for a variety of trading strategies, providing a versatile tool for both trend-following and reversal-focused approaches.

Compatibility:

  • Compatible with both MetaTrader 4 and MetaTrader 5 platforms.

Elevate your trading analysis with the [Indicator Name]. Download now and discover the power of trend reflection surfaces in your market analysis!


추천 제품
Forex and binar pro
Dmitriy Konogorov
This indicator is great for trading on the pair  and many more. The indicator itself uses augmented accuracy mathematical strategies, but so far they are optimized for some currency pairs. Many settings can be configured on the working panel. There are two panels on the chart, for visualization and settings. He displays his solution on the graph in the form of icons. There are only two types of icons. In the tester, it works fine by default in the settings. The second panel for counting the res
Black series MT4
Dmitriy Kashevich
1 (1)
Black series MT4 - The indicator is designed for trading on binary options with Timeframe M1-M5-M15 Multicurrency (Works on cryptocurrency and currency pairs) The signal appears when the candle opens Up to 90% correct signals There is no signal redrawing at all Can be used with other indicators. Good for scalping! In Settings there is: -Indicator working methods -I Allert Arrow color Red signal down Blue signal up Also watch the video how the indicator works and signals
A top-quality from the famous XSuper Trend indicator. It is completely loyal to the original algorithm, and implements many useful features Which includes Trend Indicators as Filters like MACD,CCI and Alligator. The Chefs Super Trend Plus Indicator is a great way to identify the current market trend. The indicator shows a clear distinction between uptrends and downtrends. The indicators has optional filters for sound signal. Suitable for the following trending pairs: EUR/USD, GBP/USD, USD/JPY,
Oscillator helps determine the direction of the market Shows the direction of the price movement and is painted in the appropriate color. Allows you to conduct trend and counter trend trading It works on all timeframes, on any currency pairs, metals and cryptocurrency Can be used when working with binary options Distinctive features Does not redraw; Simple and clear settings; It works on all timeframes and on all symbols; Suitable for trading currencies, metals, options and cryptocurrency (Bitco
FREE
SFO Trend Racer
Tevin Marshall
5 (1)
SFO Trend Racer system is a trend indicator created by the CEO and Founder of " Simple Forex Options ", Tevin Marshall . It serves 6 different functions all in one. It shows the trader the entry signals as well as exit signals, whether it is a take profit or a stop loss. It also uses trend filters and signal confirmations so that the trader is able to make the most logically fit decision. Trend Racer uses various filters and specific settings from a plethora of indicators. The beauty in this ind
移動平均線クロス、ボリンジャーと移動平均線のクロス、移動平均線の角度でサイン表示 MT5インジケータ こちらに サイト とがあります。 このインジケータは3つのパターンでサインを表示(切り替え可能)します。 ①   移動平均線のクロス ②   ボリンジャーバンドと短期移動平均線とのクロス ③   ボリンジャーバンドと短期移動平均線とのクロスと、中期移動平均線と長期移動平均線の角度 移動平均線のクロス 指定した短期移動平均線と長期移動平均線のゴールデンクロスでは買いサイン、デットクロスでは売りサインを表示します。 ディフォルトでは短期は5,長期は20となっています。 もちろん変更可能になります。 移動平均線の種類をEMA(指数平滑移動平均線)やSMMA(平滑化移動平均)などに変更可能で適する価格も変更可能になります。 ボリンジャーバンドと短期移動平均線のクロス ボリンジャーバンド(以降BB)と短期移動平均線のクロスでサインを表示します。 ディフォルトではBB+1σと5MAのゴールデンクロスで買いサイン、BB-1σと5MAのデットクロスで売りサインでサインを表示します。 BBの期間や
Trend Transition is a hybrid indicator, as it is based on signals from several well-known products: RSI and MA. MA is a trend indicator of the average true range, which determines the range of minimum and maximum price fluctuations, as well as closing prices. RSI is an indicator of the family of oscillators. The indicator helps to calculate the oversold and overbought levels of a trading instrument. When a trend changes, the Trend Transition indicator uses a color alarm: blue - when changing
SMT Divergences MT4
Diego Arribas Lopez
5 (2)
MT5 Version SMT Divergences MT4 SMT Divergences is one of the most innovative indicators in the market. It offers the possibility of analyzing price divergences between 2 pairs. These divergences highlight and help to foresee what banks and institutions are planning to do. SMT divergences also provides you with a kill zones indicator and the possibility of filtering divergences occurring during these kill zones.  The strategy tester is limited in MT4. Contact the author to get your Demo Version
Infinity Trend Pro
Yaroslav Varankin
1 (1)
This is a trend indicator without redrawing Developed instead of the binary options strategy (by the color of the Martingale candlestick) Also works well in forex trading When to open trades (binary options) A signal will appear in the place with a candle signaling the current candle It is recommended to open a deal for one candle of the current timeframe M1 and M5 When a blue dot appears, open a deal up When a red dot appears, open a trade down. How to open trades on Forex. When a signal is rec
Cool volumes
Yerzhan Satov
화살표 표시기"쿨 볼륨"은 틱 볼륨을 기반으로합니다. 표시기 자체는 특정 기간(기간 선택)에 구매 또는 판매 할 볼륨 수를 추적합니다. 판매자 또는 구매자의 볼륨의 비정상적인 초과가있을 때,그것은 판매 또는 구매 신호를 제공합니다. 색상 히스토그램은 아래 창에 그려져 있는데,녹색은 현재 구매자의 우위를 나타냅니다.이는 이 가격 범위에서 증가할 수 있는 잠재적 즉각적인 반전을 의미합니다. 반대로 붉은 색은 판매자의 우위를 나타내며 이는 잠재적 인 즉각적인 하향 반전을 의미합니다. 또한 시각적 인식의 편의를 위해 주 차트 창에 화살표가 직접 추가되었습니다. 사용자의 편의를 위해 외부 변수에는 신호의 주파수와 히스토리(히스토리 바)에 대한 설정 변수가 포함되어 있습니다. 그러나 값을 1000 이상으로 설정하지 않는 것이 좋습니다. 이 더 터미널의 성능이 느려집니다. 또한"===<<화살표 설정>>>==="섹션에서 화살표 및 히스토그램 매개 변수를 직접 설정할 수 있습니다
간 스퀘어 지표는 W.D. 간이 쓴 "시장 예측을 위한 수학적 공식" 기사에 기반한 강력한 시장 분석 도구입니다. 이 도구는 수학적 개념과 간 이론을 사용하여 정확한 시장 분석을 수행합니다. 144, 90, 52의 제곱과 9의 제곱을 사용합니다. 또한 의 9의 제곱근 및 해당 제곱의 채널 및 스타 패턴과의 관련성을 통합합니다. 사용자 메뉴얼 및 적용: 이 지표를 사용하기 전에 사용자 메뉴얼을 읽고 질문이 있을 경우 문의하시기 바랍니다. 전체 메뉴얼은 웹사이트에서 제공됩니다. MT5의 전체 버전을 구매하거나 MT4의 무료 버전을 테스트할 수 있습니다. 두 버전 모두 링크에서 확인하실 수 있습니다. 주요 기능 및 기능: 간 스퀘어 지표는 정확한 결정을 위해 기하학적 개념과 간 이론을 활용하는 시장 분석을 위한 포괄적인 도구 집합을 제공합니다. 주요 기능은 다음과 같습니다. 9의 제곱 분석: 이 지표는 9의 제곱에 대한 수평 선, 스타 패턴, 그리드 및 간 팬을 그릴 수 있습니다. 간 이
This is an original, agile, and excellent trending system. Whether you are a beginner trading novice or a professional trader, this set of indicators can help you quickly and timely track the latest changes in market trends. It has the following characteristics: The method of use is extremely simple, plug and play, and the display of all trend analysis results is clear at a glance; There is no need to configure any functional parameters, the trend tracking indicator will automatically analyze th
This is  a dashboard indicator that displays the Average Level of each selected currency pairs that filters and gives us a signal for overbought (>=90%) or if price at extreme peak above 90, and/or oversold (<=10%) or if price at extreme peak below 10. The calculation is using Relative Strength Index default periods (2 & 9) applied to three different higher time frames H4,D1,&W1. This won't change or altered even if you change symbol or switch to lower time frames or even in monthly and y
Fibo RSI Channels
Igor Semyonov
4 (1)
Colored indicator of the linear channels based on the Fibonacci sequence for the RSI. It is used for making trading decisions and analyzing market sentiment. The channel/channels boundaries represent strong support/resistance levels, as they are the Fibonacci proportion levels. Users can select the number of displayed lines of channel boundaries on the chart by means of the input parameters. Various options for using the indicator are shown in the screenshots. The middle of the channel is shown
Sarangani Venom
Sherwin Dennis Tava Ruiz
sarangani venom is 100% profitable, easy to use indicator, a chart without indicator is stressful and will lead you to many losses, this indicator is pleasing to the eye that will gives you more confident to trade when there is signal, your computer will gives sound and the spider will animate, it can be used to all time frame and to all currency, you have many options, when the candlestick touches to upper line it is buy, when it touches to lower line it is sell, when the rope is pull to buy ar
Pyro Trend
Oleksii Ferbei
Pyro Trend is a new product that allows you to identify the current market phase (uptrend, downtrend or flat). The indicator is applicable for any data and periods. The middle of the trend wave, as well as the edges, are places of special heat and market behavior; when writing the indicator, an attempt was made to implement precisely finding the middle. Pyro Trend is a trend indicator that uses an original calculation algorithm. This indicator paints arrows in different colors depending on th
Colored indicator of the linear channel. Plotting and calculation is based on the Keltner method. It is used for making trading decisions and analyzing market sentiment. The input parameters provide the ability to adjust the channel on the chart. Attaching multiple instances of the indicator to the chart with different calculation periods leads to displaying a system of channels on the chart. Various options for plotting the channel are shown in the screenshots. Purpose The indicator can be us
Global Trend
Vitalii Zakharuk
Global Trend Indicator, shows the signals for entry. Displays both entry points and the trend itself. Shows statistically calculated moments for entering the market with arrows. When using the indicator, the risk factor can be optimally distributed. Settings: Uses all one parameter for settings. Choosing a parameter, it is necessary to visually resemble it so that the appropriate graph has a projection of extremes. Parameters: Length - the number of bars for calculating the indicator.
Spurts
Maryna Shulzhenko
The Spurts trend indicator is used to determine the strength and direction of a trend and to find price reversal points. The trend can be ascending (bullish) and decreasing (bearish). In most cases, the trend grows for a long time and falls sharply, but there are exceptions in everything. The price movement can be influenced by economic and political news. A trend is a stable direction of price movement. To find it, the indicator uses calculations designed to smooth out sharp fluctuations tha
Fibonacci CSM
Emir Revolledo
5 (1)
Fibonacci Currency Strength Meter (FCSM) Early Access Sale!! This new product is still in the process of adding new features and settings. For early bird buyers. The Price will be 50% Sale. In a few weeks, the product will be done. Go Grab your copy while it's still cheap. More details will be added soon. Things to be added. Alert Levels Mobile and Email Alert From it's name, Fibonacci Currency Strength Meter is a combination of Fibonacci levels and Currency Strength Meter. The plot of Fib
PABT Pattern Indicator - it's classical system one of the signal patterns. Indicator logic - the Hi & Lo of the bar is fully within the range of the preceding bar, look to trade them as pullback in trend. In the way if indicator found PABT pattern it's drawing two lines and arrow what showing trend way.  - First line - it's entry point and drawing at: 1. On the high of signal bar or on middle of the signal bar (depending from indicator mode) for buy; 2. On the low of signal bar or on middle of t
The HHHC-LLLC indicator uses candle by candle analysis, based on the principle of trend confirmation from Higher High, Higher Close candles (bullish) and Lower Low, Lower Close candles (bearish). There is no lag, no re-painting, and averaging is not used. HHHC-LLLC helps confirm: market structure and levels - look left to see them line up trends, pullbacks & reversals Bull moves (blue), Bear moves (red) Structure Zig Zags (black dotted lines), for summarizing market moves exhaustion and stalling
Orders History Simple
Asylbek Karashev
4 (2)
차트에서 주문의 시작점과 종료점을 시각적으로 볼 수 있는 간단하면서도 유용한 지표 이 표시기는 기호에 대한 현재 열린 주문 및 완료된 주문을 보여줍니다. 표시기 매개변수 Lines Buy color - 구매 주문에 대한 라인 색상을 지정합니다. Lines Sell color - 판매 주문에 대한 라인 색상을 지정합니다. Lines Width - 선 너비를 설정하고 솔리드 스타일 유형에 대해 작동합니다. Lines style - 선의 스타일을 설정합니다. Lines positive profit color - 양수 이익 텍스트의 색상을 설정합니다. Lines negative profit color - 음수 이익 텍스트의 색상을 설정합니다. Lines profit value font type - 이익 텍스트의 글꼴 유형을 설정합니다. 컴퓨터에 설치된 글꼴 유형 중 하나를 설정할 수 있습니다. Lines profit font size - 수익 텍스트의 글꼴 크기를 설정합니다.
FREE
Market Ticker
John Louis Fernando Diamante
The only Market Ticker on the market! Add a professional novelty to your workspace, with built in mini-charts A scrolling Market Ticker that displays price changes from all symbols in the Market Watch list. Provides an easy snapshot of symbol prices, and keeps scrolling automatically while you trade and analyse the chart. The ticker color (+/- price changes) are based on either the current or completed candle, and the previous candle. Options include: - MTF, eg choose to show price changes
Mini FFMV Dashboard and CSM
Opengates Success International
1 (1)
Mini Forex Market-View Dashboard and Mini-CSM Mini Full Forex Market View Dashboard is a miniature creation of FULL FOREX MARKET_VIEW Custom indicator created to give the Traders a full view of what is going on in the market but in a partial matter to make it conscise. It is useful most especially for those who don't like bogus indicators or those who have a PC with limited screen size. It uses a real time data to access the market and display every bit of information needed to make a successful
Trend Flasher
Amarnath K M
Trend Flasher Trend is your friend is the age old saying quote in trading arena, there are though many ways to gauge the trend and its direction, more scientific measure and logically meaningful will be an ATR break outs to identify and spot the trend and its acceleration, so we created this easy to use trend identification panel and optimized super trend based multi time frame panel entry system to aid and help the traders to make their trading decision. Unique Features of Trend Flasher 1
이 인디케이터는 엘리어트 파동 이론과 두 가지 방식으로 작동합니다: 자동 작동: 이 모드에서는 인디케이터가 엘리어트 파동 이론에 따라 차트 상의 모든 5개의 모티브 웨이브를 자동으로 감지하고 예측 및 잠재적인 반전 지역을 제공합니다. 또한 중요한 개발 사항을 트레이더에게 알릴 수 있는 경보 및 푸시 메시지를 생성할 수 있는 능력을 갖추고 있습니다. 이 자동 기능은 엘리어트 파동 패턴의 식별과 분석 프로세스를 간소화합니다. 수동 작동: 이 옵션은 엘리어트 파동 이론을 수동으로 다루고 싶은 트레이더를 위해 설계되었습니다. 이를 통해 사용자는 아홉 가지 다른 등급을 사용하여 웨이브를 그릴 수 있습니다. 각 등급은 나타난 후에 차트에 그려진 라인을 조정하여 개별적으로 정의할 수 있습니다. 이 기능은 웨이브를 수동으로 그리는 프로세스를 간소화하며 더 효율적으로 만들어 줍니다. 중요한 점으로 모든 그림 데이터가 미래 참조를 위해 플랫폼 데이터 폴더에 저장된다는 것을 기억해야 합니다. 파라미터:
Skynet Lasso
Roman Yablonskiy
This indicator displays entry and exit points in the market. The indicator is based on Parabolic and various mathematical and statistical methods to increase profitability and reduce the number of losing trades. The indicator helps in many cases to skip false inputs, the support and resistance lines go around the price in a certain mode, reducing losses. The dashboard shows the results of the indicator so that you can adjust it more accurately and see how the parameters affect the result. The
ToolBox 360 is the swiss knife of all indicators. It is full packed with useful tools to help you with your trading. It can be used to find best entry and exit points and help you to decide if you should open a trade or not. It shows market trends, candlestick formations outside / inside bars and you can sett time based allerts. Main features: Time based Fibonacci lines Choose a start and end time and the indicator shows you Fibonacci lines within the selected time range including range high
Auto Trend Lines
Semion Tremsin
Simply drop the indicator to the graph and support and resistance levels will be shown automatically! The indicator for automatic drawing of support and resistance levels based on THREE points. Identified points are marked on the chart Indicator shows break through price for both bullish and bearish trends (if found) You can specify on how many bars the indicator shall look in order to identify supporting points. In addition, you can select on which time frame the indicator will work. That means
이 제품의 구매자들이 또한 구매함
기적적인 외환 지표 소개: 정확한 트레이딩의 힘을 발휘하세요 모든 시간대에서 뛰어난 결과를 제공하는 최고의 외환 지표를 찾는데 지친 적이 있나요? 더 이상 찾을 필요가 없습니다! 기적적인 외환 지표가 도래하여 귀하의 트레이딩 경험을 혁신하고 수익을 새로운 고도로 끌어올립니다. 최첨단 기술과 수년간의 정성스런 개발을 토대로 기적적인 외환 지표는 외환 시장에서의 힘과 정확성의 정점으로 떠오릅니다. 이 탁월한 도구는 모든 수준의 트레이더의 요구를 충족시키고 지속적인 수익을 추구하는 데에서 비길 데 없는 우위를 제공하기 위해 설계되었습니다. 기적적인 외환 지표의 가장 큰 장점은 그 뛰어난 적응성에 있습니다. 당신이 데이 트레이더, 스윙 트레이더이든 장기 포지션을 선호하든, 이 지표는 모든 시간대에서 뛰어난 결과를 제공하기 위해 최적화되었습니다. 그러나 그 정확성과 시장의 복잡한 움직임을 포착하는 능력이 참으로 빛을 발하는 것은 1시간 기간대에서 사용할 때입니다. 기적적인 외환 지표의 정확성
TrendMaestro
Stefano Frisetti
5 (2)
note: this indicator is for METATRADER4, if you want the version for METATRADER5 this is the link: TRENDMAESTRO recognizes a new TREND in the bud, he never makes mistakes. The certainty of identifying a new TREND is priceless. DESCRIPTION TRENDMAESTRO identifies a new TREND in the bud, this indicator examines the volatility, volumes and momentum to identify the moment in which there is an explosion of one or more of these data and therefore the moment in which prices have strong probability of f
How to use Pair Trading Station Pair Trading Station is recommended for H1 time frame and you can use it for any currency pairs. To generate buy and sell signal, follow few steps below to apply Pair Trading Station to your MetaTrader terminal. When you load Pair Trading Station on your chart, Pair Trading station will assess available historical data in your MetaTrader platforms for each currency pair. On your chart, the amount of historical data available will be displayed for each currency pai
Indicator : RealValueIndicator Description : RealValueIndicator is a powerful tool designed specifically for trading on the EURUSD pair. This indicator analyzes all EUR and USD pairs, calculates their real currency strength values, and displays them as a single realistic value to give you a head start on price. This indicator will tell you moves before they happen if you use it right. RealValueIndicator allows you to get a quick and accurate overview of the EURUSD currency pair tops and bottoms,
PZ Day Trading
PZ TRADING SLU
3.67 (3)
This indicator detects price reversals in a zig-zag fashion, using only price action analysis and a donchian channel. It has been specifically designed for short-term trading, without repainting or backpainting at all. It is a fantastic tool for shrewd traders aiming to increase the timing of their operations. [ Installation Guide | Update Guide | Troubleshooting | FAQ | All Products ] Amazingly easy to trade It provides value on every timeframe It provides suitable SL and TP levels It impl
Please send me Direct message on MQL5 CHAT after purchasing the Indicator for Training and Installation Support There are some additional files that is important to use with the Indicator . So be sure to contact me after purchasing the Indicator So that I can add you for training and support . If you find any difficulty with installation then send me Direct message here So that I can connect with you via Anydesk or Teamview for the product installation. " Smart Order Block Indicator " to find
Gann Signal
Kirill Borovskii
Gann Signal is a very simple indicator at first glance, but hidden inside is many years of experience in studying W.D.Ganna methods. The indicator gives accurate BUY/SELL signals, without redrawing. The indicator is very easy to use. All you need to do is attach it to your chart and follow its recommendations. The indicator constantly analyzes the market for entry opportunities. When such an opportunity appears, the indicator gives a signal in the form of an arrow. I repeat, all signals are NOT
ON Trade Optuma Astro
Abdullah Alrai
5 (4)
물론입니다. 아래는 제공해주신 텍스트의 한국어 번역입니다: MT4용 천문학 지표 소개: 귀하의 최상급 하늘 트레이딩 동반자 트레이딩 경험을 천체의 높이로 끌어올리기 준비가 되셨나요? MT4용 천문학 지표를 소개합니다. 이 혁신적인 도구는 복잡한 알고리즘의 힘을 활용하여 탁월한 천문학적 통찰과 정밀한 계산을 제공합니다. 정보의 우주를 손에 담다: 천문학적 데이터의 보물함을 드러내는 포괄적인 패널을 살펴보세요. 행성의 지오/헬리오센트릭 좌표, 태양/지구 거리, 크기, 길이, 별자리, 황도 좌표 및 적도 좌표, 심지어 수평 좌표 등 각각이 정밀하게 계산되고 아름답게 제시됩니다. 지표에 의해 생성된 수직선은 시간 값에 해당하여 트레이딩 여정에 우주적인 시각을 부여합니다. 행성 라인과 관계: 수정 가능한 스케일과 각도로 차트를 장식하는 행성 라인의 마법을 경험해보세요. 직관적인 컨트롤 패널을 통해 각 행성의 라인의 가시성을 손쉽게 전환할 수 있습니다. 쥰션이나 섹스타일, 사분각, 삼분각, 트
Order Block Indicator MT4
Diego Arribas Lopez
5 (3)
[ MT5 Version ] Order Block Indicator MT4 Order Block Indicator MT4  is currently the most accurate and customizable indicator in the market. It has been developed to facilitate the analysis of operations based on Order Blocks and Supply and Demand Zones. These zones are possible reversal points of a movement. Order Blocks indicate a possible accumulation of orders in one area. The price usually gets to reach and react strongly to those areas. The most relevant levels for this reaction are the c
Candle Power Pro
Thushara Dissanayake
4.33 (6)
Candle Power Pro   표시기로 실제 볼륨 정보의 힘을 잠금 해제하십시오. 이 동적 도구는 각 양초의 실제 볼륨 데이터를 캡처하여 총 볼륨의 백분율로 표시합니다. 그렇게 함으로써 시장에서 구매자와 판매자 사이의 지속적인 투쟁을 식별할 수 있습니다. Candle Power Pro는 구매자와 판매자 간의 전투를 총 볼륨의 비율로 표시하여 시장 역학에 대한 귀중한 통찰력을 제공합니다. 구매자와 판매자의 거래량을 분석하여 브레이크아웃을 쉽게 확인할 수 있어 보다 정확한 진입점과 퇴장점을 확보할 수 있습니다. 또한 구매자와 판매자의 거래량을 활용하여 추세를 확인할 수 있으므로 거래 전략의 신뢰성을 높일 수 있습니다. 또한 매수자와 매도자 수의 변화를 분석하여 추세 반전을 식별할 수 있으므로 시장 변화를 한발 앞서 나갈 수 있습니다. 이 표시기는 거래 경험을 향상시키는 다양한 기능을 제공합니다. 쉽게 시각화할 수 있도록 볼륨 평균을 선으로 그리고 추가 분석을 위해 볼륨 백분율을 19
Market Breaker Updated version 3
Allistair Kabelo Mandow
1 (1)
Features for software Main functions: Accurate entry signals WITHOUT REPAINTING! Once a signal appears, it remains valid! This is a significant distinction from repainting indicators that might provide a signal and then alter it, potentially leading to deposit losses. Now, you can enter the market with higher probability and precision. There's also a function to colour candles after an arrow appears until the target (take profit) is reached or a reversal signal appears . Display of STOP LOSS
Weis Wave with Alert
Trade The Volume Waves Single Member P.C.
4.79 (19)
Rental/Lifetime Package Options and Privileges' * For optimum results the yearly or lifetime package is suggested due to live training and Discord  channel trading with the  creator! Rent Monthly Six Months   Yearly/Lifetime Weis Wave with Speed with Alert+Speed Index x x x Manual  x x x Quick Set up Video x x x Blog x x x Lifetime Updates x x x Setup and Training Material x x Free Rectangle Break Alert Tool      x Discord Access Channel "The SI traders" x 2-hour live methodology traini
MartingaleArrow
Abdulkarim Karazon
Martingale Arrow는 martingale 바이너리 옵션 거래를 위해 설계된 화살표 유형 mt4 표시기입니다. 이 화살표는 바 열기/인트라 바에 인쇄되고 경고를 제공합니다. 사용 방법: 화살표가 나타나는 순간 거래를 개시하세요. 거래가 성공했다면 다음 신호를 기다렸다가 동일한 로트를 거래하세요. 다음 신호에서 거래가 두 배의 로트를 잃고 신호가 승리할 때까지 계속 그렇게 하는 경우 재설정하고 첫 번째 거래 로트로 거래하세요. 권장 기간: 모두 최소 보증금 : 200 단위. 이 표시기 라이브는 다음을 수행하지 않습니다: 다시 칠하기/뒤로 칠하기 ------------------------------------- ------------- 매개변수: 표시 기간: 변경 시 다른 신호를 제공합니다. 지표 가격/유형 과매수/과매도 수준 경고 입력 화살표 스타일 ==========================================
System Trend Pro
Aleksandr Makarov
System Trend Pro - This is the best trend trading indicator!!! The indicator no repaint!!!   The indicator has   MTF   mode, which adds confidence to trading on the trend (   no repaint   ). How to trade? Everything is very simple, we wait for the first signal (big arrow), then wait for the second signal (small arrow) and enter the market in the direction of the arrow. (See screens 1 and 2.) Exit on the opposite signal or take 20-30 pips, close half of it, and keep the rest until the oppo
Full STO
Roman Smoroda
전체 STO 표시기 (프리미엄, 골드, 실버의 세 가지 STO 표시기의 모든 버전 포함)-안정적인 거래 옵션은 자동 바이너리 옵션 거래를 위해 설계되었습니다.  주의 깊게 읽기!!!!! 중요 하나의 터미널에서 만기가 다른 두 개의 템플릿, 즉 18:01, 18:02의 만기가 1 분에서 15 분인 템플릿과 10 분에서 20 분의 만기가 22:00 인 템플릿을 만듭니다. 승률: 지난 5년간 71% 자금 관리: 예치금에서 0.3 이 버전의 지표는 모스크바 시간 18:01, 18:02, 22:00 거래 전용으로 설정되며 실버 및 금의 경우 1에서 15까지, 프리미엄 버전의 경우 10에서 20 분까지 만료됩니다. 신호는 양초 내부에 나타나고 커넥터를 사용하면 양초 내부에 마크 개구부를 넣으면 즉시 거래를 시작합니다. 표시기가 완전히 구성되었으므로 직접 변경할 필요가 없습니다. 설치 및 거래 !!! 확인 및 테스트없이 지표를 구입하지 마십시오. 실제 계정에서
Connect Indicator
Sukunthakan Ngernbamrung
Connect Indicator is a tool used for connecting indicators between the MQL market and MT4. The connected indicators are made by our group and can be used for other applications, such as sending messages to the Line application or Telegram application. If you have any questions, please don't hesitate to ask us to receive support. Function and indicator buffer Buffer one is the high price of the previous candle. Buffer two is the high price of the previous candle. Usage To connect indicators to fu
Idea: RSI ( Relative Strength Index) and CCI ( Commodity Channel Index ) are powerfull to solved the market.  This indicator has Smoothed Algorithmic signal of RSI and CCI. So that, it separates the market into buy and sell zones, these areas are marked with arrows, red for downtrend, green for uptrend. This algorithm has the effect of predicting the next trend based on the historical trend, so users need to be cautious when the trend has gone many candles. Please visit screenshots
Chaos Indicator
Stefano Frisetti
DESCRIPTION The CHAOS INDICATOR has been developed to be used for the TRADING STRATEGY OF CHAOS, as described in the book. The book is in italian language only and can be obtained only on my website indicated below. DATAS COLLECTED AND SHOWN ON GRAPHS The CHAOS INDICATOR apply easily to any graph and any asset, and it is a TRADING FACILITATOR, as it identify immediately the following items on any graph: - The GP (= RIGHT PRICE) i.e. the price to which the asset should be attracted within 24
Gann Swing Structure
Kirill Borovskii
5 (1)
This indicator is based on the mathematics of the great trader W.D. Ganna. With its help, you can easily find strong levels by analyzing swings to find the optimal entry point. The indicator works on all instruments and all timeframes. The indicator is fully manual and has control buttons. All you need to do is press the NEW button, a segment will appear, which you can place on any movement, swing or even 1 candle that you want to analyze. By placing the segment, press the OK button. A grid (th
PZ Divergence Trading
PZ TRADING SLU
5 (3)
Tricky to find and scarce in frequency, divergences are one of the most reliable trading scenarios. This indicator finds and scans for regular and hidden divergences automatically using your favourite oscillator. [ Installation Guide | Update Guide | Troubleshooting | FAQ | All Products ] Easy to trade Finds regular and hidden divergences Supports many well known oscillators Implements trading signals based on breakouts Displays suitable stop-loss and take-profit levels Configurable oscill
PZ Swing Trading
PZ TRADING SLU
5 (4)
Swing Trading is the first indicator designed to detect swings in the direction of the trend and possible reversal swings. It uses the baseline swing trading approach, widely described in trading literature. The indicator studies several price and time vectors to track the aggregate trend direction and detects situations in which the market is oversold or overbought and ready to correct. [ Installation Guide | Update Guide | Troubleshooting | FAQ | All Products ] Profit for market swings with
A. A2SR이란 무엇입니까 ?   * 선행 기술 지표입니다(재도장 없음, 지연 없음). -- 안내 : https://www.mql5.com/en/blogs/post/734748/page4#comment_16532516 -- 및 https://www.mql5.com/en/users/yohana/blog A2SR에는 지원(수요) 및 저항(공급) 수준을 결정하는 특별한 기술이 있습니다. 우리가 인터넷에서 본 일반적인 방식과 달리 A2SR은 실제 SR 수준을 결정하는 독창적인 개념을 가지고 있습니다. 원래 기술은 인터넷에서 가져온 것이 아니며 인터넷에 게시된 적도 없습니다. A2SR은 거래 스타일에 따라 SR 수준을 자동으로 선택합니다. 시간 프레임을 변경해도 SR 레벨은 그대로 유지됩니다. 사용하는 시간 프레임에서 실제 SR을 얻지 못하기 때문입니다. A2SR은 거래를 위한 완전한 상품을 보유하고 있습니다 . 실제 지원(수요) 및 저항(공급)에 대한 진정한 개념. 뉴스 이벤트
The BB Reversal Arrows technical trading system has been developed to predict reverse points for making retail decisions. The current market situation is analyzed by the indicator and structured for several criteria: the expectation of reversal moments, potential turning points, purchase and sale signals. The indicator does not contain excess information, has a visual understandable interface, allowing traders to make reasonable decisions. All arrows appear to close the candle, without redr
Gold Channel XAUUSD
Paulo Rocha
5 (1)
Gold Channel is a volatility-based indicator, developed with a specific timing algorithm for the XAUUSD pair, which consists of finding possible corrections in the market. This indicator shows two outer lines, an inner line (retracement line) and an arrow sign, where the theory of the channel is to help identify overbought and oversold conditions in the market. The market price will generally fall between the boundaries of the channel. If prices touch or move outside the channel it is a tra
ECM Channel MT4
Paulo Rocha
5 (1)
ECM Elite Channel is a volatility-based indicator, developed with a specific time algorithm, which consists of finding possible corrections in the market. This indicator shows two outer lines, an inner line (retracement line) and an arrow sign, where the channel theory is to help identify overbought and oversold conditions in the market. The market price will generally fall between the boundaries of the channel. If prices touch or move outside the channel, it's a trading opportunity. The
Gann Zone Pro
Kirill Borovskii
This indicator identifies and displays zones, as it were areas of strength, where the price will unfold. The indicator can work on any chart, any instrument, at any timeframe. The indicator has two modes. The indicator is equipped with a control panel with buttons for convenience and split into two modes. Manual mode: To work with manual mode, you need to press the NEW button, a segment will appear. This segment is stretched over the movement and the LVL button is pressed. The level is displayed
Full Forex Market View Dashboard
Opengates Success International
5 (2)
전체 외환 시장 보기 대시보드 표시기 이것은 거래자에게 시장에서 일어나는 일에 대한 전체 보기를 제공하기 위해 만들어진 사용자 지정 지표입니다. 실시간 데이터를 사용하여 시장에 액세스하고 성공적인 거래에 필요한 모든 정보를 표시합니다. 설치: 이 지표를 창 차트에 첨부하기 전에 MT4의 Market Watch 패널로 이동하여 필요하지 않거나 거래하지 않는 모든 통화 쌍을 숨기고 나머지는 그대로 두십시오. 그 이유는 FFMV 대시보드가 MT4의 Market Watch에 나타나는 모든 통화 쌍을 표시하기 때문입니다. 최대 30개 이하의 통화 쌍을 표시할 수 있습니다. MT4의 Market Watch에서 그 이상이면 FFMV 대시보드의 글꼴과 이미지가 흐려지고 변형됩니다! 제대로 표시되지 않습니다. 용법:      솔로 트레이딩      바구니 거래의 경우(방법에 대한 스크린샷 참조)      다중 주문 거래에도 사용할 수 있습니다.      자신의 거래
Gann Price Level
Kirill Borovskii
The indicator is designed to work on any trading platform. The program is based on proprietary algorithms and W.D.Ganna's mathematics, allowing you to calculate target levels of price movement based on three points with the highest degree of certainty. It is a great tool for stock trading. The indicator has three buttons: NEW - call up a triangle for calculation. DEL - delete the selected triangle. DELS - completely remove all constructions. The probability of achieving the goals is more than 80
EZT Trend
Tibor Rituper
4 (1)
EZT 추세 표시기는 추세, 하락세 및 진입 기회를 보여줍니다. 선택적 필터링과 모든 유형의 경고를 사용할 수 있습니다. 이메일 및 푸시 알림 알림이 추가됩니다. 우리는 또한 이 지표를 기반으로 EA를 개발 중이며 곧 제공될 예정입니다. 두 개의 컬러 히스토그램과 하나의 선으로 구성된 다기능 표시기입니다. 이는 추세 방향과 강도를 시각적으로 표현한 것이며, 선이나 히스토그램에서 여러 번 차이를 발견할 수 있습니다. 표시기는 자동 매개변수 설정과 잘 작동합니다. 이는 주어진 기간에 대해 미리 결정되어 있으므로 해당 설정으로 표시기를 사용하는 것이 좋습니다. 수동 모드에서는 자신만의 매개변수를 설정할 수 있습니다. 이는 다중 시간대(mtf) 표시기입니다. 이 지표는 MTF rsi, MTF cci 또는 MACD pro와 같은 다른 지표의 조합과 잘 작동합니다. 거래되는 상품의 변동성이 클수록 최상의 항목을 찾는 데 사용해야 하는 기간이 더 짧아집니다. 항상 더 높은 기간
IA Trendx3 PRO
Marco Aurelio Santos Costa
What if God Created a Trade System? No miracles... Just see how mathematics can be effective in the market. We managed to combine technical analysis / price action into indicators, creating the best setup for trading, be it in Forex, Indices, or stocks. It took us 2 years to create something that really works, and now it's time for you to discover it. TrendX3 is a revolution in trend analysis. Based on advanced algorithms and real-time data, it provides valuable insights so that you can make inf
제작자의 제품 더 보기
ON Trade Gann Squares MT5
Abdullah Alrai
5 (1)
간 스퀘어 지표는 W.D. 간이 쓴 "시장 예측을 위한 수학적 공식" 기사에 기반한 강력한 시장 분석 도구입니다. 이 도구는 수학적 개념과 간 이론을 사용하여 정확한 시장 분석을 수행합니다. 144, 90, 52의 제곱과 9의 제곱을 사용합니다. 또한 의 9의 제곱근 및 해당 제곱의 채널 및 스타 패턴과의 관련성을 통합합니다. 사용자 메뉴얼 및 적용: 이 지표를 사용하기 전에 사용자 메뉴얼을 읽고 질문이 있을 경우 문의하시기 바랍니다. 전체 메뉴얼은 웹사이트에서 제공됩니다. MT5의 전체 버전을 구매하거나 MT4의 무료 버전을 테스트할 수 있습니다. 두 버전 모두 링크에서 확인하실 수 있습니다. 주요 기능 및 기능: 간 스퀘어 지표는 정확한 결정을 위해 기하학적 개념과 간 이론을 활용하는 시장 분석을 위한 포괄적인 도구 집합을 제공합니다. 주요 기능은 다음과 같습니다. 9의 제곱 분석:   이 지표는 9의 제곱에 대한 수평 선, 스타 패턴, 그리드 및 간 팬을 그릴 수 있습니다. 간
이 인디케이터는 엘리어트 파동 이론과 두 가지 방식으로 작동합니다: 자동 작동: 이 모드에서는 인디케이터가 엘리어트 파동 이론에 따라 차트 상의 모든 5개의 모티브 웨이브를 자동으로 감지하고 예측 및 잠재적인 반전 지역을 제공합니다. 또한 중요한 개발 사항을 트레이더에게 알릴 수 있는 경보 및 푸시 메시지를 생성할 수 있는 능력을 갖추고 있습니다. 이 자동 기능은 엘리어트 파동 패턴의 식별과 분석 프로세스를 간소화합니다. 수동 작동: 이 옵션은 엘리어트 파동 이론을 수동으로 다루고 싶은 트레이더를 위해 설계되었습니다. 이를 통해 사용자는 아홉 가지 다른 등급을 사용하여 웨이브를 그릴 수 있습니다. 각 등급은 나타난 후에 차트에 그려진 라인을 조정하여 개별적으로 정의할 수 있습니다. 이 기능은 웨이브를 수동으로 그리는 프로세스를 간소화하며 더 효율적으로 만들어 줍니다. 중요한 점으로 모든 그림 데이터가 미래 참조를 위해 플랫폼 데이터 폴더에 저장된다는 것을 기억해야 합니다. 파라미터:
Shepherd Harmonic Pattern
Abdullah Alrai
4.68 (59)
이 지표는 수동 및 자동 방법으로 차트에 그려진 고조파 패턴을 감지합니다. 사용자 매뉴얼은 다음 링크에서 확인할 수 있습니다. 리뷰를 작성하고 문의하면 무료 버전으로 MT4에서 제품을 시도할 수 있습니다. Gartley 및 Nenstar 패턴을 감지하는 데 사용할 수 있습니다. https://www.mql5.com/en/market/product/30181 전체 MT4 버전을 구입하려면 다음에서 구입할 수 있습니다. https://www.mql5.com/en/market/product/15212 참고 사항 지표에는 제어 패널이 있으며 모든 (차트 및 시간대) 설정을 저장합니다. 차트에서 더 많은 공간을 확보하려면 최소화할 수 있으며, 다른 분석 도구로 작업하는 것이 선호되는 경우 모든 지표 데이터를 숨기려면 닫기 버튼을 누를 수 있습니다. 이 지표를 사용하고 설정을 변경하면 이동 평균 또는 볼린저 밴드와 같은 지표를 추가하면 자동으로 템플릿을 저장하고 필요할 때 언제든지 로드할 수
ON Trade Optuma Astro
Abdullah Alrai
5 (4)
물론입니다. 아래는 제공해주신 텍스트의 한국어 번역입니다: MT4용 천문학 지표 소개: 귀하의 최상급 하늘 트레이딩 동반자 트레이딩 경험을 천체의 높이로 끌어올리기 준비가 되셨나요? MT4용 천문학 지표를 소개합니다. 이 혁신적인 도구는 복잡한 알고리즘의 힘을 활용하여 탁월한 천문학적 통찰과 정밀한 계산을 제공합니다. 정보의 우주를 손에 담다: 천문학적 데이터의 보물함을 드러내는 포괄적인 패널을 살펴보세요. 행성의 지오/헬리오센트릭 좌표, 태양/지구 거리, 크기, 길이, 별자리, 황도 좌표 및 적도 좌표, 심지어 수평 좌표 등 각각이 정밀하게 계산되고 아름답게 제시됩니다. 지표에 의해 생성된 수직선은 시간 값에 해당하여 트레이딩 여정에 우주적인 시각을 부여합니다. 행성 라인과 관계: 수정 가능한 스케일과 각도로 차트를 장식하는 행성 라인의 마법을 경험해보세요. 직관적인 컨트롤 패널을 통해 각 행성의 라인의 가시성을 손쉽게 전환할 수 있습니다. 쥰션이나 섹스타일, 사분각, 삼분각, 트
Shepherd Gann Squares MT5
Abdullah Alrai
5 (11)
이 지표는 W.D. Gann이 작성한 "시장 예측을 위한 수학 공식" 기사를 기반으로 하는 시장 분석 방법으로 9의 제곱과 144의 제곱 방법에 따라 다릅니다. 사용자 매뉴얼: Add Your review And contact us to get it 다음에서 전체 MT4 버전을 구입할 수 있습니다. https://www.mql5.com/en/market/product/15316 MT4에서 무료로 테스트할 수 있습니다. https://www.mql5.com/en/market/product/15320?source=Site +Profile+Seller#!tab=reviews 이 제품은 레벨/스타/그리드/간 팬/으로 9의 정사각형을 그릴 수 있습니다. Gann Squares: 52/90/144도 그릴 것입니다. Chart 에 이동 가능한 Free Gann Star 를 직접 그립니다 . 그것은 또한 Gann 다이아몬드를 그릴 것입니다.
ON Trade Numerology Mirror 인디케이터 소개: 숫자학을 통한 숨겨진 반전 패턴 해석 ON Trade Numerology Mirror 인디케이터로 기술적 분석의 새로운 차원을 체험하세요. 이 혁신적인 도구는 고대 숫자학의 지식을 활용하여 차트에서 중요한 가격 반전 수준을 식별합니다. 숫자를 반전된 위치로 재배치하여 이 인디케이터는 숫자의 상징적 의미를 활용하여 가능한 가격 반전을 예측하는 능력을 제공하며 거래 결정에 독특한 이점을 제공합니다. 주요 기능과 장점: 숫자학 활용: ON Trade Numerology Mirror 인디케이터는 신비로운 숫자학의 힘을 결합하여 숨겨진 가격 반전 패턴을 해석합니다. 숫자를 반전된 위치로 재배치함으로써 숫자의 상징적 의미를 활용하여 가능한 가격 반전을 예측합니다. 반전된 숫자 패턴: 이 인디케이터는 숫자열의 반전 개념을 적용하여 차트에 가격 반전 수준을 그립니다. 이러한 수준은 반전된 숫자 패턴에서 유래되며 시장 역학에 대한 독
Shepherd Harmonic Patterns Free
Abdullah Alrai
4.73 (26)
This indicator will detect harmonic patterns that are drawn on the chart by manual and automatic methods. You can see user manual from this link: https://www.mql5.com/en/blogs/post/719257 There is a free version (it detect only Gartley and Nenstar Patterns) to try this product. You can buy the full MT4 version from: https://www.mql5.com/en/market/product/104689 Notes When you use this indicator and change the settings, add indicators like Moving Average or Bollinger Bands, this indicator will
FREE
간 스퀘어 지표는 W.D. 간이 쓴 "시장 예측을 위한 수학적 공식" 기사에 기반한 강력한 시장 분석 도구입니다. 이 도구는 수학적 개념과 간 이론을 사용하여 정확한 시장 분석을 수행합니다. 144, 90, 52의 제곱과 9의 제곱을 사용합니다. 또한 의 9의 제곱근 및 해당 제곱의 채널 및 스타 패턴과의 관련성을 통합합니다. 사용자 메뉴얼 및 적용: 이 지표를 사용하기 전에 사용자 메뉴얼을 읽고 질문이 있을 경우 문의하시기 바랍니다. 전체 메뉴얼은 웹사이트에서 제공됩니다. MT5의 전체 버전을 구매하거나 MT4의 무료 버전을 테스트할 수 있습니다. 두 버전 모두 링크에서 확인하실 수 있습니다. 주요 기능 및 기능: 간 스퀘어 지표는 정확한 결정을 위해 기하학적 개념과 간 이론을 활용하는 시장 분석을 위한 포괄적인 도구 집합을 제공합니다. 주요 기능은 다음과 같습니다. 9의 제곱 분석: 이 지표는 9의 제곱에 대한 수평 선, 스타 패턴, 그리드 및 간 팬을 그릴 수 있습니다. 간 이
Shepherd Gann Squares Free
Abdullah Alrai
4.86 (37)
이 지표는 W.D. Gann이 작성한 "시장 예측을 위한 수학 공식" 기사를 기반으로 하는 시장 분석 방법으로 9의 제곱과 144의 제곱 방법에 따라 다릅니다. 사용자 매뉴얼: Add Your review And contact us to get it 다음에서 전체 MT5 버전을 구입할 수 있습니다. https://www.mql5.com/en/market/product/28669 MT4에서 무료로 테스트할 수 있습니다. https://www.mql5.com/en/market/product/15316 이 제품은 레벨/스타/그리드/간 팬/으로 9의 정사각형을 그릴 수 있습니다. Gann Squares: 52/90/144도 그릴 것입니다. Chart 에 이동 가능한 Free Gann Star 를 직접 그립니다 . 그것은 또한 Gann 다이아몬드를 그릴 것입니다. 그것은 당신이 당신의 항목에 대한 최고의 로트를 계산할 수 있도록 로트 계산기
FREE
Shepherd Numerology Levels 인디케이터를 활용하여 혁신적인 거래 방식을 탐색해보세요. 이 혁신적인 도구는 고대의 숫자학 지식을 현대적인 거래 기술과 결합하여 차트에서 중요한 지지와 저항 수준을 식별할 수 있도록 돕습니다. 9의 제곱법(Square of Nine)을 사용하여 이 인디케이터는 시장 역학에 대한 독특한 관점을 제공하며 더욱 정보를 풍부하게 제공하여 거래 결정을 내리게 합니다. 주요 기능 및 이점: 숫자학과 9의 제곱법: Shepherd Numerology Levels 인디케이터는 9의 제곱법을 활용하여 가격 움직임의 숨겨진 패턴을 해석합니다. 이 방법은 시장에서 가능한 추세 반전 지점과 역전을 예측하는 데 정확성이 높다고 알려져 있습니다. 정확한 지지와 저항 수준: Shepherd Numerology Levels를 사용하면 전통적인 분석을 통해 명확하지 않을 수 있는 정확한 지지와 저항 수준을 식별할 수 있습니다. 이러한 수준은 숫자학의 원리에서 유래되
ON Trade 마루보즈 카들 패턴 인디케이터 마루보즈 캔들 패턴은 시장 감정 및 잠재적인 트렌드 반전에 대한 유용한 통찰력을 제공할 수 있는 강력하고 직관적인 캔들 패턴입니다. 이 패턴은 한쪽 방향의 주요 트렌드를 따라 길게 뻗은 본체와 한쪽 끝에 매우 작거나 없는 그림자(물개)를 가진 캔들로 특징지어집니다. 이 패턴은 매수자와 매도자 간의 강력한 불균형을 나타내며, 시장의 움직임이 강력하게 한쪽으로 치우쳐져 있다는 것을 시사합니다. 특징 및 장점: 명확한 시장 감정: 마루보즈 캔들은 시장의 주요 감정을 명확하게 나타냅니다. 상승(흰색) 마루보즈는 개장가에서 종가까지 강력한 매수 압력을 나타내며, 하락(검정색) 마루보즈는 강력한 매도 압력을 나타냅니다. 트렌드 지속 또는 반전: 맥락에 따라 마루보즈 패턴은 트렌드 지속 또는 잠재적인 트렌드 반전을 나타낼 수 있습니다. 장기적인 트렌드 이후에 나타날 경우 해당 트렌드의 지속을 나타낼 수 있습니다. 반대로, 서포트나 레지스턴스 영역 근
FREE
Introducing the Pivot Point Selector Indicator: Your Ultimate Tool for Custom Pivot Levels Are you ready to take your trading to the next level? Say hello to the Pivot Point Selector Indicator, a game-changing tool that puts you in control of your pivot levels. This innovative indicator empowers you to choose three specific points that will determine the pivot level calculations, giving you unparalleled customization and precision in your trading strategy. Key Features and Benefits: Custom Pivo
FREE
Maravilla Square 지표 소개: 예측 거래를 위한 도우미 Maravilla Square 지표를 소개합니다. 이 독특한 도구는 가격 반전에 대한 통찰력을 제공하며, 고점과 저점 사이에서 조정할 수 있는 트렌드 라인을 제공합니다. 트렌드 라인의 역학: Maravilla Square 지표는 고점과 저점에 맞게 조정할 수 있는 트렌드 라인을 소개합니다. 이 동적인 기능은 지표와 가격 움직임 사이에 직접적인 연결을 만들어 거래 정확도를 향상시킵니다. 두 개의 컬러 라인: 두 개의 컬러 라인이 수축되는 것을 주목하세요. 이는 잠재적인 가격 반전의 독특한 신호입니다. 이 라인들이 수렴되면 독특한 패턴이 나타나며, 지표가 시장 반전 지점을 예측할 수 있게 됩니다. 정확성이 중요합니다: Maravilla Square 지표를 1 대 1의 고정된 종횡비로 사용하여 정확한 예측을 수행하세요. 이렇게 하면 정확한 결과를 얻을 수 있으며 거래 결정을 지원합니다. Maravilla Square 패턴
FREE
This indicator offers a comprehensive and efficient solution for traders seeking optimal entries in scalping strategies. Leveraging moving averages and stochastic indicators, it employs a systematic approach to identify favorable trade opportunities. The indicator goes beyond mere analysis, actively drawing clear and actionable entry points on your chart, denoted by arrows. Moreover, it provides the convenience of alerts to ensure you never miss these potential setups. Key Features and Benefits:
FREE
이 인디케이터는 거래 차트에 돈치안 채널을 시각적으로 표시하는 목적으로 사용됩니다. 돈치안 채널은 특정 기간 동안의 최고점과 최저점 사이의 범위를 나타내는 간단한 기술 도구입니다. 이 인디케이터는 가격 움직임의 시각적 분석을 향상시키며 잠재적인 돌파 지점 및 추세 지속 포인트에 대한 통찰력을 제공합니다. 돈치안 채널은 현재 시간 프레임과 더 높은 시간 프레임 모두에 적용할 수 있으며 이 옵션을 활성화할 수 있습니다. 인디케이터 주요 기능: Use_System_Visuals: 이 매개변수를 활성화하면 시스템의 시각적 스타일 사용 또는 인디케이터의 외관을 사용자 정의할 수 있습니다. 활성화되면 인디케이터의 시각적 요소가 거래 플랫폼의 전반적인 테마에 일치하도록 조정됩니다. Signal_from_HT_Timeframe: 이 옵션을 활성화하면 더 높은 시간 프레임에서 신호를 수신할 수 있습니다. 다시 말해 더 긴 시간 프레임에서의 돈치안 채널 동작을 고려하여 현재 시간 프레임에서의 거래 결
FREE
골드 그램 가격 계산기 인디케이터 소개 지역 통화에서의 금 가격을 항상 확인하고 싶으신가요? 더 이상 찾을 필요가 없습니다. 골드 그램 가격 계산기 인디케이터는 선호하는 지역 통화에서 그램 당 금 가격을 실시간으로 계산할 수 있는 혁신적인 도구를 제공합니다. 이 인디케이터를 통해 금융적인 통찰력을 활용하여 정보에 기반한 결정을 내릴 수 있습니다. 주요 특징: 지역화된 금 가격: 골드 그램 가격 계산기 인디케이터는 그램 당 금속 가격을 제공합니다. 구체적으로 그램 당 금 가격을 지역 통화에 맞게 조정한 것입니다. 이를 통해 익숙한 통화로 금 가치를 편리하게 추적할 수 있습니다. 사용자 친화적 설정: 우리의 인디케이터는 편의성을 고려하여 디자인되었습니다. 인디케이터 설정에서 직접 조정하거나 주요 차트에서 조정할 수 있어, 원활하고 맞춤화된 경험을 제공합니다. 매개변수 설명: Use_System_Theme (시스템 테마 사용): 선호하는 색상 스킴을 선택할 수 있는 옵션으로, 인디케이터의
FREE
ON Trade Pivots
Abdullah Alrai
ON Trade Pivots is A technical indicator that Draws all Pivot levels depending on time frame that defined in settings. Notes It will be good tool for all traders who use pivot levels in their trades. Let me inform you that this indicator draw this level as buffers not as objects then you can connect it easily to EA. This indicator allow you to find pivots levels for any time frame not only daily you are free to choose time frame from settings. Parameters Use_System_Visuals - Enable /Disable
FREE
ON Trade Angler
Abdullah Alrai
"이 지표는 간단한 트렌드 검출 도구입니다. 스캘핑 모드와 같은 전략과 함께 사용하여 좋은 진입점을 얻을 수 있습니다. 가격 주변에 채널을 그릴 것이며, 시간이 경과함에 따라 확장됩니다. 사용자 정의 기간에는 시간과 가격을 함께 고려하는 알고리즘에 따라 확장의 시작 지점으로 돌아갈 것입니다. 반전의 표시가 나타난 후 채널의 하한에서 매수할 수 있습니다. 그리고 반전의 표시를 본 후 채널의 상한에서 판매할 수 있습니다. 매개변수: 시스템 테마 사용: 여기서 테마를 선택할 수 있습니다. 계산 유형: 다음 세 가지 옵션 중에서 선택할 수 있습니다: 1- 원본 계산: 이 영역은 그 날의 트렌드를 정의하며, 이 영역 위에 열거나 아래에 열리면 됩니다. 2- 새로운 계산: 트렌드를 감지하는 데 의존할 채널을 그릴 것입니다. 3- Sheph: 새로운 계산 방법과 호환되지 않는 기호에 그려지는 수정된 채널입니다." 더 궁금한 사항이나 추가 지원이 필요하시면 언제든지 물어보세요!
Rsi Channel
Abdullah Alrai
5 (1)
This indicator displays the channel of Relative Strength Index. When you see that the price touches the red line and retreats from it many times, then you will know that the general trend is down. When it retreats from the blue line many times, that means that the general trend is up. This lines express the RSI values attributed to the price values on the main chart. You can add this indicator to your strategy, it will help you. This indicator will work best on 5 minutes and higher time frames.
이 인디케이터는 "회귀 채널 도구" 개념을 기반으로 한 강력한 시장 분석 방법을 제공합니다. 이 도구를 활용하여 트레이더는 차트의 회귀 채널을 탁월하게 제어하고 보다 근거 있는 거래 결정을 할 수 있습니다. 회귀 채널 도구는 트레이더 도구 상자 내에서 강력한 도구입니다. 가격 트렌드와 잠재적인 지지 및 저항 수준에 대한 유용한 통찰력을 제공하는 것을 목표로합니다. 이 도구는 특히 트렌드 내의 수정 웨이브를 시각화하는 데 효과적이며 가격 역학의 포괄적인 전망을 제공합니다. 이제 이 인디케이터의 주요 기능과 이점에 대해 더 자세히 살펴보겠습니다: 채널 수준 및 지지/저항: 이 인디케이터의 주요 장점 중 하나는 동적인 지지 및 저항 영역으로 작동하는 채널 수준을 생성할 수 있는 능력입니다. 이러한 수준은 잠재적인 진입 및 이탈 포인트를 식별하는 데 중요하며 거래 전략의 정밀도를 향상시킵니다. 수정 웨이브 수준: 수정 웨이브 수준을 활성화하여 트레이더는 큰 트렌드 내에서 잠재적인 수정을
"우리는 트레이딩 전략을 향상시키고 시장 트렌드에 대한 정확한 통찰력을 제공하기 위해 개발된 강력한 외환 인디케이터를 소개합니다. 이 혁신적인 도구는 세밀한 촛대 측정을 분석하고 최적의 정확도를 얻기 위해 조정을 수행하는 정교한 사용자 정의 알고리즘을 사용합니다. 결과는 차트에 정밀하게 배치된 화살표 세트로 전략적인 진입 지점을 표시합니다. 이 인디케이터의 창의력은 촛대 패턴의 힘을 활용하고 정밀하게 교정된 조정과 결합하는 능력에 있습니다. 이를 통해 시장 움직임에 대한 독특한 시각을 제공하며 거래 결정에 우위를 제공합니다. 이 인디케이터의 특출한 특징 중 하나는 H1 시간 프레임에서의 뛰어난 성능입니다. 이 시간 프레임에 특화된 트레이더들은 많은 정밀한 진입 기회를 제공한다는 것을 발견할 것입니다. 그러나 우리는 시너지의 힘을 믿습니다. 이 인디케이터 자체로도 강력한 도구이지만, 보다 포괄적인 트레이딩 전략에 통합될 때 그 성능은 더욱 높아집니다. 기존의 접근 방식과 결합함으로써
Shepherd Gann Squares
Abdullah Alrai
4.9 (10)
이 지표는 W.D. Gann이 작성한 "시장 예측을 위한 수학 공식" 기사를 기반으로 하는 시장 분석 방법으로 9의 제곱과 144의 제곱 방법에 따라 다릅니다. 사용자 매뉴얼: Add Your review And contact us to get it 다음에서 전체 MT5 버전을 구입할 수 있습니다. https://www.mql5.com/en/market/product/28669 MT4에서 무료로 테스트할 수 있습니다. https://www.mql5.com/en/market/product/15320?source=Site +Profile+Seller#!tab=reviews 이 제품은 레벨/스타/그리드/간 팬/으로 9의 정사각형을 그릴 수 있습니다. Gann Squares: 52/90/144도 그릴 것입니다. Chart 에 이동 가능한 Free Gann Star 를 직접 그립니다 . 그것은 또한 Gann 다이아몬드를 그릴 것입니다.
이 지표는 간 이론에서 파생된 특정한 다이아몬드 간 웨이브 패턴을 검출하고 시각화하는데 사용됩니다. 이 패턴의 ABC 포인트를 기반으로 포인트(P)를 그려 시장의 잠재적 반전에 대한 트레이더의 통찰력을 제공합니다. 더불어, 이 지표는 예측된 포인트(P)로부터 수직선을 그려 시장의 잠재적 반전 포인트를 더 쉽게 식별할 수 있도록 돕습니다. 지표 기능: Use_System_Visuals: 이 매개변수를 활성화하면 시스템의 시각적 테마를 지표의 외관에 사용하거나 사용하지 않을 수 있습니다. 이 옵션을 활성화하면 지표의 시각적 요소는 거래 플랫폼의 전체 테마와 일관성을 유지합니다. Show_Last_Candle_Counter: 이 옵션을 활성화하면 현재 양초가 종료될 때까지 남은 시간을 나타내는 카운터가 표시됩니다. 이 타이머는 특정 양초 패턴이나 시간 간격에 의존하는 트레이더에게 유용할 수 있습니다. Candle_Counter_Color: 트레이더는 양초 카운터 텍스트의 색상을 사용자 정
"이 인디케이터는 바이스트라 패턴 이론을 기반으로 한 입장을 감지하고 목표 및 중지 레벨을 갖춘 한정 주문을 놓을 수 있는 입장 가치를 제공합니다. 이를 통해 리스크 비율을 계산할 수 있습니다. 참고: 이 인디케이터에는 EA에서 사용할 수 있는 버퍼가 있습니다. 이 제품을 사용하는 동안 좋은 자금 관리를 실천하는 것이 중요합니다. 시간 프레임을 변경할 때, 인디케이터는 마지막 세션에서 사용한 템플릿을 저장합니다. 이 방법을 배우려면 구매 후 저희에게 연락하고 리뷰를 추가해주시기 바랍니다. 매개변수: 시스템 비주얼 사용 - 이 제품의 비주얼 테마를 활성화/비활성화합니다. 속도 관련 - 마지막 웨이브의 빠른 움직임 중에만 패턴을 감지하도록 활성화/비활성화합니다. 마지막 양식 카운터 표시 - 양식 타이머를 활성화/비활성화합니다. 양식 카운터 색상 - 양식 타이머 텍스트의 색상입니다. 상승 패턴 색상 - 상승 패턴의 색상입니다. 하락 패턴 색상 - 하락 패턴의 색상입니다. 알림 보내기 -
"Fibo Star" 지표는 별 모양으로 피보나치 팬을 차트에 표시하는 데 사용됩니다. 이 피보나치 팬은 가격 움직임을 분석하는 강력한 도구로, 잠재적인 지지 및 저항 레벨에 대한 통찰력을 제공할 수 있습니다. 이 지표는 그리기 및 설정 과정을 간편화하기 위한 사용자 친화적인 제어판을 제공하여 시간과 노력을 절약할 수 있도록 돕습니다. 사용 방법: 이 지표는 수동 사용을 위한 것입니다. 효과적으로 사용하려면 다음 단계를 따르세요: 피보나치 팬을 기반으로 할 고점과 저점을 차트에서 식별합니다. 이러한 고점과 저점에 보라색 선을 그립니다. 가격이 이러한 선과 상호 작용하면, 이 지표가 동적인 지지 및 저항 레벨로 작동하는 것을 관찰하세요. 매개변수: Use_System_Theme: 이 매개변수를 사용하여 지표의 외관을 거래 플랫폼의 전반적인 테마에 맞출지 또는 사용자 정의할지 선택할 수 있습니다. Levels_Color: 피보나치 팬의 레벨에 적용할 색상을 선택합니다. Levels_S
"통화 강도 인디케이터"는 외환 시장에서 서로 다른 통화의 상대적인 강도에 관한 정보를 제공하기 위해 개발된 강력한 도구입니다. 각 통화의 강도를 해당 시간 프레임을 기반으로 계산하고 표시함으로써 이 인디케이터는 특히 유의미한 발산이나 교차가 관찰될 때 잠재적인 거래 기회를 식별하는 기회를 제공합니다. 인디케이터의 주요 특징: 1. 통화 강도 계산: 이 인디케이터는 각 통화의 강도를 해당 시간 프레임을 기반으로 계산합니다. 이 계산에는 지정된 기간 동안 한 통화가 다른 통화들의 바구니에 대한 성과를 평가하는 과정이 포함됩니다. 이를 통해 트레이더는 각 통화의 상대적인 강도 또는 약함을 이해할 수 있습니다. 2. 수축과 발산: 두 통화의 강도 간에 수축 또는 발산 움직임이 있는 경우, 이는 잠재적인 거래 기회를 나타낼 수 있습니다. 예를 들어 한 통화가 상대적으로 강화되는 동안 다른 통화가 약화되는 경우, 가능한 진입 지점을 나타낼 수 있습니다. 3. 제로 레벨 교차: 이 인디케이터는
이 인디케이터는 수동 및 자동 방법으로 차트에 그려진 조화 패턴을 감지합니다. 사용 후기를 추가하십시오. 참고 사항: 이 인디케이터에는 제어 패널이 있으며 모든 (차트 및 시간대) 설정을 저장합니다. 더 많은 공간을 확보하려면 최소화할 수 있으며 다른 분석 도구와 함께 작업하려면 모든 인디케이터 데이터를 숨기려면 닫기 버튼을 누를 수 있습니다. 이 인디케이터를 사용하고 설정을 변경하면 이동평균이나 볼린저 밴드와 같은 인디케이터를 추가할 때 편집 내용의 템플릿을 자동으로 저장하고 필요할 때 언제든지 로드할 수 있습니다. Windows 10을 사용하는 경우 MetaTrader 아이콘을 마우스 오른쪽 단추로 클릭한 다음 호환성 > 고DPI 설정 변경 > 시스템(개선)을 선택하여 최상의 화면 설정을 사용할 수 있습니다(HD 기기에서 수행되어야 함). 이 인디케이터는 본질적으로 차트에서 조화 거래 이론을 해석하는 것으로 조화 패턴을 감지합니다. 배우고 싶다면 Scott Carney의 "Har
Hikkake 일본 캔들 패턴 인디케이터는 차트에 형성되는 모든 Hikkake 가격 액션 패턴을 식별하고 감지하기 위해 특별히 설계된 전문 도구입니다. 이 패턴은 내부 바에서의 가짜 돌파 개념을 기반으로 합니다. 이 인디케이터는 차트의 마지막 다섯 개의 캔들을 분석하여 Hikkake 패턴의 특성이 충족되는지 여부를 결정합니다. 이 패턴이 확인되면 해당 패턴을 구성하는 캔들 주위에 사각형을 그려 트레이더가 패턴을 더 쉽게 식별하고 해석할 수 있도록 돕습니다. 인디케이터의 주요 기능: 패턴 감지: Hikkake 인디케이터는 특히 Hikkake 가격 액션 패턴을 감지하고 강조하는 데 특화되어 있습니다. 이러한 패턴은 내부 바 형성에서 가짜 돌파 개념을 중심으로 합니다. 마지막 다섯 개 캔들의 확인: Hikkake 패턴의 존재를 확인하기 위해 인디케이터는 차트의 마지막 다섯 개의 캔들을 연구합니다. 이 캔들의 배열과 관계를 평가하여 패턴의 기준을 충족하는지 여부를 판단합니다. 사각형 시각화
강력한 가격 행동 패턴을 감지하는 기술적 지표: 핀바, 인사이드 바, 아웃사이드 바 소개: 기술적 분석 분야에서 가격 행동 패턴은 잠재적인 시장 움직임의 중요한 지표로 기능합니다. 우리는 차트상의 견고한 가격 행동 패턴을 식별하는 데 도움을 주는 정교한 기술적 지표를 개발했습니다. 우리의 지표는 핀바, 인사이드 바, 아웃사이드 바라는 세 가지 중요한 패턴을 감지하는 데 특화되어 있습니다. 주요 감지 패턴: 핀바: 핀바 패턴은 시장 트렌드의 잠재적인 반전을 나타내는 단일 양초 형성입니다. 작은 몸체와 몸체 위나 아래로 튀어나온 긴 꼬리 또는 "위크"로 특징지어집니다. 상승 핀바는 가능한 상승 반전을 시사하며, 하락 핀바는 하락 반전을 시사합니다. 인사이드 바: 인사이드 바 패턴은 단일 양초의 전체 가격 범위가 이전 양초의 가격 범위 내에 들어가는 경우 발생합니다. 이 패턴은 임시적인 증시 합리화나 불확실성을 나타내며 종종 양방향으로의 돌파를 앞서는 신호로 작용합니다. 아웃사이드 바:
메타트레이더용 숫자로 이루어진 지지와 저항 인디케이터 소개: 메타트레이더용 숫자로 이루어진 지지와 저항 인디케이터로 기술적 분석의 새로운 차원을 경험해보세요. 이 독특한 도구는 숫자학의 힘을 활용하여 차트 상에서 주요 지지와 저항 레벨을 식별하여 가능한 가격 움직임에 대한 가치 있는 통찰력을 제공합니다. 주요 개념: 트레이딩에서의 숫자학: 숫자학은 숫자와 그들의 의미를 미스틱하게 연구하는 것으로, 트레이딩에 숫자학 원리를 적용하면 특정한 의미를 가진 숫자를 식별하고 이를 사용하여 매수 또는 매도 활동이 발생할 가능성이 있는 가격 레벨을 예측하는 것을 의미합니다. 인디케이터 기능: 우리의 인디케이터는 숫자학의 숨겨진 패턴을 활용하여 차트 상에 지지와 저항 레벨을 그립니다. 이러한 레벨은 금융 시장에서 중요한 의미를 가진 주요 숫자학 숫자에서 파생됩니다. 학습을 위한 선호되는 단계: 숫자학 이해: 인디케이터를 사용하기 전에 숫자학의 기본 개념과 트레이딩에서의 중요성을 이해하는 시간을 가
필터:
리뷰 없음
리뷰 답변