Session Range Highlight 4 Price Action SMC
- 지표
- Pham Tien Thanh
- 버전: 1.2
- 업데이트됨: 3 1월 2024
- 활성화: 5
🌟 세션 레인지 하이라이트 인디케이터 소개 🌟
세션 레인지 하이라이트 인디케이터로 외환 거래의 정밀한 힘을 발휘하세요. 이 도구는 거래 경험을 간편하게 만들기 위해 디자인되었으며, 세션의 고점과 저점을 쉽게 식별하는 데 도움이 되는 열쇠입니다.
주요 특징:
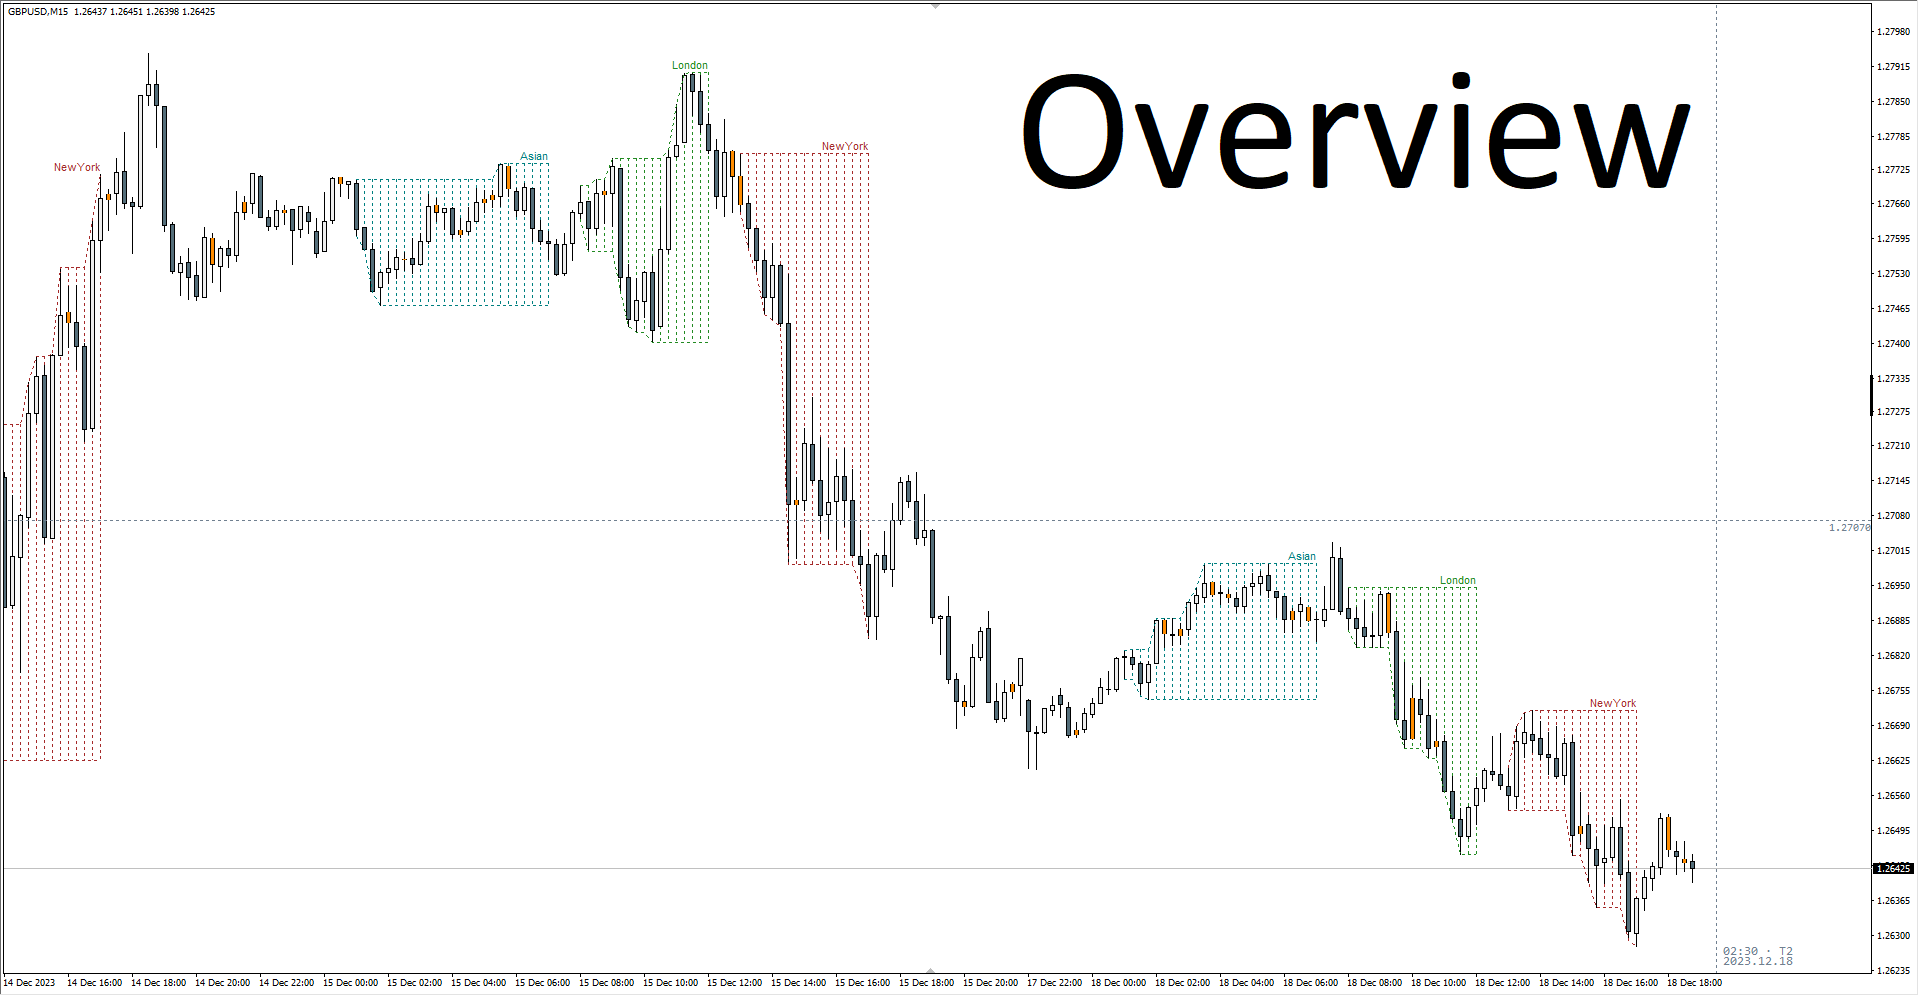
📊 명확한 세션 시각화:
- 차트에서 세션 범위를 쉽게 식별하고 시각화합니다.
- 특정 시장 세션 동안 중요한 가격 수준을 정확하게 파악하여 거래 전략을 강화하세요.
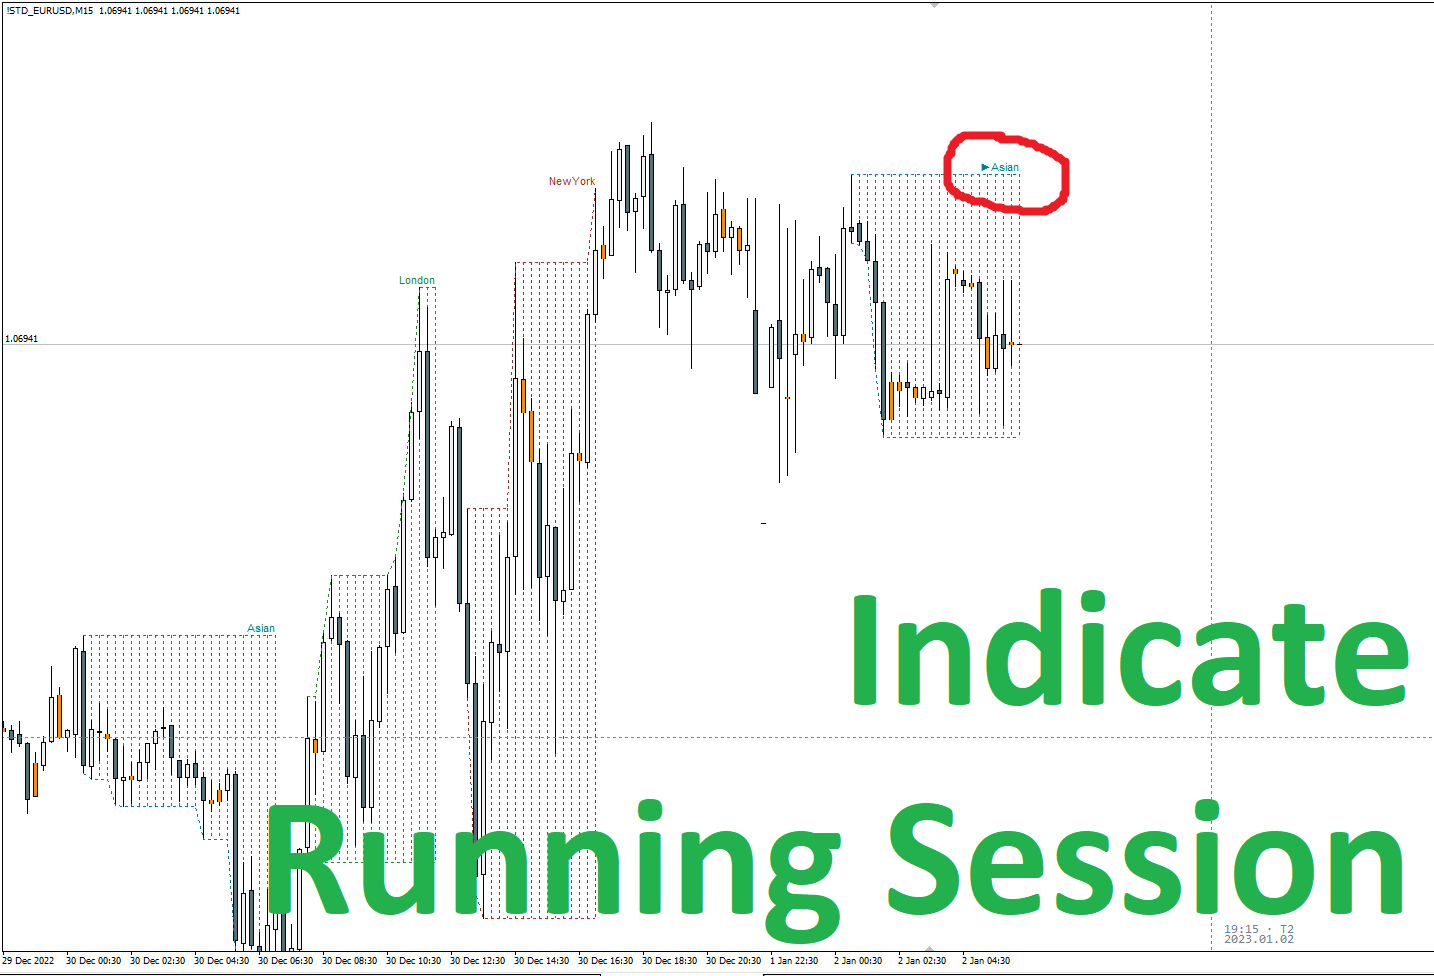
🎨 간단하면서 우아한 디자인:
- 간단한 아름다움 - 저희의 인디케이터는 세련되고 사용자 친화적인 디자인을 자랑합니다.
- 기능성을 희생하지 않고 세션 범위를 시각적으로 매력적으로 표현합니다.
📈 쉽게 세션 극점 식별:
- 각 거래 세션 내에서 가장 높은 가격과 가장 낮은 가격을 즉각적으로 인식하세요.
- 강조된 세션 범위를 빠르게 살펴보면 정보를 기반으로 한 거래 결정을 내릴 수 있습니다.
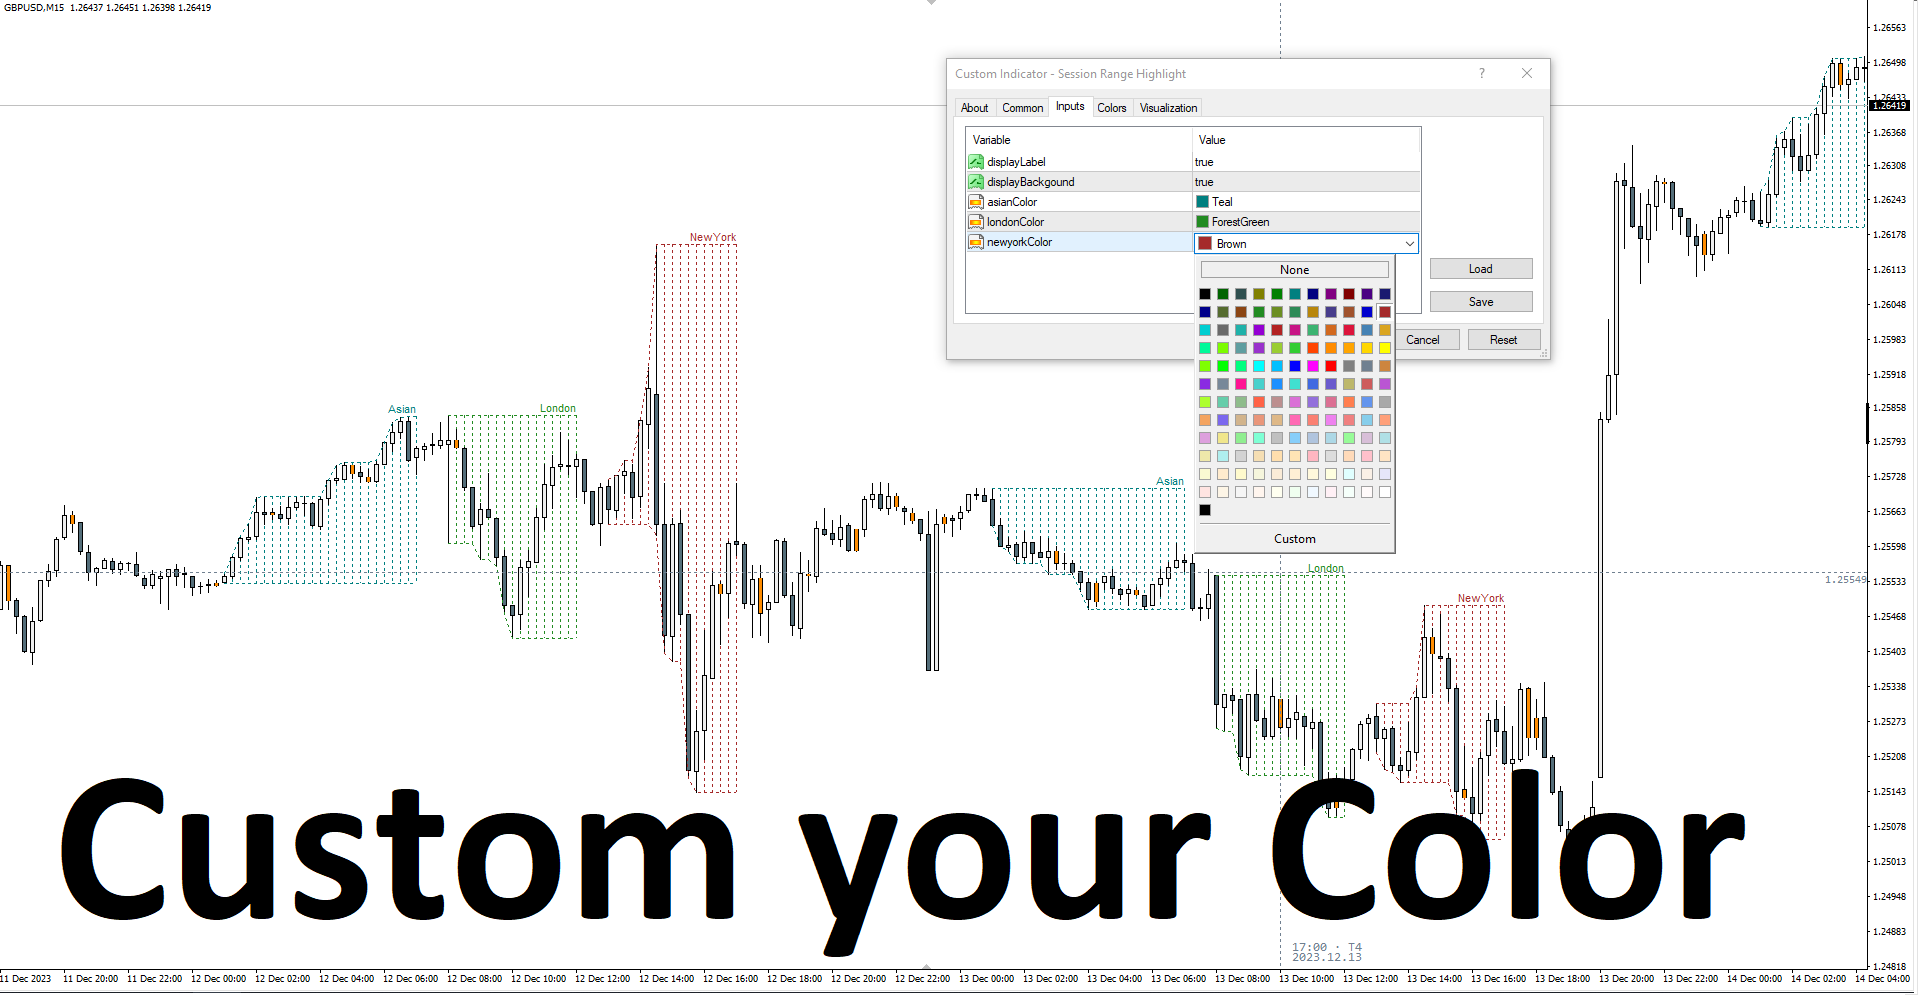
🛠️ 쉬운 사용자 정의:
- 사용자 정의 가능한 설정으로 인디케이터를 선호에 맞게 조절하세요.
- 고유한 거래 환경에 맞는 색상 및 스타일을 선택하세요.
🌐 호환성:
- 인기 있는 거래 플랫폼과의 원활한 통합으로 스트레스 없는 경험을 제공합니다.
세션 레인지 하이라이트 인디케이터로 거래 전략의 잠재력을 발휘하세요. 이것은 단순히 인디케이터가 아닌, 세션 분석을 숙달하기 위한 시각적 가이드입니다.
🛒 지금 Meta Market에서 확인하고 거래 경험을 향상시키세요!
🙏 세션 레인지 하이라이트를 선택해 주셔서 감사합니다. 행운을 빕니다!