SSn Buy Sell Signal MT5
- 지표
- Ongkysetiawan
- 버전: 1.3
- 업데이트됨: 20 12월 2023
- 활성화: 10
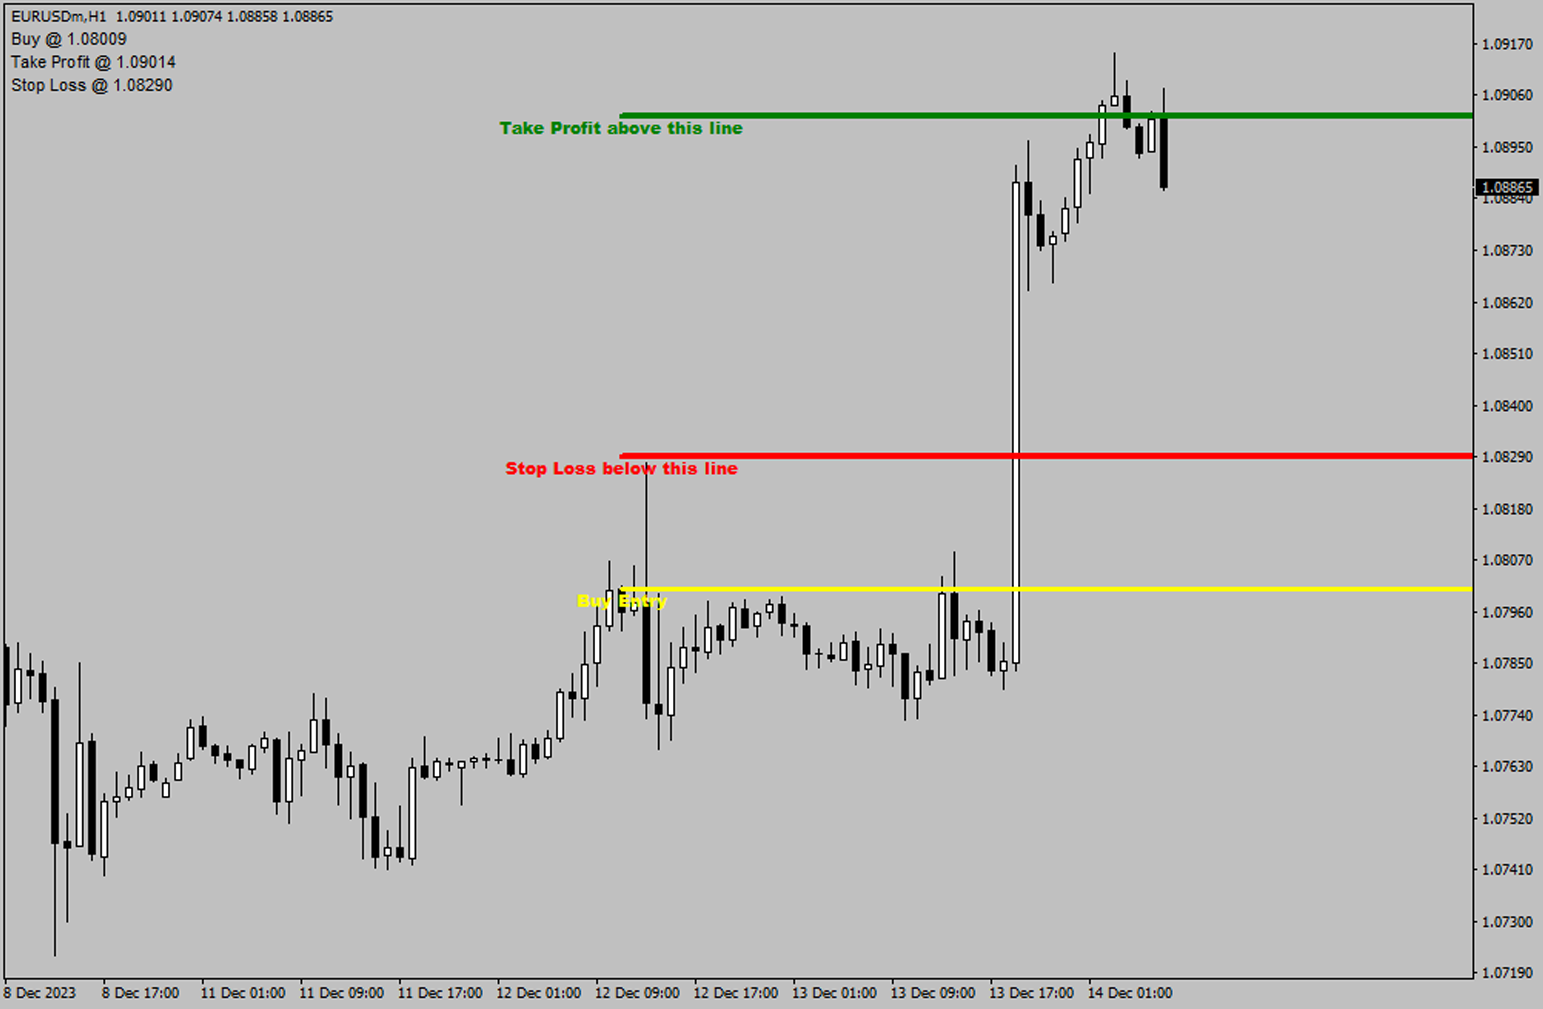
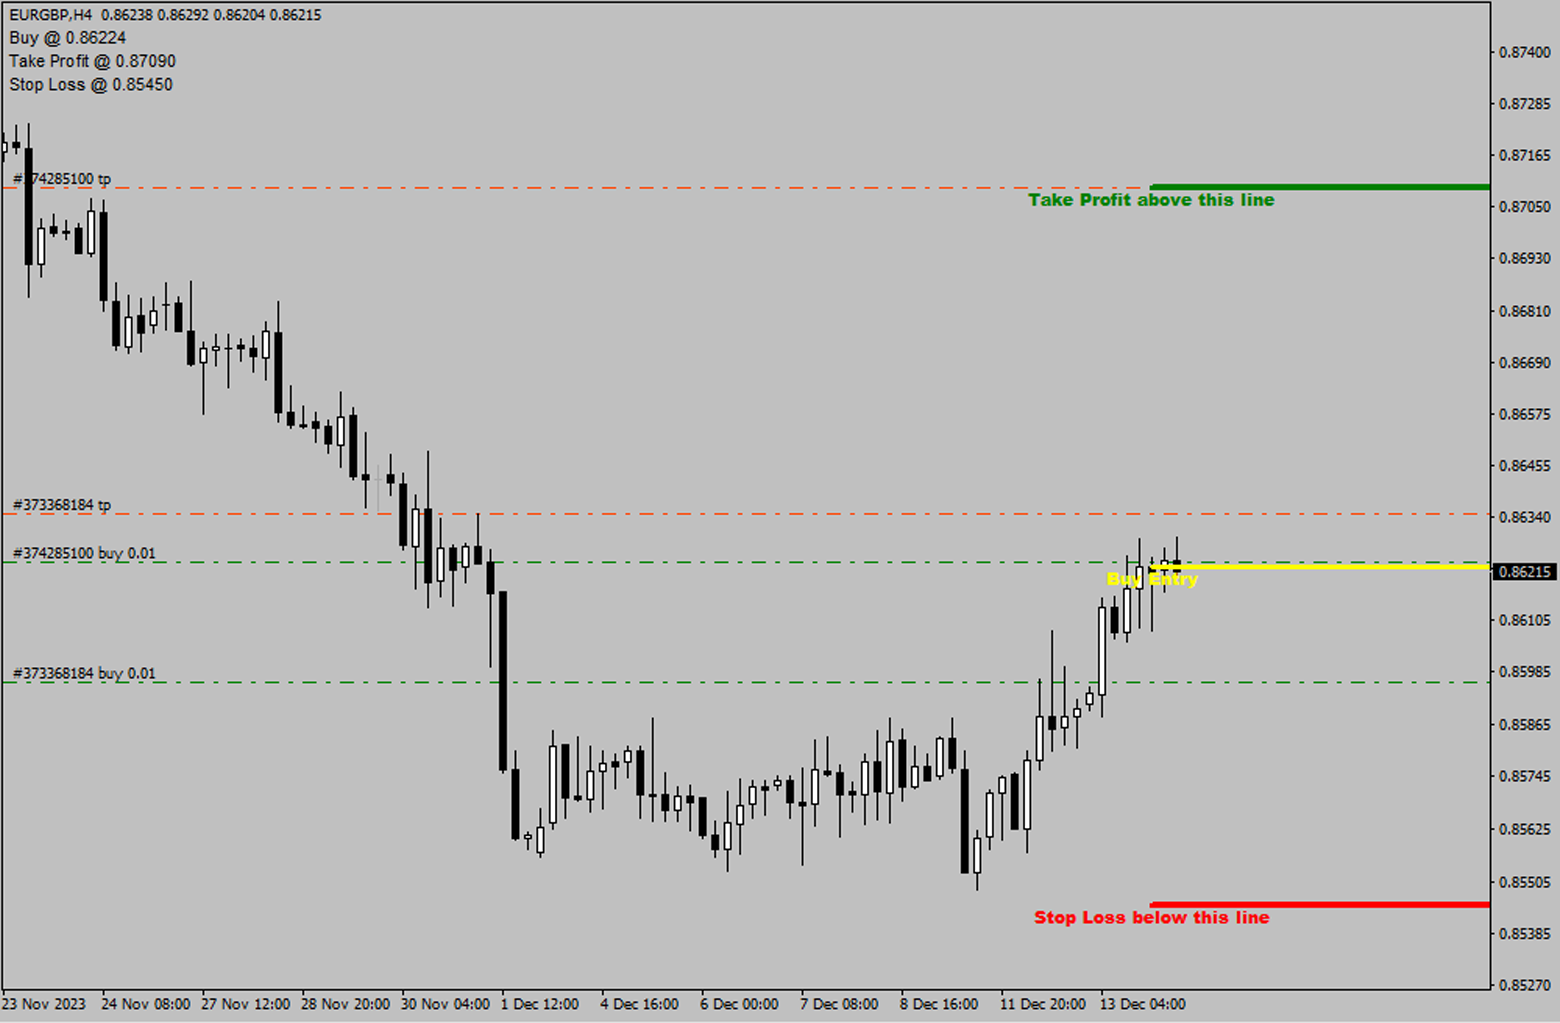
Our indicator will help you to make a decision whether to Buy or Sell, including where to set the Take Profit and Stop Loss.
The Buy/Sell signal will not redraw nor repaint until new signal occurs.
The Take Profit and Stop Loss will change following the market conditions.
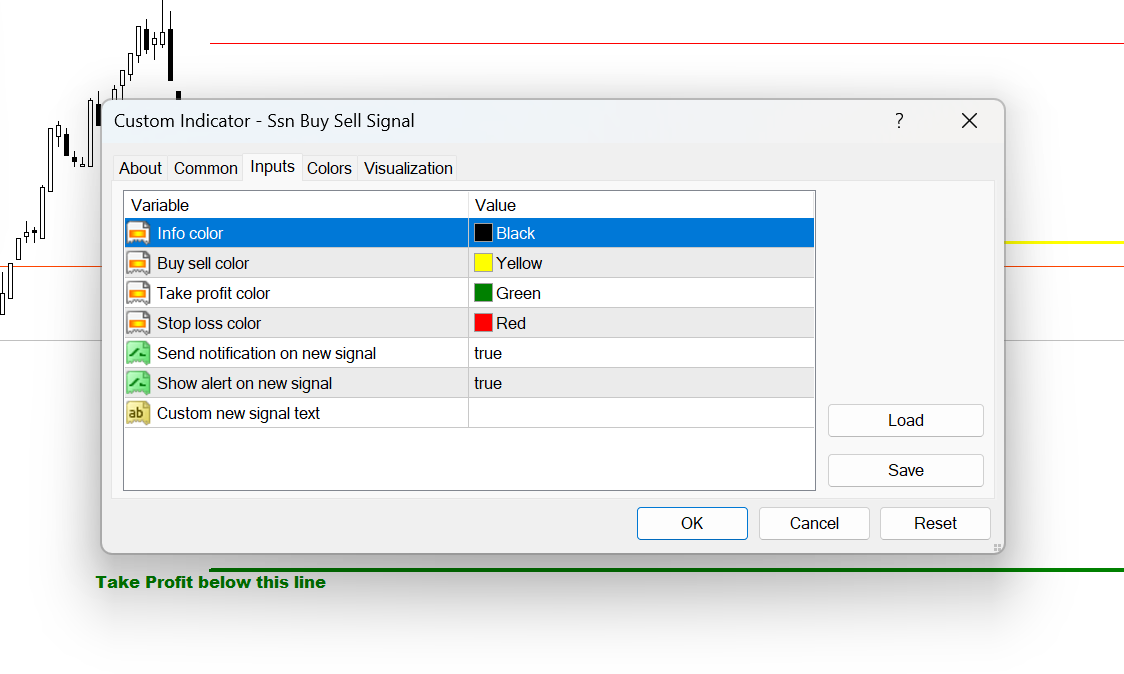
Our indicator will give alert to your mobile/handphone when new buy/sell signal arrive.
For best result, combine this indicator with your knowledge on price action and support & resistance, also don't forget to watch for the high impact news.
Recommended timeframe: H1 and above.