PTS Demand Index MT5
- 지표
- PrecisionTradingSystems
- 버전: 2.0
- 활성화: 10
정밀 거래 시스템의 PTS Demand Index 코드
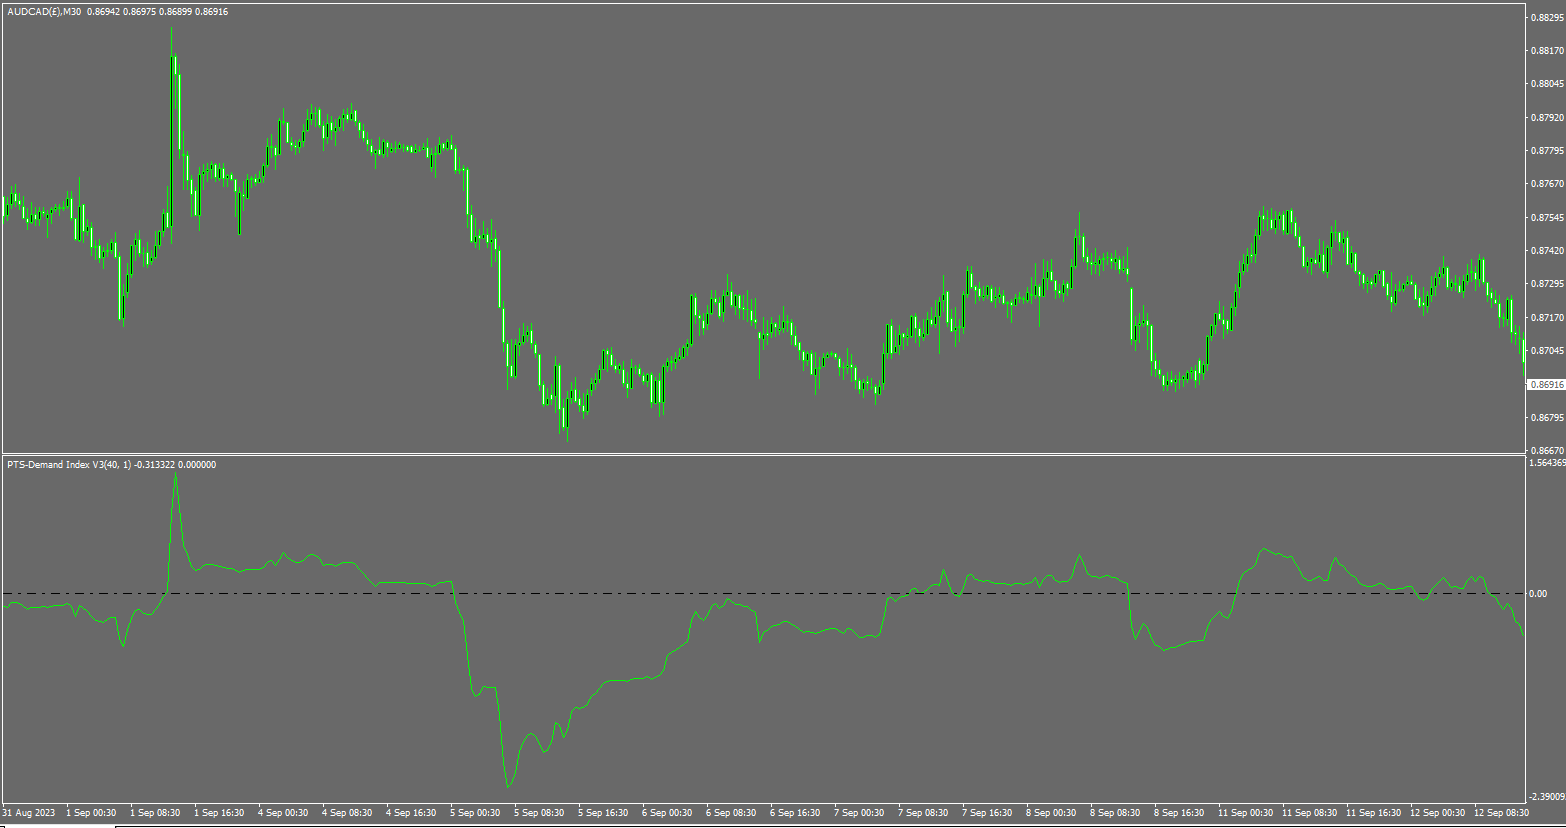
Demand Index는 James Sibbet의 창조물이며 볼륨과 가격을 조합으로 해석하는 작업을 간단하게 만들기 위해 복잡한 코드를 사용합니다.
볼륨을 이해하는 것은 쉬운 작업이 아니지만, 이 아름다운 프로그래밍 조각은 작업을 훨씬 쉽게 만듭니다.
이 지표가 거래자와 투자자에게 어떻게 혜택을 줄 수 있는 몇 가지 방법이 있습니다.
다이버전스 (선행 지표로)
여러 해 동안 다양한 기술 지표를 연구한 결과, Demand Index는 의미 있는 다이버전스를 찾는 데 한몫하는 것 중 하나라는 의견을 형성했습니다.
시장 가격이 새로운 고점을 찍고 Demand Index가 아닌 경우 이를 악재 다이버전스라고 합니다. 웹 사이트에는 어떤 것을 찾아볼 지 이해하기 위해 극단적인 다이버전스 사례를 보여주는 강렬한 사진이 여러 장 있습니다. 다이버전스의 차이가 클수록 추세 변화 이벤트를 예측하는 데 중요한 지표가 됩니다.
트렌드 감지 (내포된 경고 기능이 있는 후행 지표로)
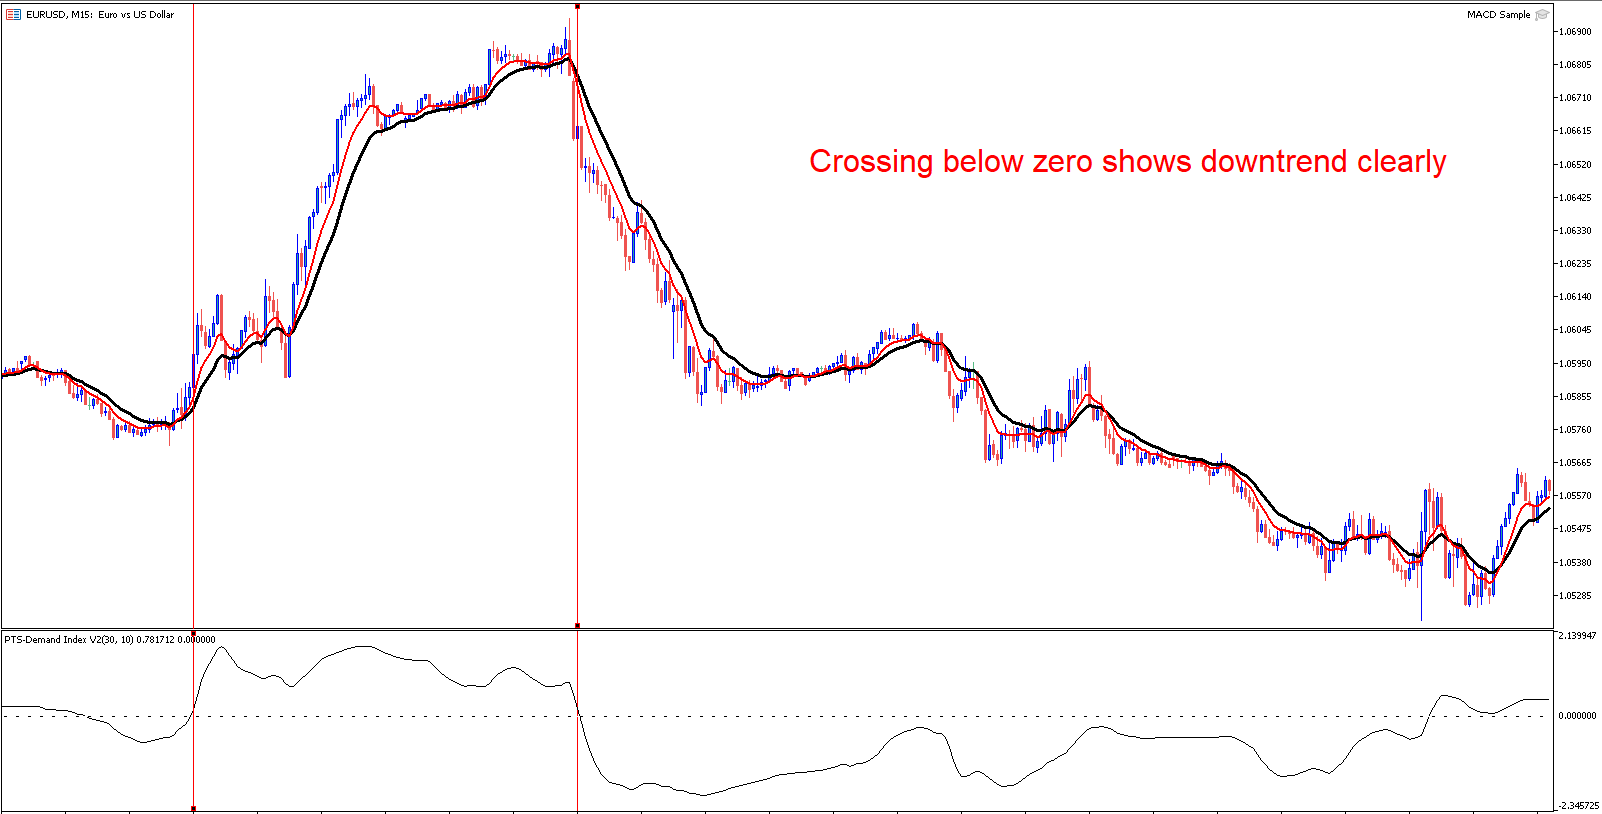
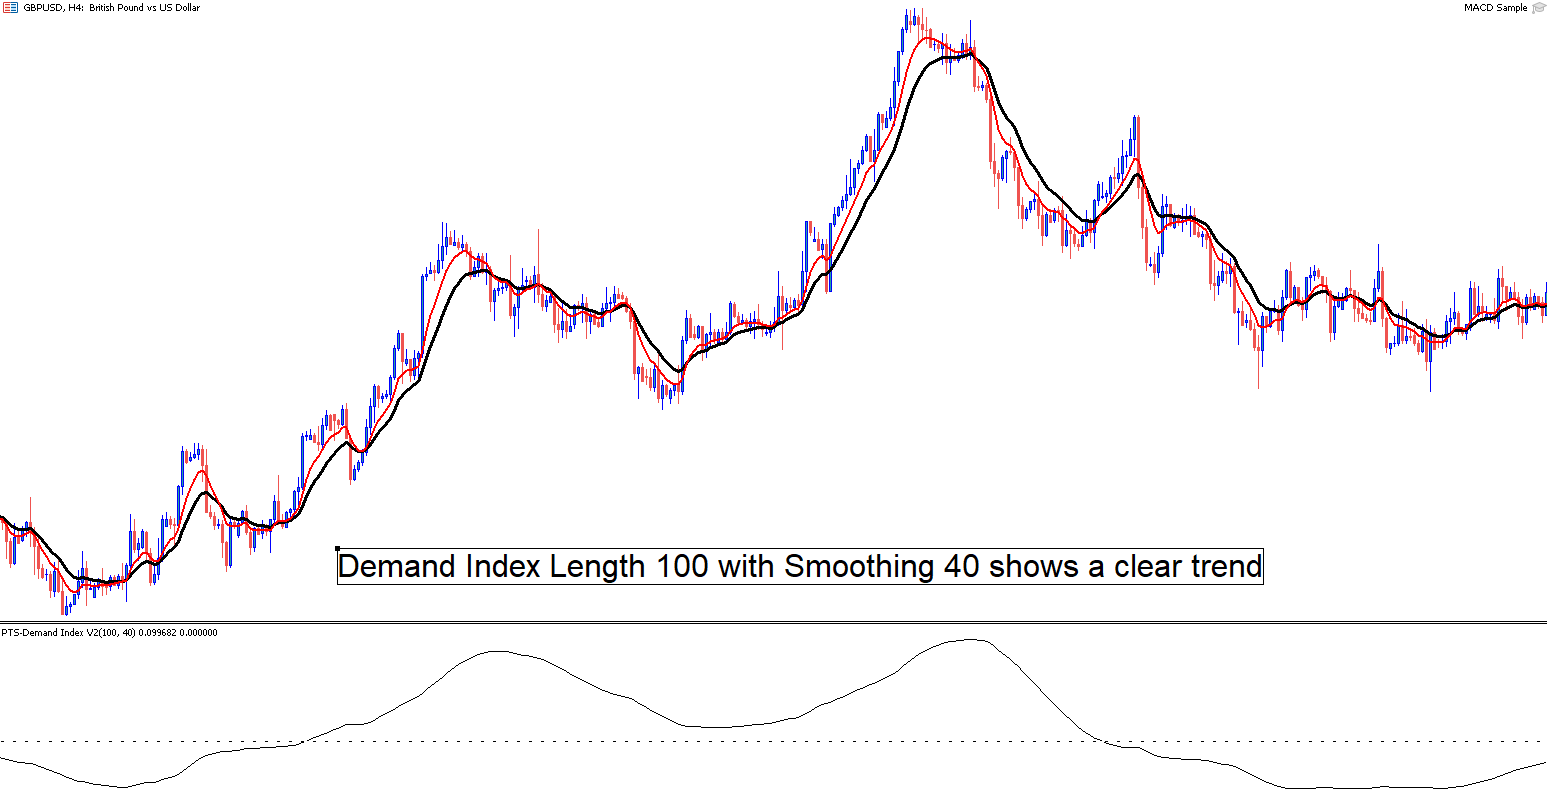
제시한 기간 동안 제로 라인을 크로스하는 것은 당신이 지정한 길이에 대한 순매도 또는 순매수를 나타냅니다. 이 방식으로 인디케이터가 후행 지표로 작동하며 의미 있는 결과를 얻으려면 일부 평활화가 필요하다는 점을 유념해야 합니다. 이를 위해 이 목적을 위한 최소 기간은 >40이며 가짜 신호를 줄이기 위해 >5 정도의 평활화가 추가되어야 합니다.
제로 크로스의 경고를 활성화하려면 인디케이터 속성, 입력, 경고 사용 = true를 클릭하십시오.
경고가 트리거되면 심볼 이름과 "Demand Index가 제로 위 (또는 아래)를 크로스했습니다"라는 메시지가 표시됩니다.
경고의 기본 설정은 false로 설정되어 있습니다.
상기 내용을 무시하더라도 "실제로 제로를 크로스한" 트렌드 변화 이동과 거짓 신호 간의 차이를 이해하는 것이 중요합니다.
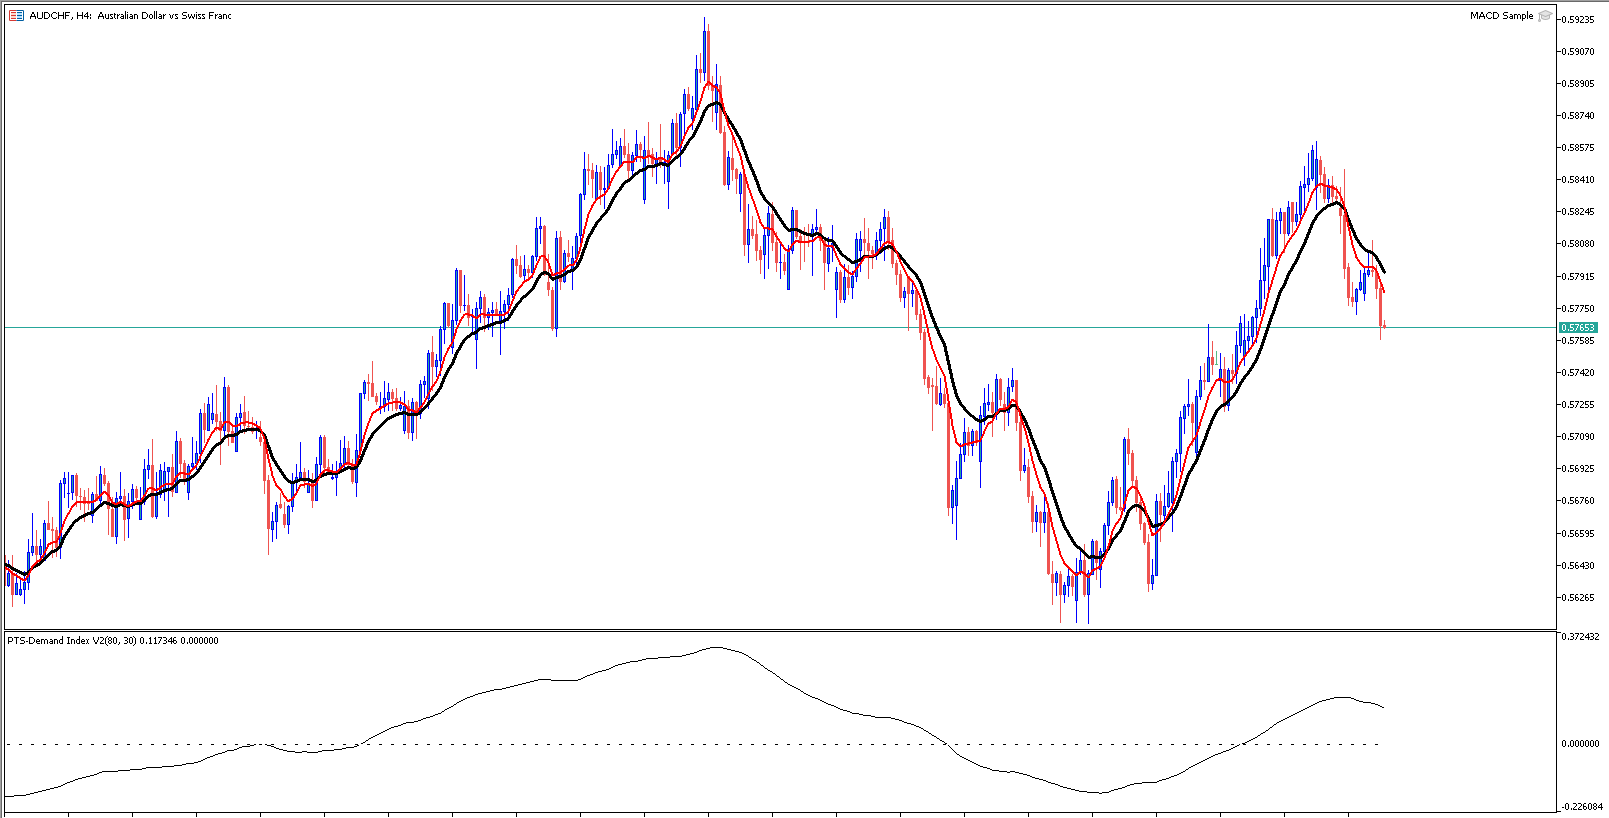
Demand Index가 제로 주변에서 맴돌고 오르내리는 경우 별로 의미가 없지만, 분명히 돌파하는 것은 찾아보아야 할 움직임입니다. 공급 또는 수요 불균형을 유발하여 인디케이터 방향으로 시장을 이끄는 공격적인 매수자 또는 매도자가 더 많은 상황을 만들기 때문에 가격을 주도합니다.
이 제품은 가능한 가장 명확한 방식으로 이 정보를 표시하도록 설계되었습니다.
돌파 (선행 지표로)
Demand Index 지표에서 범위 또는 타이트한 혼잡 영역을 볼 수 있다면, 이러한 범위에서 분명한 돌파가 발생하면 이를 지켜볼 가치가 있으며 이 돌파는 기초 시장과 동일한 방향으로 돌파될 가능성이 높습니다.
상기와 마찬가지로 "소음"과 실제 돌파 패턴의 차이를 알아야 합니다. 이것은 분명한 관찰이어야 하며 실제인지 여부를 스스로 묻는 데 시간을 들여야 한다면 아마도 조치가 필요하지 않은 신호입니다.
다음 움직임 예측 (선행 지표로)
Demand Index에서 극단적인 상승 피크가 발생하면 이는 심각한 매수를 의미하며 일반적으로 시장은 이에 따라 한 번 더 높은 피크로 이어집니다.
반대로 큰 하향 피크가 나타나면 시장은 일반적으로 다시 새로운 낮은 저점을 찍을 것으로 예상됩니다.
이러한 움직임은 종종 다이버전스를 따르며 이는 반전 추세로 이어집니다.
시간 경과에 따른 확장된 다이버전스 (선행 지표로)
시장이 계속해서 하향 추세를 보이고 Demand Index가 계속해서 상승 추세를 보이면 이는 큰 바닥이 형성되고 있다는 신호입니다. 그 반대도 마찬가지입니다.
Demand Index와 함께 사용할 수 있는 다섯 가지 새로운 규칙을 식별했으며 웹 사이트에서 검색하여 찾을 수 있습니다. 다양한 그래프 예시가 이를 명확하게 설명합니다.
질문이 있으시면 몇 주 동안