• 미리보기
  • 리뷰
  • 코멘트

Trend band analysis system

这是 一款可以直观识别波段趋势的分析指标,手工交易最佳选择,不重绘不漂移。 适应任何新手和量化交易的朋友。
参数设置(您购买指标后若不知道如何使用,请私信我):
快线:
g_period_88 20

慢线:
g_period_88 40

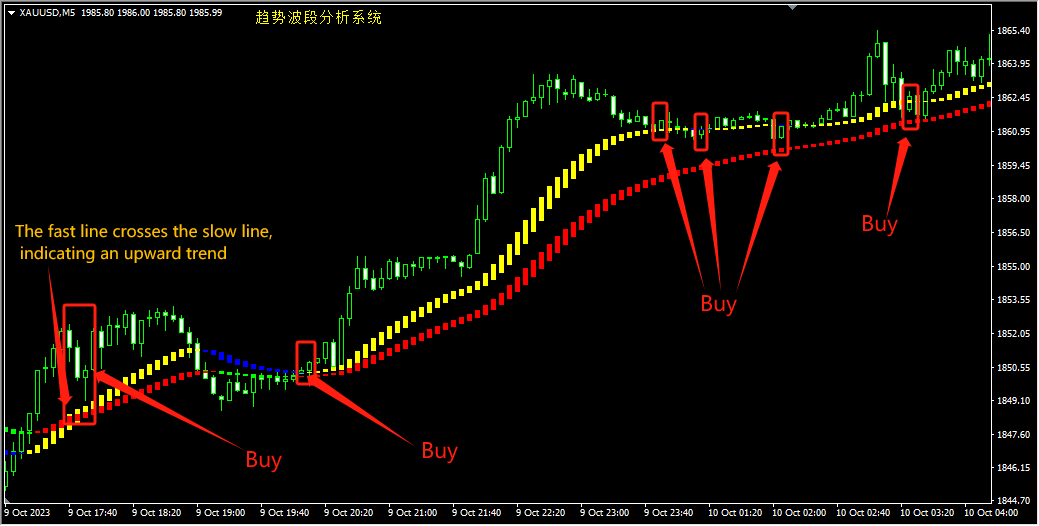
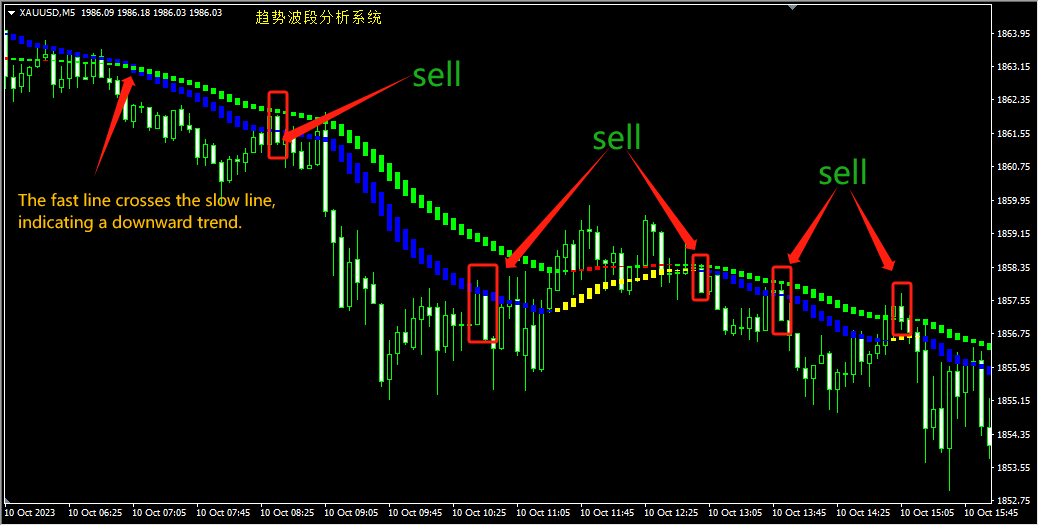
===========交易信号 ===========

快线:黄/蓝线;慢线:红/绿线
多头方向:快线上穿慢线,快线在慢线上方
空头方向:快线下穿慢线,快线在慢线下方

做多信号:
当快线上穿慢线形成一轮多头方向时,首轮多单进场条件为出现两根以上连续阴线,第3根以上K线出现一根阳线,且收盘价格在慢线上方,慢线为红线,即可成交第一单多单,同时如果满足价格回踩触碰到快线,出现一条阳线,且收盘价格在慢线上方,慢线为红线时,也可成交第一单多单;当第一轮多单结束后,此轮多头方向的多单只能满足价格回踩触碰到快线后,出现一条阳线收盘价格在慢线上方,慢线为红线时,才可继续做多进场,即不管快线是黄线或蓝线,只要阳线收盘价格在慢线上方,慢线为红线时就可以做多进场;当快线在慢线上方,阳线收盘价格在慢线上方,但慢线为绿线时,则不进场

做空信号:
当快线下穿慢线形成一轮空头方向时,首轮空单进场条件为出现两根以上连续阳线,第3根以上K线出现一根阴线,且收盘价格在慢线下方,慢线为绿线,即可成交第一单空单,同时如果满足价格回踩触碰到快线,出现一条阴线,且收盘价格在慢线下方,慢线为绿线时,也可成交第一单空单;当第一轮空单结束后,此轮空头方向的空单只能满足价格回踩触碰到快线后,出现一条阴线收盘价格在慢线下方,慢线为绿线时,才可继续做空进场,即不管快线是黄线或蓝线,只要阴线收盘价格在慢线下方,慢线为绿线时就可以做空进场;当快线在慢线下方,阴线收盘价格在慢线下方,但慢线为红线时,则不进场
추천 제품
Infinity Trend Pro
Yaroslav Varankin
1 (1)
This is a trend indicator without redrawing Developed instead of the binary options strategy (by the color of the Martingale candlestick) Also works well in forex trading When to open trades (binary options) A signal will appear in the place with a candle signaling the current candle It is recommended to open a deal for one candle of the current timeframe M1 and M5 When a blue dot appears, open a deal up When a red dot appears, open a trade down. How to open trades on Forex. When a signal is rec
Owl smart levels
Sergey Ermolov
4.63 (54)
MT5 버전  |   FAQ Owl Smart Levels Indicator 는   Bill Williams 의 고급 프랙탈, 시장의 올바른 파동 구조를 구축하는 Valable ZigZag, 정확한 진입 수준을 표시하는 피보나치 수준과 같은 인기 있는 시장 분석 도구를 포함하는 하나의 지표 내에서 완전한 거래 시스템입니다. 시장과 이익을 취하는 장소로. 전략에 대한 자세한 설명 표시기 작업에 대한 지침 고문-거래 올빼미 도우미의 조수 개인 사용자 채팅 ->구입 후 나에게 쓰기,나는 개인 채팅에 당신을 추가하고 거기에 모든 보너스를 다운로드 할 수 있습니다 힘은 단순함에 있습니다! Owl Smart Levels   거래 시스템은 사용하기 매우 쉽기 때문에 전문가와 이제 막 시장을 연구하고 스스로 거래 전략을 선택하기 시작한 사람들 모두에게 적합합니다. 전략 및 지표에는 눈에 보이지 않는 비밀 공식 및 계산 방법이 없으며 모든 전략 지표는 공개되어 있습니다. Owl Smart Lev
Before
Nadiya Mirosh
The Before indicator predicts the most likely short-term price movement based on complex mathematical calculations. Most of the standard indicators commonly used in trading strategies are based on fairly simple calculations. This does not mean that there were no outstanding mathematicians in the world at the time of their creation. It is just that computers did not yet exist in those days, or their power was not enough for the sequential implementation of complex mathematical operations. Nowa
Line Magnit
Aleksey Trenin
The LineMagnit Indicator for MT4 is a highly precise tool that builds support and resistance levels which magnetically attract prices. This feature allows traders to easily determine the most probable entry and exit points in the market, as well as identify the market's directional forces, as levels are based on capital inflows into the instrument. Equipped with an intuitively understandable graphical interface, the LineMagnit Indicator enables users to quickly locate and analyze support and res
PABT Pattern Indicator - it's classical system one of the signal patterns. Indicator logic - the Hi & Lo of the bar is fully within the range of the preceding bar, look to trade them as pullback in trend. In the way if indicator found PABT pattern it's drawing two lines and arrow what showing trend way.  - First line - it's entry point and drawing at: 1. On the high of signal bar or on middle of the signal bar (depending from indicator mode) for buy; 2. On the low of signal bar or on middle of t
Gold Phoenix
Yaroslav Varankin
The perfect tool for Scalng in the Forex markets You can trade both from signal to signal and using take profit  The algorithm does not use Zigzag!  No redrawing!  This is a channel instrument that uses a moving average as a filter. Moving Average  There are 2 parameters for the settings Ma Period = 5 period Moving Average  Channel 1.0 distance of channel lines from the chart Price Signal Filter - calculation of signal opening and filter There is a complete set of Alert There is a multi-timefram
Insider Scalper Binary This tool is designed to trade binary options. for short temporary spends. to make a deal is worth the moment of receiving the signal and only 1 candle if it is m1 then only for a minute and so in accordance with the timeframe. for better results, you need to select well-volatile charts.... recommended currency pairs eur | usd, usd | jpy .... the indicator is already configured, you just have to add it to the chart and trade .... The indicator signals the next can
VR Cub
Vladimir Pastushak
VR Cub 은 고품질 진입점을 얻는 지표입니다. 이 지표는 수학적 계산을 용이하게 하고 포지션 진입점 검색을 단순화하기 위해 개발되었습니다. 지표가 작성된 거래 전략은 수년 동안 그 효율성을 입증해 왔습니다. 거래 전략의 단순성은 초보 거래자라도 성공적으로 거래할 수 있다는 큰 장점입니다. VR Cub은 포지션 개시 지점과 이익 실현 및 손절매 목표 수준을 계산하여 효율성과 사용 편의성을 크게 높입니다. 간단한 거래 규칙을 이해하려면 아래 전략을 사용한 거래 스크린샷을 살펴보세요. 설정, 세트 파일, 데모 버전, 지침, 문제 해결 등은 다음에서 얻을 수 있습니다. [블로그] 다음에서 리뷰를 읽거나 작성할 수 있습니다. [링크] 버전 [MetaTrader 5] 진입점 계산 규칙 포지션 개설 진입점을 계산하려면 VR Cub 도구를 마지막 최고점에서 마지막 최저점까지 늘려야 합니다. 첫 번째 지점이 두 번째 지점보다 빠른 경우, 거래자는 막대가 중간선 위에서 마감될 때까지 기다립
Trendiness Index
Libertas LLC
5 (3)
"The trend is your friend" is one of the best known sayings in investing, because capturing large trendy price movements can be extremely profitable. However, trading with the trend is often easier said than done, because many indicators are based on price reversals not trends. These aren't very effective at identifying trendy periods, or predicting whether trends will continue. We developed the Trendiness Index to help address this problem by indicating the strength and direction of price trend
MasterArrow
Pavel Krysanov
5 (1)
Correct market entries and exits are essential for any Forex trader. MasterArrow indicator addresses this issue. It has no redundant elements and draws only buy/sell arrows. The up arrow is a BUY signal, while the down arrow is a SELL one. The indicator is simple to configure. Change the Strength parameter to configure the signals frequency. The product is based on standard indicators (MA, RSI, ATR, etc.). But it also features the custom algorithm allowing to combine them into a single tool and
DivirgentMAX
Mikhail Bilan
Indicator without redrawing Divergent MAX The DivirgentMAX indicator is a modification based on the MACD. The tool detects divergence based on OsMA and sends signals to buy or sell (buy|sell), taking into account the type of discrepancies detected. Important!!!! In the DivirgentMAX indicator, the optimal entry points are drawn using arrows in the indicator's basement. Divergence is also displayed graphically. In this modification of the MACD, the lag problem characteristic of its predecessor
Crosskalp1
Mikhail Bilan
Добрый День уважаемые трейдеры!  Вашему вниманию индикатор созданный и работающий на базе трендовика ADX,  для торговли на смене направления движения который учитывает коррекцию и даёт возможность на ней заработать.  Применяю этот индикатор для скальпинга. Рекомендую таймфреймы от 15 ти минутного(М15) до часового (Н1) периодов.  Красный кружок сигнал на продажу- Sell) Зелёный кружок  сигнал на покупку Buy) Чем меньше ваш таймфрейм тем меньше пунктов вы зарабатываете.   Важно выставлять стопы! !В
Rubdfx OBOS
Namu Makwembo
Upgraded version 1.5 , Arrow added on to indicate Buy and Sell Signal,  The indicator is an ossicaltor that targets  the highest buying and lowest selling levels , the signal indicated by the two lines crossing  above and below zero line 0 HOW IT WORKS? Buying : you want to place your buy Entry when the yellow line is above the blue line ; stop loss just a few pips below the swing low , take profit when the lines cross again  - A Buy arrow will also appear when the crossing appears Selling:   yo
GG TrendBar Indicator
Biswarup Banerjee
5 (1)
GG TrendBar Indicator - Your Multitimeframe ADX Trading Solution Experience the power of multi-timeframe trading with the "GG TrendBar Indicator." This versatile tool, built upon the ADX indicator, offers precise insights by considering multiple timeframes, ensuring you make well-informed trading decisions. Basic Details : Indicator Type : GG TrendBar Indicator (Multi-Timeframe ADX) Key Metrics : Real-time ADX analysis across multiple timeframes. Customization : Enable or disable specific timefr
COG LR Osc AM
Andriy Matviyevs'kyy
The presented indicator allows you to determine potential entry points into the market and set protective orders at reasonable levels. This product can be useful for both beginners and experienced traders. The indicator is based on calculation methods proven by time and practicing traders. The indicator is calculated in two stages: At the first stage, linear regression (LR) of the selected price type is determined for a given number of chart periods. At the second stage, the obtained data is p
Black series MT4
Dmitriy Kashevich
1 (1)
Black series MT4 - The indicator is designed for trading on binary options with Timeframe M1-M5-M15 Multicurrency (Works on cryptocurrency and currency pairs) The signal appears when the candle opens Up to 90% correct signals There is no signal redrawing at all Can be used with other indicators. Good for scalping! In Settings there is: -Indicator working methods -I Allert Arrow color Red signal down Blue signal up Also watch the video how the indicator works and signals
ADX Pointer
Dominik Mandok
ADX Pointer is an indicator which is based on "Average Directional Index" and draws three numbers in chart window depending on the value of ADX. In ADX Pointer you can set "ADX_Period" which is of course period of Average Directional Index and you can also set 3 levels. When ADX value exceed first level ("ADX_Level1") in chart window appears number "1", when ADX exceed second level ("ADX_Level2") appears "2" and when ADX exceed third level ("ADX_Level3") appears "3". Simple. ADX Pointer works on
Grid Expert
Shahid Rasool
5 (2)
The  Grid Expert  Expert Advisor is a professional tool for trading grids of orders on financial instruments. The algorithm of the program is arranged in such a way that the EA uses signals based not on the current price, but on the price of the edges of channel. A special algorithm calculates the channel and the price range and uses it to generate signals. A special code processes the channel for the last several periods to identify the trend direction. Advantages Automatic trading mode, no n
Professional forex expert   Black Angel   (for EURUSD, GBPUSD pairs) alyzing the market using the Elliot Wave Index. Elliott wave theory is the interpretation of processes in financial markets through a system of visual models (waves) on price charts. The author of the theory, Ralph Elliott, identified eight variants of alternating waves (of which five are in the trend and three are against the trend). The movement of prices in the markets takes the form of five waves. Three of them (1, 3, 5)
Atomic Analyst
Issam Kassas
5 (3)
우선적으로 언급할 점은이 거래 지표가 다시 그리지 않고 지연되지 않으며 이를 통해 수동 및 로봇 거래 모두에 이상적이라는 점입니다. 사용자 매뉴얼: 설정, 입력 및 전략. Atomic Analyst는 가격의 강도와 모멘텀을 활용하여 시장에서 더 나은 이점을 찾는 PA Price Action Indicator입니다. 고급 필터를 장착하여 잡음과 거짓 신호를 제거하고 거래 잠재력을 높이는 데 도움이 됩니다. 복잡한 지표의 다중 레이어를 사용하여 Atomic Analyst는 차트를 스캔하고 복잡한 수학적 계산을 간단한 신호와 색상으로 변환하여 초보 트레이더가 이해하고 일관된 거래 결정을 내릴 수 있도록합니다. "Atomic Analyst"는 새로운 및 경험이 풍부한 트레이더를위한 종합적인 거래 솔루션입니다. 프리미엄 지표와 최고 수준의 기능을 하나의 거래 전략에 결합하여 모든 종류의 트레이더에 대한 다재다능한 선택지가되었습니다. 인트라데이 거래 및 스캘핑 전략 : 빠르고 정확한
Chart Patterns Detect 15 patterns (Ascending Triangle, Descending Triangle, Rising Wedge, Falling Wedge, Bullish Flag, Bearish Flag, Bullish Rectangle, Bearish Rectangle Symmetrical triangle, Head and Shoulders, Inverted Head and Shoulders, Triple top, Triple Bottom, Double Top, Double Bottom) Use historical data to calculate the probability of each pattern to succeed (possibility to filter notification according to the chance of success) gives graphic indication about the invalidation level and
-   Real price is 90$   - 50% Discount ( It is 45$ now ) Contact me for instruction, any questions! Introduction V Bottoms and Tops are popular   chart patterns   among traders due to their potential for identifying trend reversals. These patterns are characterized by sharp and sudden price movements, creating a V-shaped or inverted V-shaped formation on the   chart . By recognizing these patterns, traders can anticipate potential shifts in market direction and position themselves according
Stepping Trend
Mpendulo Chiliza
The Stepping Trend Indicator     The Steppi ng Trend indicator uses the  average true range  (ATR indicator) in its calculation. This gives you control to set your own average true range period, I set the Default as 10.   Indicator Details. Green Arrow Up: This means you are at the starting point of a new bullish trend, it’s time to buy.   Red  Arrow  Down : This means you are at the starting point of a new  bearish  trend, it’ s time to sell .   What if you miss the Arrow Signal?   No
UniversalIndicator
Andrey Spiridonov
UniversalIndicator is a universal indicator. A great helper for beginners and professional traders. The indicator algorithm uses probabilistic and statistical methods for analyzing the price of a trading instrument. The indicator is set in the usual way. Advantages of the indicator works on any time period works with any trading tool has a high probability of a positive forecast does not redraw Indicator Parameters LengthForecast = 30 - the number of predicted bars
Advanced Trend Regime
Shellard Securities (Pty) Ltd
The indicator has been designed to function on any time-frame and any pair.   This regime filter will help the trader better evaluate whether the current market is trending, and in which direction. It quickly reacts to changes in market dynamics using a series of advanced calculations. The user is able to select whether the calculation remains standard, or if a further filter constraint is added to the calculation.   A Yellow moving average of the signal has been included for the trader to smoot
Indicador Taurus All4
Fabio Oliveira Magalhaes
Taurus All4 Taurus All4 is a high-performance indicator, it will tell you the strength of the trend, and you will be able to observe the strength of the candle. Our indicator has more than 4 trend confirmations. It is very simple and easy to use. Confirmation Modes Candle Trend Confirmations: When the candle switches to light green the trend is high. When the candle switches to light red the trend is reverting down. When the candle changes to dark red the trend is low. Trendline Trend Conf
The robot uses the trading strategy of breaking the lines of the Bollinger Bands indicator. The essence of this strategy lies in the constant analysis of the indicator lines and the search for the most effective breakout points for its lines. When the price breaks through the indicator line in one of the directions, the robot opens a trade in that direction and starts to follow it. But the robot does not open trades every time the indicator lines are broken, but only in those places where it co
Trend Flasher
Amarnath K M
Trend Flasher Trend is your friend is the age old saying quote in trading arena, there are though many ways to gauge the trend and its direction, more scientific measure and logically meaningful will be an ATR break outs to identify and spot the trend and its acceleration, so we created this easy to use trend identification panel and optimized super trend based multi time frame panel entry system to aid and help the traders to make their trading decision. Unique Features of Trend Flasher 1
캔들의 종가를 예측하는 지표입니다. 지표는 주로 D1 차트에서 사용하기 위한 것이. 이 지표는 전통적인 외환 거래와 바이너리 옵션 거래 모두에 적합합니다. 지표는 독립형 거래 시스템으로 사용하거나 기존 거래 시스템에 추가로 사용할 수 있습니다. 이 표시기는 현재 양초를 분석하여 양초 본체 내부의 특정 강도 요인과 이전 양초의 매개변수를 계산합니다. 따라서 지표는 시장 움직임의 추가 방향과 현재 양초의 종가를 예측합니다. 이 방법 덕분에 지표는 단기 및 중장기 거래 모두에 적합합니다. 지표를 사용하면 시장 상황을 분석하는 동안 지표가 생성할 잠재적 신호의 수를 설정할 수 있습니다. 표시기 설정에는 이를 위한 특별한 매개변수가 있습니다. 또한 인디케이터는 새로운 신호에 대해 차트의 메시지 형태, 이메일 및 PUSH 알림 형태로 알릴 수 있습니다. 구매 후 저에게 꼭 써주세요! 나는 당신에게 지표와 거래에 대한 나의 추천을 줄 것입니다! 또한 보너스를 받으세요!
Alpha Trend
Evgeny Belyaev
3.33 (3)
Alpha Trend is a trend indicator for the MetaTrader 4 platform; it has been developed by a group of professional traders. The Alpha Trend indicator finds the most probable tendency reversal points, which allows making trades at the very beginning of a trend. This indicator features notifications, which are generated whenever a new signal appears (alert, email, push-notification). This allows you to open a position in a timely manner. Alpha Trend does not redraw, which makes it possible to evalua
이 제품의 구매자들이 또한 구매함
TPSpro RFI Levels
Roman Podpora
4.83 (18)
Reversal First Impulse levels (RFI)    INSTRUCTIONS        RUS       -       ENG              R ecommended to use with an indicator   -   TREND PRO -  Version MT5 A key element in trading is zones or levels from which decisions to buy or sell a trading instrument are made. Despite attempts by major players to conceal their presence in the market, they inevitably leave traces. Our task was to learn how to identify these traces and interpret them correctly. Main functions: Displaying active zones
Scalper Inside PRO
Alexey Minkov
4.74 (58)
An exclusive indicator that utilizes an innovative algorithm to swiftly and accurately determine the market trend. The indicator automatically calculates opening, closing, and profit levels, providing detailed trading statistics. With these features, you can choose the most appropriate trading instrument for the current market conditions. Additionally, you can easily integrate your own arrow indicators into Scalper Inside Pro to quickly evaluate their statistics and profitability. Scalper Inside
현재 20% 할인 ! 초보자 또는 전문가 트레이더를 위한 최고의 솔루션! 이 대시보드 소프트웨어는 28개의 통화 쌍에서 작동합니다. 2가지 주요 지표(Advanced Currency Strength 28 및 Advanced Currency Impulse)를 기반으로 합니다. 전체 Forex 시장에 대한 훌륭한 개요를 제공합니다. 고급 통화 강도 값, 통화 이동 속도 및 모든(9) 시간대의 28 Forex 쌍에 대한 신호를 보여줍니다. 추세 및/또는 스캘핑 기회를 정확히 파악하기 위해 차트의 단일 지표를 사용하여 전체 시장을 볼 수 있을 때 거래가 어떻게 개선될지 상상해 보십시오! 잠재적인 거래를 식별하고 확인하면서 강력한 통화와 약한 통화를 더욱 쉽게 식별할 수 있도록 이 지표에 기능을 내장했습니다. 이 표시기는 통화의 강세 또는 약세가 증가 또는 감소하는지 여부와 모든 시간대에서 수행되는 방식을 그래픽으로 보여줍니다. 추가된 새로운 기능은 현재 시장 조건 변화에 적
TPSproTREND PrO
Roman Podpora
4.78 (18)
TPSpro TRENDPRO  - is a trend indicator that automatically analyzes the market and provides information about the trend and each of its changes, as well as giving signals for entering trades without redrawing! The indicator uses each candle, analyzing them separately. referring to different impulses - up or down impulse. Exact entry points into transactions for currencies, crypto, metals, stocks, indices!  -  Version MT5               DETAILED DESCRIPTION                R ecommended to use with
FX Power MT4 NG
Daniel Stein
5 (10)
모닝 브리핑 여기 mql5 와 텔레그램에서 FX Power MT4 NG 는 오랫동안 인기 있는 통화 강도 측정기인 FX Power의 차세대 버전입니다. 이 차세대 강도 측정기는 무엇을 제공합니까? 기존 FX Power에서 좋아했던 모든 것 PLUS GOLD/XAU 강도 분석 더욱 정밀한 계산 결과 개별 구성 가능한 분석 기간 더 나은 성능을 위한 사용자 정의 가능한 계산 한도 특별 멀티더 많은 것을보고 싶은 사람들을위한 특별한 다중 인스턴스 설정 모든 차트에서 좋아하는 색상을위한 끝없는 그래픽 설정 수많은 알림 옵션, 중요한 것을 다시는 놓치지 않도록 Windows 11 및 macOS 스타일의 둥근 모서리가 있는 새로운 디자인 마법처럼 움직이는 인디케이터 패널 FX 파워 키 특징 모든 주요 통화의 완전한 강세 이력 모든 시간대에 걸친 통화 강세 이력 모든 브로커 및 차트에서 고유 계산 결과 100% 신뢰할 수있는 실시간100 % 신뢰할 수있는 실시간 계산-> 다시 칠하지 않음
Volatility Trend System - a trading system that gives signals for entries. The volatility system gives linear and point signals in the direction of the trend, as well as signals to exit it, without redrawing and delays. The trend indicator monitors the direction of the medium-term trend, shows the direction and its change. The signal indicator is based on changes in volatility and shows market entries. The indicator is equipped with several types of alerts. Can be applied to various trading
NAM Order Blocks
NAM TECH GROUP, CORP.
5 (1)
MT4 Multi-timeframe Order Blocks detection indicator. Features - Fully customizable on chart control panel, provides complete interaction. - Hide and show control panel wherever you want. - Detect OBs on multiple timeframes. - Select OBs quantity to display. - Different OBs user interface. - Different filters on OBs. - OB proximity alert. - ADR High and Low lines. - Notification service (Screen alerts | Push notifications). Summary Order block is a market behavior that indicates order collection
FX Volume
Daniel Stein
4.6 (35)
모닝 브리핑을 통해 세부 정보와 스크린샷으로 매일 시장 업데이트를 받으세요 여기 mql5 및 텔레그램에서 FX 거래량은 브로커의 관점에서 시장 심리에 대한 실제 통찰력을 제공하는 최초이자 유일한 거래량 지표입니다. 브로커와 같은 기관 시장 참여자가 외환 시장에서 어떤 포지션을 취하고 있는지에 대한 훌륭한 통찰력을 COT 보고서보다 훨씬 빠르게 제공합니다. 차트에서 이 정보를 직접 확인하는 것은 트레이딩의 진정한 판도를 바꾸고 획기적인 솔루션입니다. 다음과 같은 고유한 시장 데이터 인사이트의 이점 비율 는 통화의 매수/매도 포지션 비율을 백분율로 표시 비율 변화 는 선택한 기간 내 매수 비율과 비율 변화를 표시 총 거래량 는 해당 통화의 총 거래량(롱 및 숏)을 로트 단위로 보여줍니다 Volumes Long 는 해당 통화의 모든 롱 포지션의 거래량을 보여줍니다 Volumes Short 는 해당 통화의 모든 숏 포지션의 거래량을 보여줍니다 Net Long 는 순 롱 포지션의 거래량
TrendMaestro
Stefano Frisetti
5 (3)
note: this indicator is for METATRADER4, if you want the version for METATRADER5 this is the link:  https://www.mql5.com/it/market/product/108106 TRENDMAESTRO ver 2.4 TRENDMAESTRO recognizes a new TREND in the bud, he never makes mistakes. The certainty of identifying a new TREND is priceless. DESCRIPTION TRENDMAESTRO identifies a new TREND in the bud, this indicator examines the volatility, volumes and momentum to identify the moment in which there is an explosion of one or more of these data a
Basic Harmonic Patterns Dashboard
Mehran Sepah Mansoor
5 (2)
이 대시보드는 선택한 심볼에 대해 사용 가능한 최신 고조파 패턴을 표시하므로 시간을 절약하고 더 효율적으로 사용할 수 있습니다 / MT5 버전 . 무료 인디케이터: Basic Harmonic Pattern 인디케이터 열 Symbol : 선택한 심볼이 나타납니다 Trend : 강세 또는 약세 Pattern : 패턴 유형(가틀리, 나비, 박쥐, 게, 상어, 사이퍼 또는 ABCD) Entry : 진입 가격 SL: 스톱로스 가격 TP1: 1차 테이크프로핏 가격 TP2: 2차 테이크프로핏 가격 TP3: 3차 테이크프로핏 가격 Current price: 현재 가격 Age (in bars): 마지막으로 그려진 패턴의 나이 주요 입력 Symbols : "28개 주요 통화쌍" 또는 "선택한 심볼" 중에서 선택합니다. Selected Symbols : 쉼표로 구분하여 모니터링하려는 원하는 심볼("EURUSD,GBPUSD,XAUUSD")을 선택합니다. 브로커에 쌍에 접미사 또는 접두사가
Volume by Price MT4
Brian Collard
4.71 (14)
The Volume by Price Indicator for MetaTrader 4 features Volume Profile and Market Profile TPO (Time Price Opportunity). Volume and TPO histogram bar and line charts. Volume Footprint charts. TPO letter and block marker collapsed and split structure charts. Session filtering and grouping. Static, dynamic and flexible range segmentation and compositing methods with relative and absolute visualizations. Graphical layering, positioning and styling options to suit the user's analytic and aesthetic n
Up down v6T
Guner Koca
5 (1)
Thise indicator is up down v6  comes with tradingwiev pinescript. purchased people, after installed on terminal ,contact me on mql5  to get BONUS  TradingView pinescript. up-down indicator is no repaint and works all pairs and lower than weekly time frames charts. it is suitable also 1 m charts for all pairs. and hold long way to signal. dont gives too many signals. when red histogram cross trigger line that is up signal.and price probably will down when blue histogram cross trigger line that
MTF Supply Demand Zones
Georgios Kalomoiropoulos
4.83 (23)
자동화된 수요 및 공급 구역의 차세대. 모든 차트에서 작동하는 새롭고 혁신적인 알고리즘. 모든 구역은 시장의 가격 움직임에 따라 동적으로 생성됩니다. 두 가지 유형의 경고 --> 1)가격이 영역에 도달할 때 2)새로운 영역이 형성될 때 당신은 더 이상 쓸모없는 지표를 얻을 수 없습니다. 입증된 결과로 완벽한 거래 전략을 얻을 수 있습니다.     새로운 기능:     가격이 공급/수요 영역에 도달하면 경고     새로운 공급/수요 구역이 생성되면 알림     푸시 알림 알림     핍의 영역 너비 레이블     기동특무부대에 한 번 더 시간이 주어집니다. 따라서 현재보다 위의 2개의 시간 프레임 대신 현재보다 높은 3개의 시간 프레임을 볼 수 있습니다.     Alerts/Zones/MTF 기능을 활성화/비활성화하는 버튼 당신이 얻는 이점:     거래에서 감정을 제거하십시오.     거래 항목을 객
GOLD Impulse with Alert
Bernhard Schweigert
4.56 (9)
이 지표는 Advanced Currency IMPULSE with ALERT  +   Currency Strength Exotics  의 2가지 제품의 슈퍼 조합입니다. 그것은 모든 시간 프레임에 대해 작동하며 8개의 주요 통화와 하나의 기호에 대한 강약의 충동을 그래픽으로 보여줍니다! 이 표시기는 금, 이국적인 쌍, 상품, 지수 또는 선물과 같은 기호에 대한 통화 강도 가속을 표시하는 데 특화되어 있습니다. 금, 은, 오일, DAX, US30, MXN, TRY, CNH 등의 진정한 통화 강도 가속(충동 또는 속도)을 표시하기 위해 9번째 줄에 모든 기호를 추가할 수 있습니다. 새로운 기본 알고리즘을 기반으로 구축되어 잠재적인 거래를 훨씬 더 쉽게 식별하고 확인할 수 있습니다. 이는 통화의 강세 또는 약세가 가속되는지 여부를 그래픽으로 표시하고 가속 속도를 측정하기 때문입니다. 자동차의 속도계처럼 생각하면 됩니다. 가속화할 때 Forex 시장에서 동일한 일이 분명히
Quantum Heiken Ashi PRO MT4
Bogdan Ion Puscasu
4.43 (7)
소개       Quantum Heiken Ashi PRO   차트 시장 동향에 대한 명확한 통찰력을 제공하도록 설계된 Heiken Ashi 양초는 노이즈를 필터링하고 잘못된 신호를 제거하는 기능으로 유명합니다. 혼란스러운 가격 변동에 작별을 고하고 더 매끄럽고 신뢰할 수 있는 차트 표현을 만나보세요. Quantum Heiken Ashi PRO를 정말 독특하게 만드는 것은 전통적인 촛대 데이터를 읽기 쉬운 색상 막대로 변환하는 혁신적인 공식입니다. 빨간색과 녹색 막대는 각각 약세와 강세 추세를 우아하게 강조하여 잠재적 진입점과 퇴장점을 매우 정확하게 파악할 수 있습니다. Quantum EA 채널:       여기를 클릭하세요 MT5 버전:       여기를 클릭하세요 이 놀라운 지표는 다음과 같은 몇 가지 주요 이점을 제공합니다. 선명도 향상: Heiken Ashi 바는 가격 변동을 완화하여 시장 추세를 보다 명확하게 나타내므로 유리한 거래 기회를 쉽게 식별할 수 있
Indicator : RealValueIndicator Description : RealValueIndicator is a powerful tool designed specifically for trading on the EURUSD pair. This indicator analyzes all EUR and USD pairs, calculates their real currency strength values, and displays them as a single realistic value to give you a head start on price. This indicator will tell you moves before they happen if you use it right. RealValueIndicator allows you to get a quick and accurate overview of the EURUSD currency pair tops and bottoms,
All in One Trade
Alexey Minkov
4.48 (27)
The All-in-One Trade Indicator (AOTI) determines daily targets for EURUSD, EURJPY, GBPUSD, USDCHF, EURGBP, EURCAD, EURAUD, AUDJPY, GBPAUD, GBPCAD, GBPCHF, GBPJPY, AUDUSD, and USDJPY. All other modules work with any trading instruments. The indicator includes various features, such as Double Channel trend direction, Price channel, MA Bands, Fibo levels, Climax Bar detection, and others. The AOTI indicator is based on several trading strategies, and created to simplify market analysis. All-in-One
Quantum Trend Sniper Indicator MT4
Bogdan Ion Puscasu
4.6 (40)
소개       Quantum Trend Sniper Indicator는   추세 반전을 식별하고 거래하는 방식을 변화시키는 획기적인 MQL5 지표입니다! 13년 이상의 거래 경험을 가진 숙련된 트레이더 팀이 개발한       Quantum Trend Sniper 표시기       매우 높은 정확도로 추세 반전을 식별하는 혁신적인 방법으로 거래 여정을 새로운 차원으로 끌어올리도록 설계되었습니다. ***Quantum Trend Sniper Indicator를 구입하면 Quantum Breakout Indicator를 무료로 받을 수 있습니다!*** Quantum Trend Sniper Indicator는 추세 반전을 식별하고 세 가지 이익실현 수준을 제안할 때 경고, 신호 화살표를 제공합니다. 초보자 거래자와 전문 거래자 모두에게 적합합니다. Quantum EA 채널:       여기를 클릭하세요 MT5 버전:       여기를 클릭하세요
PZ Trend Trading
PZ TRADING SLU
4.75 (4)
Trend Trading is an indicator designed to profit as much as possible from trends taking place in the market, by timing pullbacks and breakouts. It finds trading opportunities by analyzing what the price is doing during established trends. [ Installation Guide | Update Guide | Troubleshooting | FAQ | All Products ] Trade financial markets with confidence and efficiency Profit from established trends without getting whipsawed Recognize profitable pullbacks, breakouts and early reversals The ind
Enigmera
Ivan Stefanov
5 (2)
에니메라: 시장의 핵심 https://www.enigmera.com 소개 이 지표 및 트레이딩 시스템은 금융 시장에 대한 놀라운 접근 방식입니다. 에니메라는 프랙탈 주기를 사용하여 지지선과 저항선을 정확하게 계산합니다. 진정한 축적 단계를 보여주고 방향과 목표를 제시합니다.  추세에 있든 조정에 있든 작동하는 시스템입니다.  어떻게 작동하나요? 에니메라는 지지선/저항선, 목표선, 편차선의 세 가지 라인으로 구성됩니다. 이 시스템은 과거 데이터를 현재와 미래로 추정하는 일반적인 시장 지표와 달리 현재에 대한 완전한 그림을 제공합니다. 지지선 위에 있으면 실제 지지를 의미하고 저항선 위에 있으면 실제 저항을 의미합니다. 레벨이 깨지면 추세의 변화를 나타냅니다. 다시 그리지 않습니다. 시장이 지속적으로 진화함에 따라 에니메라는 평가 도구를 조정하여 전략을 정기적으로 수정합니다.   이를 통해 모든 시나리오를 철저히 평가할 수 있습니다. 이 시장 지표의 고유성은 분명하며 그 기
Entry Points Pro
Yury Orlov
4.7 (226)
다시 색을 칠하지 않고 거래에 진입할 수 있는 정확한 신호를 제공하는 MT4용 지표입니다. 외환, 암호화폐, 금속, 주식, 지수 등 모든 금융 자산에 적용할 수 있습니다. 매우 정확한 추정값을 제공하고 매수와 매도의 가장 좋은 시점을 알려줍니다. 하나의 시그널로 수익을 내는 지표의 예와 함께 비디오 (6:22)시청하십시오! 대부분의 거래자는 Entry Points Pro 지표의 도움으로 첫 거래 주 동안 트레이딩 결과를 개선합니다. 저희의   Telegram Group 을 구독하세요! Entry Points Pro 지표의 좋은점. 재도색이 없는 진입 신호 신호가 나타나고 확인되면(시그널 캔들이 완성된 경우) 신호는 더 이상 사라지지 않습니다. 여타 보조지표의 경우 신호를 표시한 다음 제거되기 때문에 큰 재정적 손실로 이어집니다. 오류 없는 거래 게시 알고리즘을 통해 트레이드(진입 또는 청산)를 할 이상적인 순간을 찾을 수 있으며, 이를 통해 이를 사용하는 모든 거래자의
Gann Swing Structure
Kirill Borovskii
5 (1)
This indicator is based on the mathematics of the great trader W.D. Ganna. With its help, you can easily find strong levels by analyzing swings to find the optimal entry point. The indicator works on all instruments and all timeframes. The indicator is fully manual and has control buttons. All you need to do is press the NEW button, a segment will appear, which you can place on any movement, swing or even 1 candle that you want to analyze. By placing the segment, press the OK button. A grid (th
Quantum Breakout Indicator PRO
Bogdan Ion Puscasu
4.96 (26)
소개       Quantum Breakout PRO   , 브레이크아웃 존 거래 방식을 변화시키는 획기적인 MQL5 지표! 13년 이상의 거래 경험을 가진 숙련된 트레이더 팀이 개발한   Quantum Breakout PRO는   혁신적이고 역동적인 브레이크아웃 영역 전략으로 거래 여정을 새로운 차원으로 끌어올리도록 설계되었습니다. Quantum Breakout Indicator는 5개의 이익 목표 영역이 있는 브레이크아웃 영역의 신호 화살표와 브레이크아웃 상자를 기반으로 한 손절 제안을 제공합니다. 초보자 거래자와 전문 거래자 모두에게 적합합니다. Quantum EA 채널:       여기를 클릭하세요 MT5 버전 :   여기를 클릭하세요 중요한! 구매 후 설치 매뉴얼을 받으려면 개인 메시지를 보내주십시오. 추천: 기간: M15 통화쌍: GBPJPY, EURJPY, USDJPY,NZDUSD, XAUUSD 계정 유형: 스프레드가 매우 낮은 ECN, Ra
Royal Wave Pro M4
Vahidreza Heidar Gholami
5 (3)
Royal Wave is a Trend-Power oscillator which has been programmed to locate and signal low-risk entry and exit zones. Its core algorithm statistically analyzes the market and generates trading signals for overbought, oversold and low volatile areas. By using a well-designed alerting system, this indicator makes it easier to make proper decisions regarding where to enter and where to exit trades. Features Trend-Power Algorithm Low risk Entry Zones and Exit Zones Predictions for Overbought and Over
ON Trade Optuma Astro
Abdullah Alrai
5 (4)
물론입니다. 아래는 제공해주신 텍스트의 한국어 번역입니다: MT4용 천문학 지표 소개: 귀하의 최상급 하늘 트레이딩 동반자 트레이딩 경험을 천체의 높이로 끌어올리기 준비가 되셨나요? MT4용 천문학 지표를 소개합니다. 이 혁신적인 도구는 복잡한 알고리즘의 힘을 활용하여 탁월한 천문학적 통찰과 정밀한 계산을 제공합니다. 정보의 우주를 손에 담다: 천문학적 데이터의 보물함을 드러내는 포괄적인 패널을 살펴보세요. 행성의 지오/헬리오센트릭 좌표, 태양/지구 거리, 크기, 길이, 별자리, 황도 좌표 및 적도 좌표, 심지어 수평 좌표 등 각각이 정밀하게 계산되고 아름답게 제시됩니다. 지표에 의해 생성된 수직선은 시간 값에 해당하여 트레이딩 여정에 우주적인 시각을 부여합니다. 행성 라인과 관계: 수정 가능한 스케일과 각도로 차트를 장식하는 행성 라인의 마법을 경험해보세요. 직관적인 컨트롤 패널을 통해 각 행성의 라인의 가시성을 손쉽게 전환할 수 있습니다. 쥰션이나 섹스타일, 사분각, 삼분각, 트
The indicator of a Professional Trader is an arrow indicator for predicting the direction of price movement. I have been working on this indicator since 2014. You can use this indicator as your main indicator, use its entry signals, and use it as your only indicator to find entry points. About the product: Recommended TF [H4-D1-W1]   . The indicator predicts the direction of the next candle. Fits a variety of tools; Flexibility in settings for different instruments and intervals through the
Dragon Multi Indicator MT4
Mansour Babasafary
5 (4)
3 Indicators in 1 indicator Strategy based on price action Made specifically for the best forex currency pairs Can be used in the best time frame of the market at a very reasonable price This indicator is basically 3 different indicatos . But we have combined these 3 indicators in 1 indicator so that you can use 3 indicators at the lowest price. All three strategies are based on price action. But based on different trends. Long term, medium term and short term Attributes : No repaintin
Shepherd Harmonic Pattern
Abdullah Alrai
4.68 (59)
이 지표는 수동 및 자동 방법으로 차트에 그려진 고조파 패턴을 감지합니다. 사용자 매뉴얼은 다음 링크에서 확인할 수 있습니다. 리뷰를 작성하고 문의하면 무료 버전으로 MT4에서 제품을 시도할 수 있습니다. Gartley 및 Nenstar 패턴을 감지하는 데 사용할 수 있습니다. https://www.mql5.com/en/market/product/30181 전체 MT4 버전을 구입하려면 다음에서 구입할 수 있습니다. https://www.mql5.com/en/market/product/15212 참고 사항 지표에는 제어 패널이 있으며 모든 (차트 및 시간대) 설정을 저장합니다. 차트에서 더 많은 공간을 확보하려면 최소화할 수 있으며, 다른 분석 도구로 작업하는 것이 선호되는 경우 모든 지표 데이터를 숨기려면 닫기 버튼을 누를 수 있습니다. 이 지표를 사용하고 설정을 변경하면 이동 평균 또는 볼린저 밴드와 같은 지표를 추가하면 자동으로 템플릿을 저장하고 필요할 때 언제든지 로드할 수
Introduction to Fractal Pattern Scanner Fractal Indicator refers to the technical indicator that makes use of the fractal geometry found in the financial market. Fractal Pattern Scanner is the advanced Fractal Indicator that brings the latest trading technology after the extensive research and development work in the fractal geometry in the financial market. The most important feature in Fractal Pattern Scanner is the ability to measure the turning point probability as well as the trend probabi
ECM Channel MT4
Paulo Rocha
5 (1)
ECM Elite Channel is a volatility-based indicator, developed with a specific time algorithm, which consists of finding possible corrections in the market. This indicator shows two outer lines, an inner line (retracement line) and an arrow sign, where the channel theory is to help identify overbought and oversold conditions in the market. The market price will generally fall between the boundaries of the channel. If prices touch or move outside the channel, it's a trading opportunity. The
필터:
리뷰 없음
리뷰 답변