Brilliant Harmonic Patterns
- 지표
- Mohamed Sabry
- 버전: 1.1
- 업데이트됨: 1 12월 2021
- 활성화: 5
This indicator is meant for Harmonic Traders, it helps them in identifying the formed patterns by analyzing the market past data, looking for Harmonic Patterns.
The Patterns that this indicator can detect are:
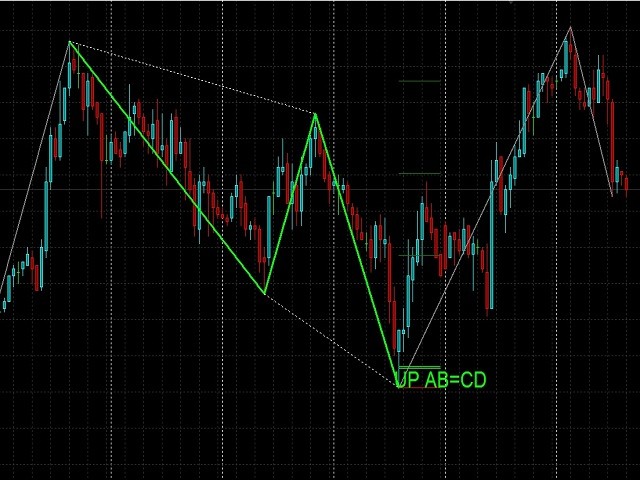
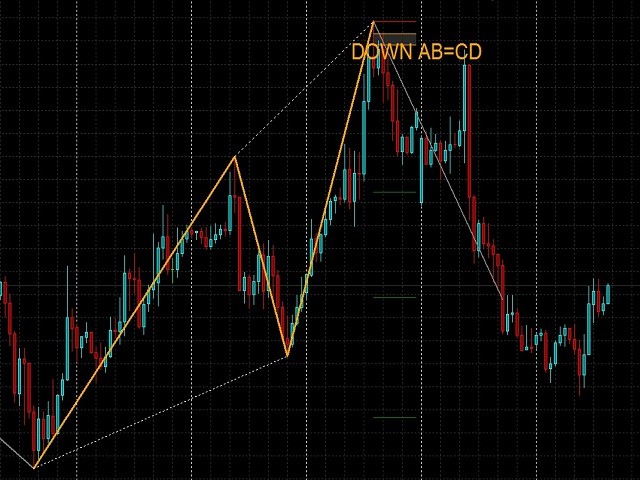
- AB=CD
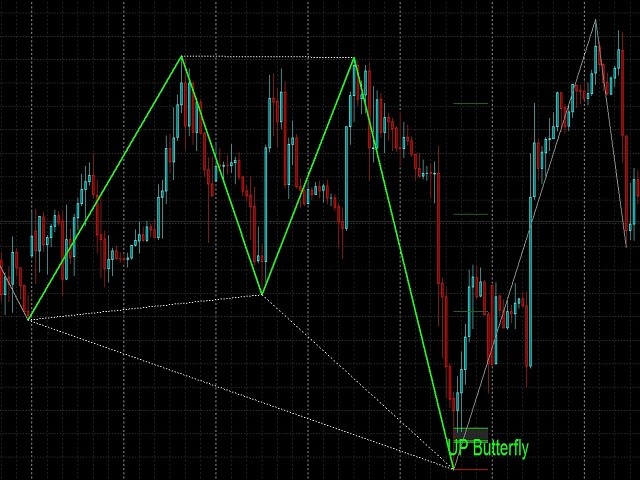
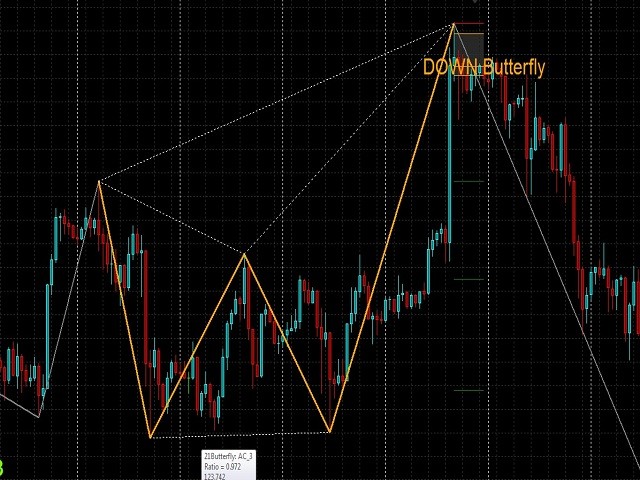
- Butterfly
- Gartely
- Crab
- Bat
The indicator shows the following:
- The completed pattern, with the critical zone highlighted in Gray box
- The suggested 3 take profit levels (in green)
- The Suggested Stop Loss level (in Red)
The formed pattern ratios can be checked by hovering the mouse on the dotted lines.
The indicator does not perform or give Buying or selling signals, it only shows the formed pattern and the predict price direction, and user can use any other indicator for Enter/Exit a trade.
- Patterns that indicates an upward price movement is indicated into green (Lime color)
- Patterns that indicates a downward price movement is indicated into Orange (Orange Color)