• 미리보기
  • 리뷰
  • 코멘트

Cobra Levels

코브라 레벨

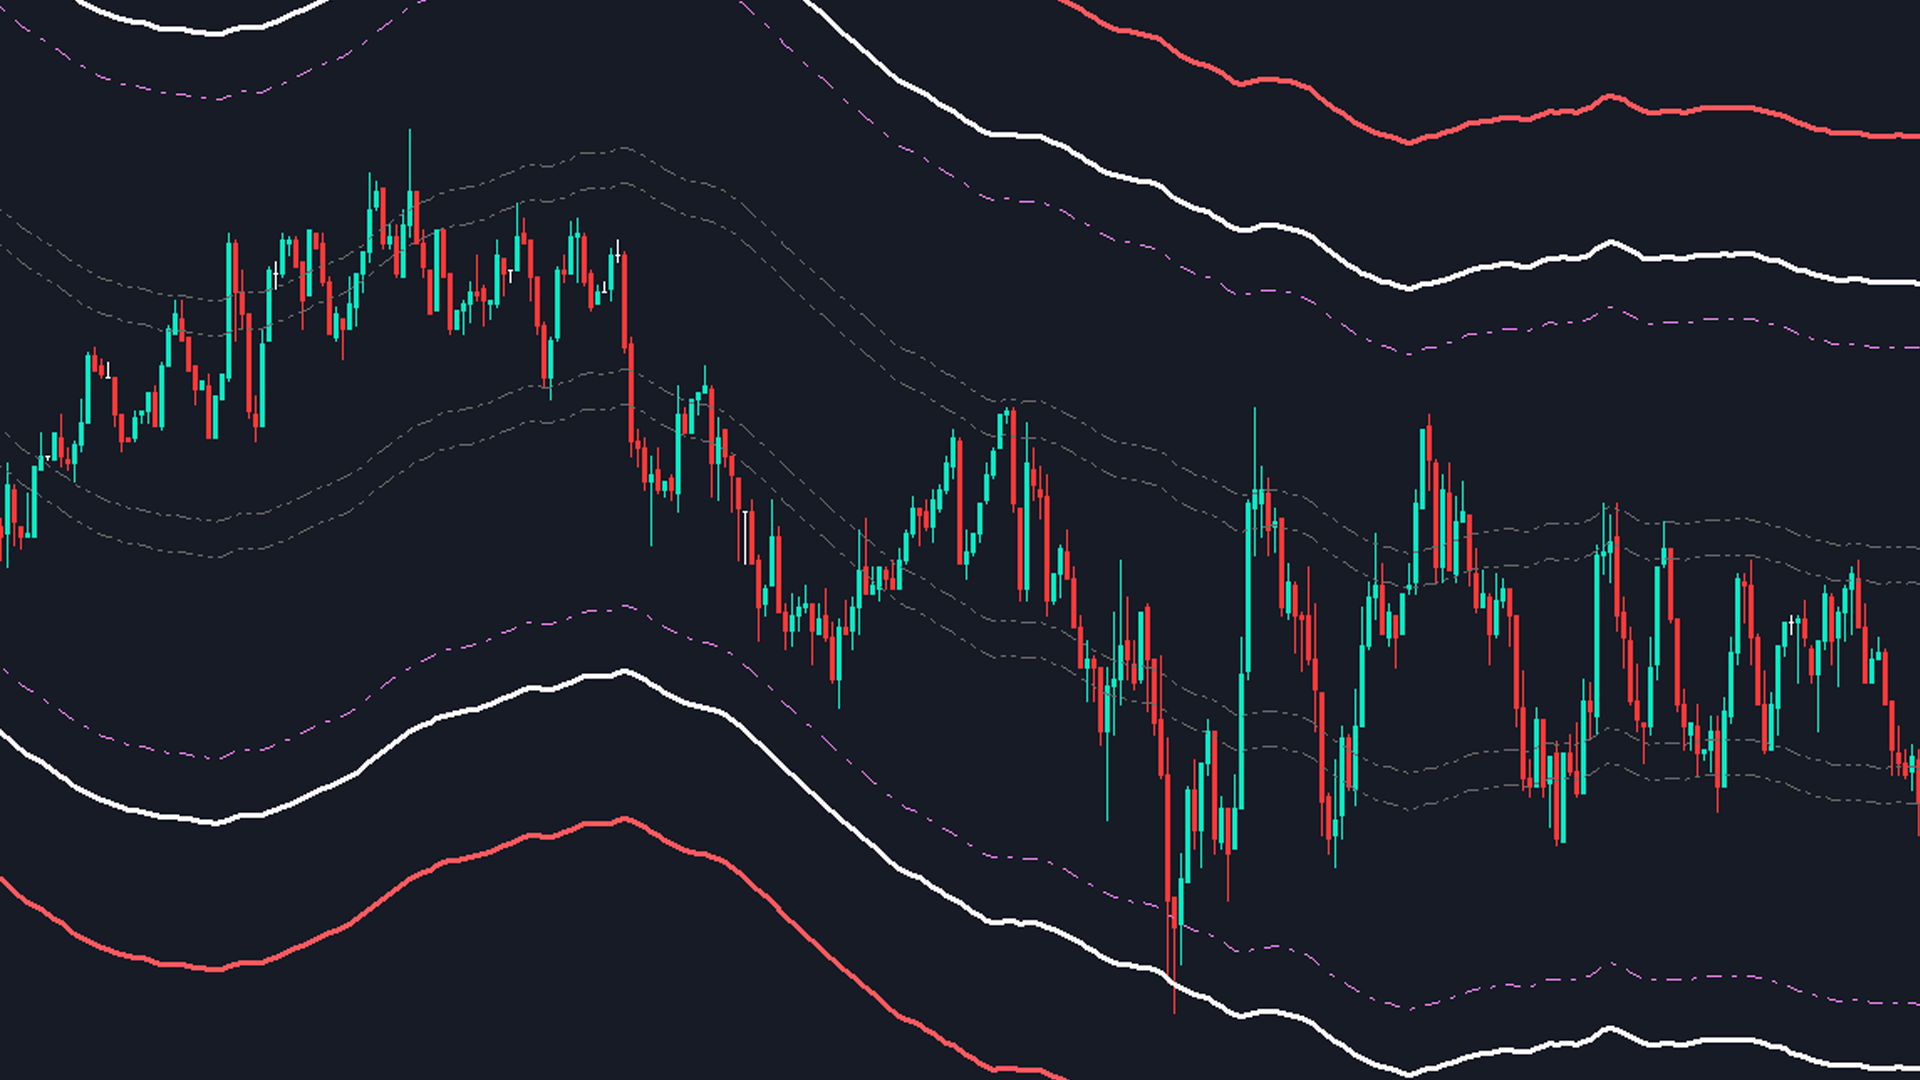
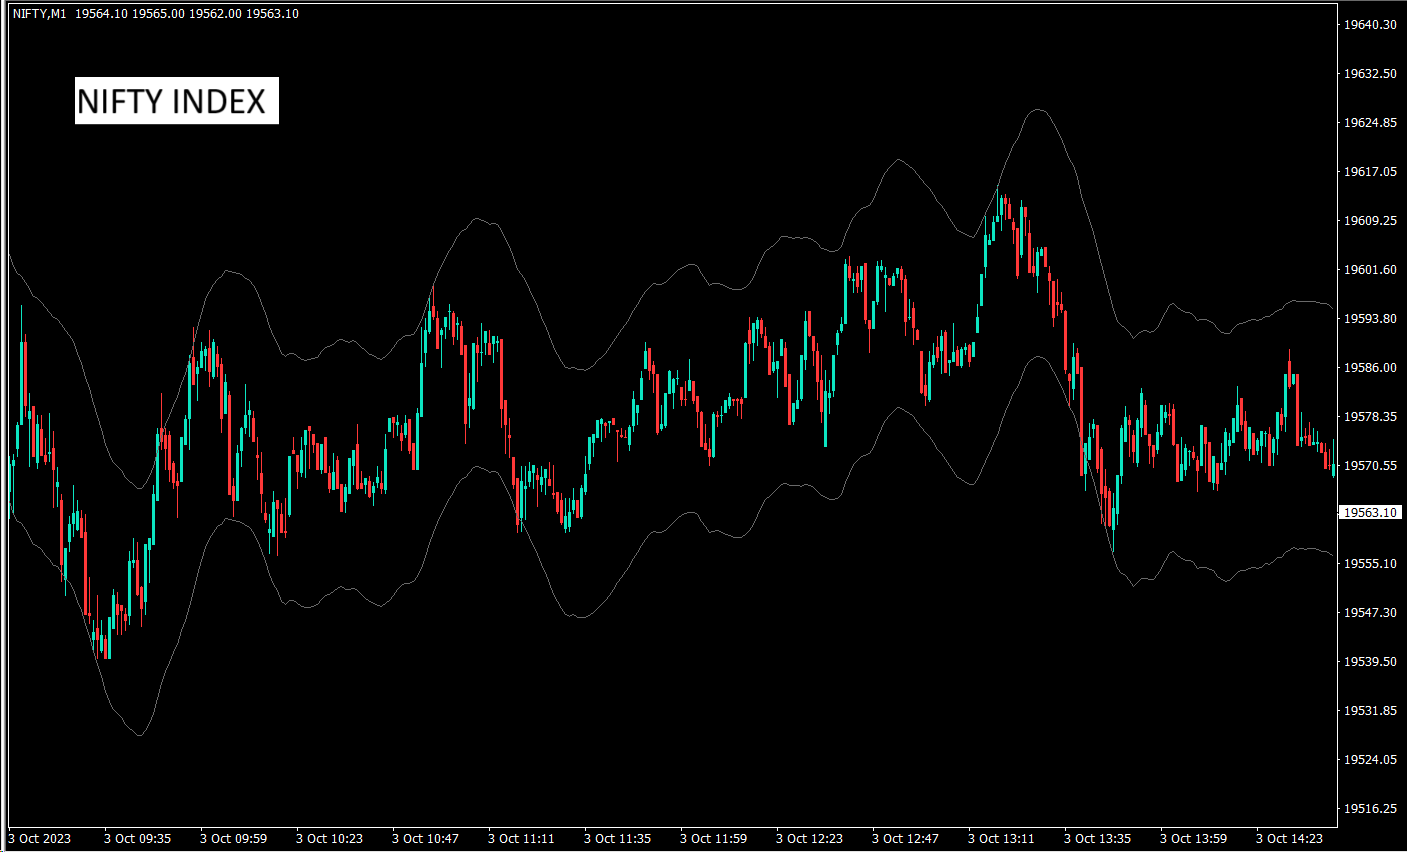
이는 외환, 암호화폐, 상품, Nifty 및 Banknifty를 포함한 범용 시장에서 작동하는 두 가지 주파수 모드를 갖춘 6가지 레벨 세트입니다. 금융상품에 대한 최고의 연구를 거쳐 출판되었습니다.

상위 레벨은 U1~U5, 하위 레벨은 D1~D5라고 합니다.
시장은 정상 상태에서 U3 또는 D3까지 내부 채널을 구동하거나 변동성 상태에서 외부 채널 U4~U5 또는 D4~D5를 구동할 수 있습니다. 가격이 U3 U4 U5 또는 D3 D4 D5에 도달하면 반전 가능성이 매우 높으며 거래자는 진입을 확인하기 위해 캔들이 닫힐 때까지 기다려야 하며 유효한 위험 관리를 통해 거래할 수 있습니다.


이 지표는 지표 설정의 사용자 정의 옵션을 통해 레벨을 이동할 수 있는 기능을 제공합니다. 사용자는 + 또는 - 포인트를 추가하여 레벨을 맞춤 설정할 수 있습니다.

1. 그들은 M1, M3, M5, M15, H1 및 H4 기간에만 작업하고 있습니다.
2. 장중, 스윙 및 위치 거래 방법에 적합합니다.
3. 다른 지표와 비교하여 연구를 기반으로 최고의 과매수 및 과매도 전환점을 찾는 데 도움
4. 동적 수준: 수준 값은 매분마다 변경되지만 가격이 어떤 조건에서든 이러한 수준에 도달하는 기준을 통과하면 주기가 추적되고 반전되는 것을 볼 수 있습니다.
5. 경고 광고 푸시 알림 포함


거래 전략에 관한 더 많은 정보를 원하시면 DM을 통해 저에게 연락하실 수 있습니다.
추천 제품
EMAGapCtrend
Eadvisors Software Inc.
O Robô Trader EMAGap faz operações de curto prazo no timeframe 1min buscando as pequenas variações do mercado no instrumento: Mini-índice(B3), utiliza nova tecnologia de trade, os resultados no intraday são íncríveis.    Versão exclusiva para os instrumentos WIN$ e IND$ (Mini-índice B3).  Estratégia utilizada: média móvel e volatilidade. Lote Inicial: Versão Mini-índice, a partir de 1 lote. Versão Bra50, a partir de 0.05 Mini-Lotes. StopLoss e Take Profit Ajustáveis. Gerenciamento de risco:
Setup Double 7s
Luigi Nunes Labigalini
Entry and exit signals from the Double 7's Strategy by Larry Connors in his book "Short Term Trading Strategies That Work". Larry claims this strategy predicted the market's direction over 80% of the time since 1995. Picking up the gains and being exposed in the market less than 25% of the time. Good for swing trading on Daily charts of SPY, Nasdaq, China's FXI, Brazil's EWZ and the majority of the equity ETFs and World Indices. How does it work? The indicator activates the buy signal when
WAPV Box Effort x Result
Eduardo Da Costa Custodio Santos
MT5에 대한 WA_PV_BOX_EFFORT X 결과 WAPV 상자 노력 x 결과 표시기는 패키지 표시기 그룹(Wyckoff Academy Wave Market)의 일부입니다. MT5용 WAPV Box Effort x Result Indicator는 가격과 거래량을 읽는 데 도움이 됩니다. 그 판독은 노력 x 결과의 식별을 돕는 것으로 구성됩니다. 그래프에 의해 생성된 파동. 상자가 녹색일 때 MT5에 대한 WAPV 상자 노력 x 결과 표시기는 거래량이 수요에 유리하고 상자가 빨간색일 때를 의미합니다. 물량은 공급에 유리하다. 상자가 클수록 가격에 대한 부피의 변위가 커집니다. 가격의 상승파동이 Box의 크기에 비례하지 않는다면, 노력 x 결과. 매우 시각적인 방법으로 우리는 볼륨과 가격 사이의 이러한 차이를 식별할 수 있습니다. MT5용 WAPV Box 노력 x 결과 표시기를 사용하면 표시기를 0축 아래에 배치하여 시각화를 개선할 수도 있습니다. 틱 볼륨 및 실제 볼륨으로 시장에서
Coppock Curve
Abraao Moreira
Fundamentação teórica Rate of Change - taxa de mudança (ROC) O ROC é um oscilador que flutua acima e abaixo de uma linha de zero, medindo a variação percentual de preços ao longo de determinado período. O ROC de 20 períodos mede a variação percentual de preços ao longo de 20 períodos, quanto maior a diferença entre o preço atual e o de 20 períodos atrás, maior o valor do ROC. Quando o indicador está acima de zero, a variação percentual é positiva indicando tendência bullish, se o indicador está
FREE
Limitless MT5
Dmitriy Kashevich
Limitless MT5 is a universal indicator suitable for every beginner and experienced trader. works on all currency pairs, cryptocurrencies, raw stocks Limitless MT5 - already configured and does not require additional configuration And now the main thing Why Limitless MT5? 1 complete lack of redrawing 2 two years of testing by the best specialists in trading 3 the accuracy of correct signals exceeds 80% 4 performed well in trading during news releases Trading rules 1 buy signa
Weis Wave with Alert MT5
Trade The Volume Waves Single Member P.C.
4.93 (15)
Rental/Lifetime Package Options and Privileges  * For optimum results the yearly or lifetime package is suggested due to live training ! Rent Monthly Six Months   Yearly/Lifetime Weis Wave with Speed with Alert+Speed Index x x x Manual  x x x Quick Set up Video x x x Blog x x x Lifetime Updates x x x Setup and Training Material x x Free Rectangle Break Alert Tool      x Discord Access Channel "The SI traders" x 2-hour live methodology training x How to trade with it:    http://
Pendiente de Precio
Cesar Juan Flores Navarro
Indicador en base a la pendiente de la linea de precio, dibuja una línea de color cuando sube a base de los precios que previamente has sido procesados o linealizados, y cuando baja la pendiente la linea linealizada toma otro color. En este caso se a considerado 6 lineas de diferentes procesos desde pendientes largas hacia las cortas, observándose que cuando coincidan las pendientes se produce un máximo o mínimo, lo que a simple vista nos permitirá hacer una COMPRA O VENTA.
The Red Devil Shorter is a fully automatic short setup based on EMAs and SMAs. Attention:  Only 9 of 10 copies left at the price of $250, after that the price goes up to $499 Signal:  https://www.mql5.com/de/signals/1826330 We use this great EA exclusively for the EUR/CHF pair, as we developed it specifically for that. The idea behind the setup is the weakness the EUR/CHF shows in the default time.  The trades are mainly closed by counter signals or the set time. In rare cases, trades are closed
Exclusive FOREX account HEDGE FuzzyLogicTrendEA is based on fuzzy logic strategy based on  analysis 5 indicators and filters. When the EA analysis all this indicators, it decides, based on its fuzzy strategy, which trade will be better: sell or buy. As additional functions, it´s possible defines spread maximum, stop loss and others. Recomm. Symbol: EURUSD, AUDUSD, GBPUSD, NZDUSD, USDCAD, AUDCAD, EURCAD e USDJPY Recomm. timeframe: H1. Backtest were done on EURUSD, H1, 01/07/2023 - 26/0
The best time to trade Using this Indicator is when the time reach exactly hour,half,45 minutes,15 minutes and sometimes 5 minutes.. This indicators is helpful to those who trade boom and crash indecies.How to read this indicator first you'll see Blue allow and Red allow all these allows used to indicate or to detect the spike which will happen so the allow happens soon before the spike happen.This indicator works properly only in boom and crash trading thing which you have to consider when
The "Super Trend Alert MT5" is an indicator designed for the MetaTrader 5 (MT5) trading platform. The specific details and functionality of this indicator may depend on the version or settings you are using. The Super Trend indicator is a popular technical analysis tool that helps identify the direction of the current market trend. It is displayed as a line on the price chart and is accompanied by alerts to notify traders of potential trend changes. To use the "Super Trend Alert MT5" indicator i
QuantumAlert RSI Navigator is a free indicator available for MT4/MT5 platforms, its work is to provide "alerts" when the market is inside "overbought and oversold" regions in the form of "buy or sell" signals. This indicator comes with many customization options mentioned in the parameter section below, user can customise these parameters as needful. Join our MQL5 group , where we share important news and updates. You are also welcome to join our private channel as well, contact me for the priva
FREE
CPT ea
Khalid Ait
5 (2)
Let me share one of my best EAs with you. CPT or Consistent P******** Trading  is a shortcut for three words. a name that explains a purpose. I cannot say it because MQ instructions doesn't allow me to, but when you use this EA, you will understand what I'm talking about. As a beginner, I passed from the phase of losing in the market to the phase of being a winner. I made parties at that time because I thought it was the top, and now everything will be easy. But... I got into a painful los
Robo davi I
Lucas Silvino Da Silva
Robô Davi I by Êxodo Capital is a professional system for traders created for the MT5 platform and optimized to work with MINI FUTURE INDEX (WIN) at B3 in BRAZIL. The system uses bias algorithms. After identifying the trend, the position is opened and the robot conducts the trade through a trailing stop that will be driven by the 13-period average. Maximum GAIN of 2200 pts. Main features Our setup has the option to use martingale, the EA has the option to customize. Presentation in the
DemsFx BC Entry EA
Desmond Ebimobowei Dogubo
1. The Expert Adviser is built with a basic, simple and stable trading strategy with i touch or Price Action Principle that is highly effective and accurate with a sniper entry system for a good money management.. 2. The expert advisor works best as from 15 minutes time frame and above.... 3. The expert advisor work with all broker all currency pair and synthetic indices... 4. Use a reasonable lot size and correct settings if you want to get the best of the Expert Advisor.. 5. With Default setti
FREE
Balance Aggression
Edson Cavalca Junior
The indicator measures the balance of aggression. The formula is as follows:   Aggression  = Purchase Volume - Sales Volume. Note : It is rec ommended to use the default configuration and VPS values. It does not work in Forex. Meet Our Products     Parameters : Numbers of days prior to the current one for calculation; Volume Divider e; Enables calculation of the current candle; Histogram Line style and; Size; Line Line style and; Size;  Follow us on our website to check the next new
Swiss VWAPsimple
Terence Gronowski
5 (4)
Swiss VWAPsimple Motivation Did not find free VWAP that works, the one that I found craseh. So I created a VWAP which calculates values only for the actual day. So computer resouces are not over stressed. What is VWAP, how is it used?  VWAP stands for Volume Weighed Average Price, it calculates the running sum of tick volume and the runnung sum of price times tickvolume. The division of these sums result in a weighed price (Sum P*V/Sum V). The calculation starts normally at midnight. The value
FREE
Easy GOLD MT5
Franck Martin
4.92 (12)
Easy Gold is the latest addition to the BotGPT family. It is surprising and very powerful. It is ideal for beginners due to its simplicity.  There is absolutely nothing to do, it's 100% automated, simply indicate the percentage of risk you want to take per trade and the EA is ready. Whatever your capital, the EA takes care of everything. Optimized on (XAUUSD).  Unleash all the power with the professional version (AGI Gold) and its connection to the neural network, available in my store. My othe
FREE
ADR ST Patterns Strategy
Vladimir Poltoratskiy
4.5 (4)
ADR ST Patterns Strategy  is a modification of the classical  ADR  indicator. This simple indicator corresponds to the parameters specified in the  ST Patterns Strategy ( https://stpatterns.com/ ) .  Structural Target Patterns represents the market consistently divided into components. No trend lines, geometric proportions of the model itself, trading volume, or open market interest are needed for the formation of  ST Patterns . They are easily recognized and built only on the basis of breaking
FREE
Trend On Close
David Ben Svaiter
TrendOnClose is a sophisticated indicator designed for Binary market investors, focusing on statistical analysis of trends and counter-trends within specific candle cycles. Each cycle is defined by the candle CLOSE price, establishing the trend direction (UP/DOWN - BULL/BEAR) for subsequent statistical analysis until the start of the next cycle. The statistical analysis operates with two configurations: ⦁ Statistical Goal as SUBSEQUENT CANDLE: The algorithm focuses on the subsequent candle withi
Bollinger Bands B
Flavio Javier Jarabeck
5 (3)
John Bollinger created this indicator in 2010 as a way to read the original indicator (Bollinger Bands) in a more "technical" way, shown as an oscillator. The typical range of the Bollinger Bands %B is 0 - 0.5 - 1.0, where "0" represents the lower band, the "0.5" the middle band, and "1" the upper band. The line on the indicator represents the Closing prices. As simple as that. SETTINGS Bollinger Bands period of analysis Standard Deviation multiplier Shift Price type to be analyzed If you
FREE
Key level wedge MT5
Presley Annais Tatenda Meck
The   Key level wedge MT5   indicator automatically draws rising wedge pattern and falling wedge pattern for you on the chart. This pattern is really good when used as a confirmation entry at key support & resistance, supply & demand and reversal zones. Advantages  The   Key level wedge MT5   block DOES NOT RE-PAINT, giving you confidence when a signal appears and also helps when looking back.  The   Key level wedge MT5   includes an on/off button on the chart to easily keep the charts cle
Bollinger Bands Percentage
Emanuel Cavalcante Amorim Filho
Bollinger Bands %  or Bollinger Bands Percentage is one of the indicators used in the Sapphire Strat Maker - EA Builder . It is calculated using the following formula: Perc = (CLOSE_PRICE - LOWER_BOLLINGER) / (UPPER_BOLLINGER - LOWER_BOLLINGER) * 100 Thus, by taking the difference between closing price to the lower band and dividing it by the difference of the upper and the lower price levels of a Bollinger Bands indicator, we can calculate this indicator. It shows how far the price is f
FREE
MIDAS Super VWAP
Flavio Javier Jarabeck
4.29 (14)
Imagine VWAP, MVWAP and MIDAS in one place... Well, you found it! Now you can track the movement of Big Players in various ways, as they in general pursue the benchmarks related to this measuring, gauging if they had good execution or poor execution on their orders. Traders and analysts use the VWAP to eliminate the noise that occurs throughout the day, so they can measure what prices buyers and sellers are really trading. VWAP gives traders insight into how a stock trades for that day and deter
FREE
Compass B3 Trader
Renato Takahashi
Compass B3 Trader é um robô especialista em trades automatizados para o iBovespa (Miniíndice WIN e Minidólar WDO), baseado na estratégia de análise de inclinação de média móvel. A partir de estabelecimento da inclinação desejada, o robô realiza as entradas de trades, seguindo takeprofit e stoploss fixos ou dinâmicos conforme análise de velas. Ainda, pode-se configura um sistema de trail de stoploss possibilitando trades completos e de grandes grandes (+ pontos). Ativos: WIN, WDO. Timeframe: M1,
Donchian Pro
Paulo Henrique Faquineli Garcia
5 (2)
The Donchian Channel Channels are among the most popular tools of technical analysis, as they visually convey to the analyst the limits within which most price movement tends to occur. Channel users know that valuable information can be obtained at any time, whether prices are in the central region of a band or close to one of the border lines. One of the best known techniques to explore these concepts is Bollinger Bands. However, John Bollinger was not the only one to research the applicatio
FREE
Wave Box Market Frenquency
Jean Jacques Huve Ribeiro
4.83 (6)
Totally linked to the result of a movement and the duration he had. Its height records how many ticks the asset walked during a given movement, its width shows us the duration that movement had. Its configuration must be in line with the Weis Wave Indicator configuration to observe the movement force and can indicate a possible accumulation or distribution of the movement;
FREE
Descubra o EA para Mini Índice, o segredo do sucesso no mercado financeiro! Desenvolvido com anos de observação cuidadosa, este EA utiliza sinais exclusivos de entrada e saída para garantir resultados impressionantes. Prepare-se para uma jornada lucrativa! Graças a dois indicadores poderosos, cuidadosamente configurados (e forneceremos as configurações exatas), este EA oferece resultados excelentes. Imagine maximizar sua taxa de acerto e o payoff, enquanto mantém um baixo drawdown. Sim, é possí
Expert Amazo
Guilherme Geovanini Fraga
EXPERT AMAZO é um Expert Advisor projetado especificamente para negociar WIN (mini índice) e WDO (mini dólar). A operação é baseada na abertura de ordens utilizando alguns indicadores como Sars parabólicos, médias móveis, Bandas de Bollinger, Fibonacci, etc., trabalhando de acordo com 3 modalidades de estratégia, o AMAZO procura prever os movimentos do mercado com operações contra ea favor da tendência.        Entre em nosso Grupo de WhatsApp para receber as melhores configurações do Expert.
이 제품의 구매자들이 또한 구매함
Professional Scalping Tool on Deriv Attention! The indicator will be sold in limited quantities!!! The previous 5 copies were sold for $250 The remaining 4 copies will be sold for $350 The next price is $500 Description: This trading indicator is designed for professional traders focused on scalping. Designed with the market in mind, it provides highly accurate spike trading signals. It works on the M1 timeframe and supports the following symbols: Boom 300 Index, Boom 500 Index, Boom 1000 I
Introducing the South African Sniper indicator created by a small group of traders with a few years trading trading the financial market profitably . This is a plug and play indicator that provides you with  BUY and SELL (SNIPER ENTRY) signals with TARGET and trail stops. The indicator Works with all MT5 trading instruments. The indicator uses previous  chart data as receipt to speculate on future market moves.
FxaccurateLS
Shiv Raj Kumawat
WHY IS OUR FXACCCURATE LS MT5 THE PROFITABLE ? PROTECT YOUR CAPITAL WITH RISK MANAGEMENT Gives entry, stop and target levels from time to time. It finds Trading opportunities by analyzing what the price is doing during established trends. POWERFUL INDICATOR FOR A RELIABLE STRATEGIES We have made these indicators with a lot of years of hard work. It is made at a very advanced level. Established trends provide dozens of trading opportunities, but most trend indicators completely ignore them!
Volume by Price MT5
Brian Collard
5 (3)
The Volume by Price Indicator for MetaTrader 5 features Volume Profile and Market Profile TPO (Time Price Opportunity). Get valuable insights out of currencies, equities and commodities data. Gain an edge trading financial markets. Volume and TPO histogram bar and line charts. Volume Footprint charts. TPO letter and block marker charts including split structures. Versatile segmentation and compositing methods. Static, dynamic and flexible ranges with relative and/or absolute visualizations. Lay
TrendMaestro5
Stefano Frisetti
note: this indicator is for METATRADER4, if you want the version for METATRADER5 this is the link:  https://www.mql5.com/it/market/product/108106 TRENDMAESTRO ver 2.4 TRENDMAESTRO recognizes a new TREND in the bud, he never makes mistakes. The certainty of identifying a new TREND is priceless. DESCRIPTION TRENDMAESTRO identifies a new TREND in the bud, this indicator examines the volatility, volumes and momentum to identify the moment in which there is an explosion of one or more of these data a
PZ Harmonacci Patterns MT5
PZ TRADING SLU
3.25 (4)
This is arguably the most complete harmonic price formation auto-recognition indicator you can find for the MetaTrader Platform. It detects 19 different patterns, takes fibonacci projections as seriously as you do, displays the Potential Reversal Zone (PRZ) and finds suitable stop-loss and take-profit levels. [ Installation Guide | Update Guide | Troubleshooting | FAQ | All Products ] It detects 19 different harmonic price formations It plots primary, derived and complementary Fibonacci p
NakaSide
Ricardo De Andrade Nakano
NakaSide을 소개합니다 - 귀하의 궁극적인 시장 기회 지표! 수익성 있는 거래 기회를 놓치기 지쳤나요? 거래를 다음 단계로 이끌 준비가 되었나요? 더 이상 찾을 필요가 없습니다. NakaSide가 여기 있어 거래 방식을 혁신하겠습니다! NakaSide는 일반적인 지표가 아니라 복잡한 금융 시장을 자신 있고 정확하게 탐색하는 비밀 무기입니다. 최첨단 알고리즘과 첨단 기술을 통해 NakaSide는 상승 및 하락 시장에서의 추세 변화를 감지하고 수익성 있는 기회를 발견하는 데 사용됩니다. NakaSide가 상승 트렌드로의 변화를 감지하면 화려한 녹색 달러 기호로 가능한 매수 기회를 표시합니다. 반대로, 트렌드가 반전되면 눈에 띄는 빨간색 달러 기호가 나타나 가능한 매도 기회를 나타냅니다. 하지만 NakaSide가 정말 빛을 발하는 곳은 여기입니다. 그것은 단지 추세를 식별하는 것에 그치지 않습니다. 다른 사람들이 어려움을 겪을 수 있는 측면 시장에서 NakaSide가
ON Trade Gann Squares MT5
Abdullah Alrai
5 (1)
간 스퀘어 지표는 W.D. 간이 쓴 "시장 예측을 위한 수학적 공식" 기사에 기반한 강력한 시장 분석 도구입니다. 이 도구는 수학적 개념과 간 이론을 사용하여 정확한 시장 분석을 수행합니다. 144, 90, 52의 제곱과 9의 제곱을 사용합니다. 또한 의 9의 제곱근 및 해당 제곱의 채널 및 스타 패턴과의 관련성을 통합합니다. 사용자 메뉴얼 및 적용: 이 지표를 사용하기 전에 사용자 메뉴얼을 읽고 질문이 있을 경우 문의하시기 바랍니다. 전체 메뉴얼은 웹사이트에서 제공됩니다. MT5의 전체 버전을 구매하거나 MT4의 무료 버전을 테스트할 수 있습니다. 두 버전 모두 링크에서 확인하실 수 있습니다. 주요 기능 및 기능: 간 스퀘어 지표는 정확한 결정을 위해 기하학적 개념과 간 이론을 활용하는 시장 분석을 위한 포괄적인 도구 집합을 제공합니다. 주요 기능은 다음과 같습니다. 9의 제곱 분석:   이 지표는 9의 제곱에 대한 수평 선, 스타 패턴, 그리드 및 간 팬을 그릴 수 있습니다. 간
Bill Williams Advanced
Siarhei Vashchylka
5 (5)
Bill Williams Advanced is designed for automatic chart analysis using Bill Williams' "Profitunity" system. The indicator analyzes four timeframes at once. Manual (Be sure to read before purchasing) Advantages 1. Automatically analyzes the chart using the "Profitunity" system of Bill Williams. The found signals are placed in a table in the corner of the screen. 2. Equipped with a trend filter based on the Alligator indicator. Most of the system signals are recommended to be used only accordi
Good day! I present to you a trading technical indicator for Deriv broker synthetic indices. This indicator ONLY works with the following indices: Boom 300 Index Boom 500 Index Boom 1000 Index Crash 300 Index Crash 500 Index Crash 1000 Index The indicator was created to give signals to open medium-term trades in the direction of Spikes. But you can open trades in the opposite direction to Spikes, at your own risk. Trade only on M1. Other TFs do not guarantee the correct operation of the indic
Eng Gold
Ely Alkrar Xshkaky
ENG-GOLD Scalper It is an auxiliary indicator that identifies potential targets and determines the place of entry with a stop loss that works on Heiken Ashi candles  The green lines are usually the targets, the red lines are the stop loss, and the yellow lines are the entry location.  This file is recognized on small and medium frames, usually less than the watch frame I highly recommend using XAUUSD US100 US30 USOIL 
IVISTscalp5
Vadym Zhukovskyi
5 (3)
당신에게 소개하는 iVISTscalp5 지표는 독특하면서도 거래 작업에서 효과적입니다. 이 지표는 시간 데이터를 기반으로 하며 금융 시장의 많은 경험과 깊은 분석의 결과입니다. iVISTscalp5 지표는 수동 거래에 뛰어난 도구입니다. 편리성, 간단함 및 시각화 - 모든 복잡성은 숨겨져 있습니다. 우리는 iVISTscalp5 지표의 설정과 사용을 최대한 단순화했습니다. 이 지표는 MT5 터미널에서 가지고 있는 모든 금융 상품에 적합합니다. 시간 기준으로 작동하는 시간은 4am에서 8pm (UTC+3)입니다. iVISTscalp5 지표 메뉴 (스크린샷 1 참조): History - 표시할 주간 수 계산 dT_min - 시간 설정 간격 선택 (분) TFline - 수평 볼륨 생성 (타임프레임) BARSline - 수평 볼륨 생성 (바 수) TFtrend1 - 매일 채널 생성 (타임프레임) BARStrend1 - 매일 채널 생성 (바 수) TFtrend2 - 주간 채널 생성 (타임프레임
PZ Swing Trading MT5
PZ TRADING SLU
5 (4)
Swing Trading is the first indicator designed to detect swings in the direction of the trend and possible reversal swings. It uses the baseline swing trading approach, widely described in trading literature. The indicator studies several price and time vectors to track the aggregate trend direction and detects situations in which the market is oversold or overbought and ready to correct. [ Installation Guide | Update Guide | Troubleshooting | FAQ | All Products ] Profit for market swings with
SMCpro
Arief
5 (1)
SMCpro MT5  Original Price  $440   ---  Currently Price  40% OFF  ( for unlimited use ) Hello World! Introducing.. SMCpro tool and Indicator for  MetaTrader 5 , a cutting-edge feature designed to revolutionize your trading experience. With innovative ICT Smart Money Concept, you gain unparalleled insight into market dynamics, empowering you to make informed trading decisions like never before. Built on the foundation of advanced algorithms and real-time data analysis, SMCpro tool and Indicat
VTrende Pro
Andrii Diachenko
5 (1)
VTrende Pro - MTF indicator for trend trading with a display panel for MT5 *** Videos can be translated into any language using subtitles (video language - Russian) Although the signals of the VTrende Pro indicator can be used as signals of a full-fledged trading system, it is recommended to use them in conjunction with the Bill Williams TS. VTrende Pro is an extended version of the VTrende indicator. Difference between Pro version and VTrende: - Time zones - Signal V - signal 1-2 waves
RAD Real Acummulation and Distribution
Jose Alejandro Jacome Jimenez
RAD CRITICAL LEVES RAD indicator tracks “Relevant Volume” in real time, identifying accumulation and distribution processes, projecting them in the chart as SUPPORT or RESISTANCE zones. Natural   support   and resistance levels are generated by Volume Accumulation and Distribution processes. As these processes evolve, levels at which the relevant volume in the market place is positioned, become difficult areas to cross upwards or downwards. By using this information, traders can identify very s
PZ Divergence Trading MT5
PZ TRADING SLU
3.75 (4)
Tricky to find and scarce in frequency, divergences are one of the most reliable trading scenarios. This indicator finds and scans for regular and hidden divergences automatically using your favourite oscillator. [ Installation Guide | Update Guide | Troubleshooting | FAQ | All Products ] Easy to trade Finds regular and hidden divergences Supports many well known oscillators Implements trading signals based on breakouts Displays suitable stop-loss and take-profit levels Configurable oscilla
Introduction to X3 Chart Pattern Scanner X3 Cherart Pattern Scanner is the non-repainting and non-lagging indicator detecting X3 chart patterns including Harmonic pattern, Elliott Wave pattern, X3 patterns, and Japanese Candlestick patterns. Historical patterns match with signal patterns. Hence, you can readily develop the solid trading strategy in your chart. More importantly, this superb pattern scanner can detect the optimal pattern of its kind. In addition, you can switch on and off individu
Ershov 38 parrots MT5
Aleksei Ershov
5 (1)
The indicator is designed to close positions on the market in time. For example: to take profits ahead of schedule if the price has not reached TakeProfit, and the market is turning around. The indicator analyzes the momentum, not the trend. He does not give any information about the trend. The indicator is well suited for finding divergence. The Ershov 38 Parrots indicator dynamically adjusts to the market and detects price movement impulses of medium and high amplitude. It almost does not rea
Shepherd Gann Squares MT5
Abdullah Alrai
5 (11)
이 지표는 W.D. Gann이 작성한 "시장 예측을 위한 수학 공식" 기사를 기반으로 하는 시장 분석 방법으로 9의 제곱과 144의 제곱 방법에 따라 다릅니다. 사용자 매뉴얼: Add Your review And contact us to get it 다음에서 전체 MT4 버전을 구입할 수 있습니다. https://www.mql5.com/en/market/product/15316 MT4에서 무료로 테스트할 수 있습니다. https://www.mql5.com/en/market/product/15320?source=Site +Profile+Seller#!tab=reviews 이 제품은 레벨/스타/그리드/간 팬/으로 9의 정사각형을 그릴 수 있습니다. Gann Squares: 52/90/144도 그릴 것입니다. Chart 에 이동 가능한 Free Gann Star 를 직접 그립니다 . 그것은 또한 Gann 다이아몬드를 그릴 것입니다.
Elliot Waves Analyzer Pro
Viktor Weidenthal
3.25 (4)
Elliot Waves Analyzer Pro calculates Elliot Waves to Help Identify Trend direction and Entry Levels. Mainly for Swing Trading Strategies. Usually one would open a Position in trend direction for Wave 3 or a Correction for Wave C . This Indicator draws Target Levels for the current and next wave. Most important Rules for Elliot Wave Analysis are verified by the Indicator.  The Pro version analyzes Multiple Timeframes and shows the Subwaves and Target-Levels.   For an Overview  " Elliot Waves Anal
PZ Day Trading MT5
PZ TRADING SLU
2.83 (6)
This indicator detects price reversals in a zig-zag fashion, using only price action analysis and a donchian channel. It has been specifically designed for short-term trading, without repainting or backpainting at all. It is a fantastic tool for shrewd traders aiming to increase the timing of their operations. [ Installation Guide | Update Guide | Troubleshooting | FAQ | All Products ] Amazingly easy to trade It provides value on every timeframe It displays suitable SL and TP levels It impl
PZ Trend Trading MT5
PZ TRADING SLU
3.67 (3)
Trend Trading is an indicator designed to profit as much as possible from trends taking place in the market, by timing pullbacks and breakouts. It finds trading opportunities by analyzing what the price is doing during established trends. [ Installation Guide | Update Guide | Troubleshooting | FAQ | All Products ] Trade financial markets with confidence and efficiency Profit from established trends without getting whipsawed Recognize profitable pullbacks, breakouts and early reversals The ind
Elliott Wave Trend MT5
Young Ho Seo
4 (3)
Elliott Wave Trend was designed for the scientific wave counting. This tool focuses to get rid of the vagueness of the classic Elliott Wave Counting using the guideline from the template and pattern approach. In doing so, firstly Elliott Wave Trend offers the template for your wave counting. Secondly, it offers Wave Structural Score to assist to identify accurate wave formation. It offers both impulse wave Structural Score and corrective wave Structure Score. Structural Score is the rating to sh
"Piranha" - an autonomous trading system that determines overbought and oversold levels on the chart. Red and blue zones represent overbought and oversold levels respectively. Entry points are marked with arrows: a downward arrow in the red zone for "sell" and an upward arrow in the blue zone for "buy". The Take profit level is indicated by the green moving average. Key features: Adjusting the Take profit level as the green moving average changes position. Averaging ability when a new market e
Harmonic ABCD Monitor MT5
Mihail Matkovskij
5 (2)
Multi-currency, multi-timeframe, harmonic pattern indicator AB = CD. Supports sending push notifications about signals to a mobile device, messages on e-mail, as well as messages using alerts on all available currency pairs and timeframes. This indicator was based on the indicator Harmonic ABCD Universal. Version for MetaTrader 5:  https://www.mql5.com/en/market/product/44972 . See also: Harmonic ABCD Universal for MetaTrader 4 . Using modern software development methods has made the indicator a
AI Binary Sniper
Angelo Capoferri
바이너리 옵션에 대한 가능한 호출 및 입력 항목을 생성하는 인공 지능을 기반으로 하는 표시기입니다. 이 지표는 3가지 다른 전략으로 작동합니다. 1) 거래량을 읽어 가격이 반전되어야 할 때 신호를 보냅니다. 2) 가격과 거래량의 차이를 통해 추세가 지속되거나 반전되어야 할 때 신호를 보냅니다. 3) 가격과 거래량의 수렴을 통해 추세가 계속되어야 할 시점에 신호를 보냅니다. 이 지표는 모든 시간 범위에서 작동하지만 3분 또는 5분 마감일에 가장 좋은 결과를 얻습니다(제도적 공격이 낮은 시간 범위에서 나타나기 때문입니다). 가장 좋은 시간은 유동성이 더 큰 시간, 즉 7 GMT부터 18 GMT까지입니다. 지표는 70% 이상의 정확한 신호를 생성하지만 가격을 조작하거나 서로를 거부하는 기관 간의 싸움에 부딪혀 일련의 잘못된 신호가 생성될 수 있으므로 적절한 자금 관리를 사용하는 것이 좋습니다(예: Masaniello )
How to use Pair Trading Station Pair Trading Station is recommended for H1 time frame and you can use it for any currency pairs. To generate buy and sell signal, follow few steps below to apply Pair Trading Station to your MetaTrader terminal. When you load Pair Trading Station on your chart, Pair Trading station will assess available historical data in your MetaTrader platforms for each currency pair. On your chart, the amount of historical data available will be displayed for each currency pai
PZ Mean Reversion MT5
PZ TRADING SLU
3 (2)
평균 회귀 거래에 대한 전문적이고 정량적인 접근 방식을 구현하는 고유한 지표입니다. 이는 가격이 예측 가능하고 측정 가능한 방식으로 평균으로 전환되고 반환된다는 사실을 이용하여 비정량적 거래 전략을 훨씬 능가하는 명확한 진입 및 퇴장 규칙을 허용합니다. [ Installation Guide | Update Guide | Troubleshooting | FAQ | All Products ] 명확한 거래 신호 놀랍도록 쉬운 거래 사용자 정의 가능한 색상 및 크기 성능 통계 구현 대부분의 거래 전략을 능가합니다. 적절한 SL 및 TP 레벨을 표시합니다. 이메일/음향/시각 알림을 구현합니다. 작동 원리 이 지표는 더 높은 기간에서 완전히 사용자 정의 가능한 이동 평균 주변의 표준 편차를 측정하고 추세 추종 접근 방식을 사용하여 정확하게 거래를 찾습니다. 거래는 현재 차트의 가격 동작을 살펴보고 선택한 더 높은 기간에서 계산된 평균 가격대로 가격이 돌아오면 닫힙니다. 코딩 방식 때문
Girassol Sunflower MT5 Indicator
Saullo De Oliveira Pacheco
This is the famous Sunflower indicator for Metatrader5. This indicator marks possible tops and bottoms on price charts. The indicator identifies tops and bottoms in the asset's price history, keep in mind that the current sunflower of the last candle repaints, as it is not possible to identify a top until the market reverses and it is also not possible to identify a bottom without the market stop falling and start rising. If you are looking for a professional programmer for Metatrader5, please
제작자의 제품 더 보기
이 라이브러리를 사용하면 EA를 사용하여 거래를 관리할 수 있으며 설명에 언급된 스크립트 코드와 전체 프로세스를 보여주는 비디오의 데모 예제를 사용하여 모든 EA에 통합하기가 매우 쉽습니다. 이 제품은 API를 통해 거래 작업을 허용하며 차트를 포함하지 않습니다. 사용자는 암호화폐 차트를 제공하고 바이낸스에 주문을 보내는 브로커의 차트를 사용할 수 있습니다. - 단방향 및 헤지 모드 지원 - Place Limit, SL Limit, Take Profit Limit 주문 - 플레이스 마켓, SL-마켓, TP-마켓 주문 - 지정가 주문 수정 - 주문 취소 - 쿼리 주문 - 레버리지, 마진 변경 - 위치 정보 얻기 그리고 더... 스크립트 문서 Binance에 주문을 보내는 MQL5에서 간단한 EA를 코딩하는 초보자를 위한 1시간 프로그래밍 튜토리얼 https://www.youtube.com/watch?v=d_r4j2V
Crypto Charting
Rajesh Kumar Nait
5 (3)
MT5용 암호화폐 차트. 특징 : 1. Websocket(wss)을 통한 라이브 OHLC 차트 2. API의 막대 기록 업데이트 3. MT5를 다시 시작할 때 차트의 자동 업데이트 기록으로 막대에 누락된 데이터가 없는지 확인하고 기본 차트처럼 항상 최신 상태로 유지됩니다. 4. API를 통한 예약 내역 업데이트 : 밀리초 동안 인터넷 연결이 끊길 경우 websocket은 스트리밍 프로토콜이므로 bar ohlc 값이 정확하지 않을 수 있습니다. 오류 가능성을 1~2% 줄이기 위해 API에서 예약 기록 업데이트 기능을 추가했습니다. 이 기능은 유틸리티 설정에서 설정할 수 있는 데이터를 몇 분마다 계속 업데이트합니다. 분석 오류가 없도록 OHLC 값이 항상 올바른지 확인합니다. 5. 유틸리티는 M1에서 MN1까지 모든 기간 지원을 지원합니다. 6. 사용 가능한 데이터 : 시가 상한가 하한가 실제 거래량 및 틱 거래량 7. 암호화폐 데이터에 대한
이 라이브러리를 사용하면 EA를 사용하여 거래를 관리할 수 있으며 설명에 언급된 스크립트 코드와 전체 프로세스를 보여주는 비디오의 데모 예제를 사용하여 모든 EA에 통합하기가 매우 쉽습니다. - Place Limit, SL Limit, Take Profit Limit 주문 - 플레이스 마켓, SL-마켓, TP-마켓 주문 - 지정가 주문 수정 - 주문 취소 - 쿼리 주문 - 레버리지, 마진 변경 - 위치 정보 얻기 그리고 더... MT5에 바이낸스 차트가 없는 경우를 제외하고 암호화폐 차트 대여는 선택 사항입니다. 스크립트 데모를 보려면 여기를 클릭하세요. 트레이딩 패널과 거래하고 싶다면 이 제품에 관심이 있으실 것입니다. 이 제품은 Crypto Charting의 애드온입니다. 이 라이브러리를 사용하면 EA를 사용하여 거래를 관리할 수 있으며 설명에 언급된 스크립트 코드와 전체 프로세스를 보여주는 비디오의 데모 예제를
Double Top and Double Bottom
Rajesh Kumar Nait
5 (4)
This indicator finds Double Top and Double bottom Example : What is Double Top When price establishes a new high and then falls, then reverse to the same candle area of High then its considered a valid double top and vice versa for double bottom. 1. It plots and high and low on visible chart if ChartChange is set to true else it searches on new bar opening 2. If there is double top and double bottom found in visible chart window then it plots a line 3. It has options to customize text color, te
FREE
Break of Structure
Rajesh Kumar Nait
시장 구조는 더 높은 기간의 돌파가 트레이더에게 추세를 정리하는 데 도움이 될 수 있는 구조입니다. 1. 이 표시기는 지그재그를 마지막 2개의 구조(지그재그의 이전 최고점 및 최저점)에만 끌어당기고 구조가 파손된 경우에만 새로운 지그재그 막대가 형성됩니다. 2. 구조의 파손시 터미널 및 푸시 알림을 제공합니다. 3. [ 및 ] 키에서 지그재그의 확장 깊이를 증가 및 감소시켜 스윙을 조정합니다. 4. Line AB BC 및 CD의 색상 변경 5. 많은 차트에 추가하고 여러 기호에 대한 경고 받기 Break of Structure Multi ExtDepth Breakout Multi Symbol Scanner를 찾고 있다면 이 제품을 사용할 수 있습니다. Multi Symbol Multi ExtDepth ZigZag Breakout Scanner
다중 통화 이전 캔들 또는 이전 막대 스캐너를 사용하면 지표 설정에서 선택한 사용자 정의 기간으로 다중 기호 차트를 스캔할 수 있습니다. 제품 기준 : https://www.mql5.com/en/market/product/110229 전날 고가, 전주 고가, 전월 고저 또는 사용자 정의 기간에 대한 다중 기호를 스캔하는 데 사용할 수 있습니다. 이전 4시간 차트 고저 노이즈를 필터링하고 가격이 고점 또는 저점에 도달할 때 방향 알림을 제공합니다. 전략은 간단합니다. 전날, 주 또는 월 최고가에 도달하면 5분과 같은 더 짧은 시간 내에 가격이 거부되는 것으로 보입니다. 다양한 경고 유형을 선택하는 옵션이 있습니다. 밀리초 단위로 스캔할 빈도를 선택하고 설정할 수 있습니다. 1000은 시장 시계의 모든 기호를 매초마다 검색한다는 의미입니다. 제품 특징 1. 터미널 알림 2. 이메일 알림 3. 푸시 알림
완벽한 초 차트 표시기를 사용하면 분초를 초로 변환할 수 있습니다. 1. 정확한 시간에 바를 100% 닫으려면 초 수를 선택하세요. 2. 이것은 요율 기반 데이터이며 진드기를 사용할 수 없는 경우에도 작동합니다. 3. 외부 DLL이 필요하지 않으며 VPS에서 원활하게 작동합니다. 4. 빠르고 최적화된 코드 5. BInance, Kucoin 및 선물 차트를 몇 초 단위로 쉽게 변환할 수 있는 기타 모든 거래소와 같은 암호화폐 쌍을 지원합니다. 6. 금, 외환쌍 등 모든 유형의 기호를 지원합니다. 7. 기호 및 요율을 삭제하는 옵션. 완벽한 초 차트 표시기를 사용하면 분초를 초로 변환할 수 있습니다. 1. 정확한 시간에 바를 100% 닫으려면 초 수를 선택하세요. 2. 이것은 요율 기반 데이터이며 진드기를 사용할 수 없는 경우에도 작동합니다. 3. 외부 DLL이 필요하지 않으며 VPS에서 원활하게 작동합니다. 4. 빠르고 최적화
Crypto Ticks and Depth
Rajesh Kumar Nait
5 (1)
암호화폐 라이브 틱 데이터 입찰 및 EA의 장부 깊이 사용 가능한 거래소 : 1. 바이낸스 현물(활성 차트 창에서 주문장 깊이 지원) 및 선물(여러 주문장 깊이 지원) 2. Kucoin 현물 및 선물, 활성 차트 창에서 주문장 깊이 지원 3. Bybit 선물 및 인버스 선물 틱 데이터 마지막 매수호가 다가오는 거래소 : OKX, MEXC 등.. 특징 : 1. 입찰 및 매도 정보가 포함된 실시간 틱 데이터 2. 최적의 입찰 요청 및 주문 수량, 사용자는 설정에서 깊이를 활성화/비활성화할 수 있습니다. 3. 로드 이력 : Open High Low Close Volume 및 Tick Volume 데이터 업데이트 4. 자동 업데이트 내역 : MT5 단말기 재시작 시 누락된 막대 채우기 5. 암호화폐 데이터에 대한 Strategy Tester를 사용하여 전문가 자문가와 함께 암호화폐 기호 틱에 대한 모든 전략을 백테스트할 수 있습니다
Real Spinning Top Candlestick
Rajesh Kumar Nait
5 (2)
실제 팽이 표시기 해머나 도지나 널 캔들스틱과 다른 팽이의 진정한 의미인 균형잡힌 몸체와 심지 높이 비율로 차트에서 정확한 팽이를 감지합니다. 이 지표는 차트에서 발견된 팽이의 수에 날개 아이콘을 표시합니다. 설정에는 다음이 포함됩니다. Number of Bars : 막대 수에 대한 검색 조정 아이콘 색상 : 아이콘 색상 변경 아이콘 코드 : 아이콘에 대한 wingdings 코드 변경 실제 팽이 표시기 해머나 도지나 널 캔들스틱과 다른 팽이의 진정한 의미인 균형잡힌 몸체와 심지 높이 비율로 차트에서 정확한 팽이를 감지합니다. 이 지표는 차트에서 발견된 팽이의 수에 날개 아이콘을 표시합니다. 설정에는 다음이 포함됩니다. Number of Bars : 막대 수에 대한 검색 조정 아이콘 색상 : 아이콘 색상 변경 아이콘 코드 : 아이콘에 대한 wingdings 코드 변경
FREE
MT5용 바이낸스 거래 도구 1. 이 제품에는 웹소켓의 라이브 차트, 과거 차트, MT5 터미널 재시작 시 자동 업데이트를 통해 수동 개입 없이 원활하게 실행되도록 하여 Binance를 원활하게 거래할 수 있습니다. 현물 및 선물 거래, 라이브 차트 및 과거 데이터 이용 가능 사용하는 방법 : 1. 이 유틸리티의 입력 필드에 API 키와 비밀을 추가해야 합니다. API를 생성할 때 선물 거래를 활성화해야 합니다. 3. 도구 > 옵션 > URL 탭에서 웹 요청 허용에 언급된 대로 바이낸스 API URL을 추가하고 웹 요청 허용 확인란을 선택해야 합니다. 바이낸스 스팟 URL 1: api.binance.com URL 2: stream.binance.com 바이낸스 선물 URL 1: fapi.binance.com URL 2: fstream.binance.com 데모 거래를 테스트하려면 MT5의 Utiltiy 및 Webrequest에 이 정보
다중 기호 차트의 아무 곳이나 더블 클릭하여 가격 알림을 설정하고 터미널 알림 또는 푸시 알림에서 알림을 받습니다. 1. 차트에 EA 유틸리티 추가 2. <- 왼쪽 또는 -> 오른쪽 화살표 키로 차트 탐색 3. 차트의 아무 곳이나 두 번 클릭하면 선이 추가됩니다. 이 선을 드래그하여 원하는 가격을 설정하면 짜잔, 알림이 설정됩니다! 가격이 라인에 도달하면 유틸리티 설정에 따라 터미널 또는 푸시 알림으로 알려줍니다. 이 경고는 터미널을 다시 시작해도 계속 작동합니다. 4. 여러 종목을 계속 탐색하고 알림을 받고자 하는 많은 차트에 라인을 계속 추가합니다. 5. 새로 시작하려는 경우 D를 눌러 설정한 모든 알림을 삭제합니다. 6. 수평선을 삭제하면 경고가 비활성화됩니다. -- 다중 기호 차트의 아무 곳이나 더블 클릭하여 가격 알림을 설정하고 터미널 알림 또는 푸시 알림에서 알림을 받습니다. 1. 차트에 EA 유틸리티 추가 2. <- 왼쪽 또는
이 표시기는 거래자의 요구 사항에 따라 차트를 더 깔끔하게 만들기 위해 활성화/비활성화할 수 있는 최대 6개 레벨을 표시합니다. 이 6단계는 높음과 낮음의 2세트로 구성되어 있습니다. 각 세트에 대해 다른 시간대를 선택할 수 있습니다. 가격이 일일, 주간 또는 월간 고가에 도달할 때 일반적으로 5분과 같은 더 작은 시간 프레임에서 거부를 나타내는 것으로 간주되므로 이전 고가 반전 전략을 기반으로 합니다. 특징 : - 단일 차트에서 최대 6개의 시간대 고저를 추적합니다. - 이 수준, 메일, 푸시 또는 터미널 알림에 대한 알림을 설정합니다. 가격이 이러한 수준에 도달하면 즉시 알림을 받게 됩니다. - 선 스타일, 너비, 색상 등을 포함한 레벨 스타일 사용자 정의 - Shift : 2일차 또는 3일차의 High Low를 추적하거나 조사하고 싶으십니까? 두 번째 막대의 높음 낮음에 대해 2로, 세 번째 막대의 높음 낮음에 대해 3으로 이동을 설정할 수 있습니
이 표시기를 차트에 추가하고 ZigZag의 ExtDepth 설정을 설정합니다. 가격이 추세선 상단, 하단 또는 중간 채널에 닿으면 즉시 알림을 제공합니다. 특징 : -상단, 하단 또는 중간 라인에 대한 알림 활성화/비활성화 - 몇 초 만에 경고 후 일시 중지 추가 - 차트의 버튼으로 트렌드 채널 일시 중지 또는 일시 중지 해제 - 입력 필드에 포인트를 추가하여 조기 경고를 추가합니다. 예를 들어 ETH 가격이 2900.25이고 여기에서 숫자 25는 "포인트"입니다. 따라서 입력 필드에 포인트로 25를 추가하고 트렌드 채널의 하단 라인 값이 2900.25인 경우 2900.50에서 조기 경보를 받을 것입니다(설정에서 25포인트 추가) - 방향성 터치 활성화/비활성화, 자세한 정보는 스크린샷 참조, 가격 터치는 하단에서 저항을, 상단에서 지원하면 방향 터치가 고려됩니다. 이 기능은 여러 경고로 인한 노이즈를 방지하기 위해 추가되었습니다. 1분~5분 차트에서 거래하는 경우
Crypto to MT5
Rajesh Kumar Nait
크립토닷컴에서 MT5로 Crypto.com websocket에서 Metatrader 5로 라이브 촛대 스트리밍 OHCLV(시가 고가 저가 종가) 실시간 요금 데이터입니다.  트레이더, 분 차트에서 OHLC 데이터가 정확하지 않으면 기술 차트 연구에서 잘못된 분석을 제공할 수 있습니다. 이 제품은 수동 분석에 도움이 될 수 있는 실시간으로 정확한 데이터를 제공하도록 보장합니다. 내 프로필 https://www.mql5.com/en/users/rajeshnait/seller에서 내 다른 암호화 제품을 확인할 수 있습니다. 1. OHLCV 데이터 2. 여러 심볼 지원 및 생성 3. 도구 > 옵션 > URL 탭에서 웹 요청 허용에서 언급한 대로 바이낸스 웹 소켓 및 API URL을 추가하고 웹 요청 허용 확인란을 선택해야 합니다. - 웹소켓 URL : stream.crypto.com - API URL : api.crypto.com 4. 차트는 GMT+0
Cobra Pivot Points는 DEMO를 다운로드하여 직접 백테스트할 수 있는 가장 최적화된 피벗 포인트를 표시하는 지표입니다. 1. 두 가지 최고의 피벗 모드 선택: Cobra Pivots 또는 Camrilla Pivots 2. D1에 국한되지 않고 원하는 시간대를 사용할 수 있습니다. 3. Shift 매개변수를 사용하면 전일 고저 종가 값으로 플레이할 수 있습니다. 1 = 이전 막대, 2 = 이전 막대 앞의 막대 등. 이 매개변수는 피벗에 대한 연구 및 개발에 도움이 됩니다. 4. 레벨 터치 시 경고, 이메일 또는 푸시 알림을 한 번 누릅니다. 레벨을 터치하면 피벗 레벨이 완화된 것으로 간주되어 다시 경고하지 않습니다. 알림을 다시 받으려면 기간을 변경하여 알림을 재설정해야 합니다. 5. 선 색상, 선 스타일, 선 너비, 텍스트 색상 및 글꼴을 완전히 사용자 정의합니다. Cobra Pivots는 LZone(스캘핑을 위해 매우 가까운 레벨)
피벗 포인트 다중 기호 스캐너는 Floor, Woodie, Camarilla, Demark 또는 Fibonacci 피벗 포인트에 대해 마켓워치에서 사용할 수 있는 모든 기호를 스캔합니다. 원하는 기간을 선택하여 피벗 포인트를 계산하고 가격이 이러한 지지 및 저항 수준에 도달하면 알림을 받을 수 있습니다. 시각적 피벗 포인트의 경우 이 제품에 관심이 있을 수 있습니다: https://www.mql5.com/en/market/product/110231 다양한 경고 유형을 선택하는 옵션이 있습니다. 밀리초 단위로 스캔할 빈도를 선택하고 설정할 수 있습니다. 1000은 시장 시계의 모든 기호를 매초마다 검색한다는 의미입니다. 제품 특징 1. 터미널 알림 2. 이메일 알림 3. 푸시 알림
대칭 삼각형, 비대칭 삼각형 또는 직각 삼각형과 같은 삼각형 패턴, 상승 쐐기 또는 하강 쐐기와 같은 쐐기 패턴, 확장 패턴 및 추세 채널에 대한 패턴 탐색기 이 지표는 과거의 패턴과 현재의 패턴을 탐색하며, 수동으로 추세선이나 삼각형을 그려 시간을 절약하고 차트에 가장 좋은 패턴을 그리는 자동 분석에 사용하려는 사람들에게 가장 적합한 지표입니다. 특징 : - 최적의 패턴을 조정하고 찾기 위해 즉시 ZigZag 확장 깊이를 변경하는 패널 - 패턴을 지그재그의 이전 막대로 다시 이동하여 과거에 발생한 일을 탐색하고 추세선이 존중되는지 여부를 탐색하고 가격 동작을 이해할 수 있습니다. 이 지표를 사용하여 이전의 과거 패턴을 탐색하고 분석하고 학습하여 마스터 전략을 도출합니다. - 전환 버튼에서 추세 채널 또는 추세선에서 쐐기 또는 삼각형 모드로 즉시 전환 - 패턴이 변경되지 않도록 일시 중지하고 경고에 대한 가격 터치를 계속 확인합니다. - 레벨 터치에 대
이 표시기는 거래자의 요구 사항에 따라 차트를 더 깔끔하게 만들기 위해 활성화/비활성화할 수 있는 최대 6개 레벨을 표시합니다. 이 6단계는 높음과 낮음의 2세트로 구성되어 있습니다. 각 세트에 대해 다른 시간대를 선택할 수 있습니다. 가격이 일일, 주간 또는 월간 고가에 도달할 때 일반적으로 5분과 같은 더 작은 시간 프레임에서 거부를 나타내는 것으로 간주되므로 이전 고가 반전 전략을 기반으로 합니다. 특징 : - 단일 차트에서 최대 6개의 시간대 고저를 추적합니다. - 이 수준, 메일, 푸시 또는 터미널 알림에 대한 알림을 설정합니다. 가격이 이러한 수준에 도달하면 즉시 알림을 받게 됩니다. - 선 스타일, 너비, 색상 등을 포함한 레벨 스타일 사용자 정의 - Shift : 2일차 또는 3일차의 High Low를 추적하거나 조사하고 싶으십니까? 두 번째 막대의 높음 낮음에 대해 2로, 세 번째 막대의 높음 낮음에 대해 3으로 이동을 설정할 수 있습니
Kraken Crypto Exchange 선물 내역 업데이트 패널 특징 : 1. 설정을 기반으로 심볼을 생성하고 심볼에 대한 Kraken API에서 사용할 수 있는 업데이트 내역을 완전히 업데이트합니다. 이 패널은 시가 고가 저 종가 데이터로 Kraken 선물 기호의 내역을 업데이트하고 내역 업데이트가 완료되면 메시지도 인쇄합니다. 이것은 라이브 데이터가 아닙니다.   3. 도구 > 옵션 > URL 탭에서 웹 요청 허용에 언급된 대로 Kraken API URL을 추가하고 웹 요청 허용 확인란을 선택해야 합니다. - API URL : futures.kraken.com 4. 더 적은 메모리와 CPU를 사용합니다. 5. 터미널 재시작 시 누락된 데이터 자동 업데이트! 터미널을 열 때마다 최신 데이터가 준비되어 있습니다! 6. DLL 호출이 이루어지지 않음
5 EMA Scalping Strategy Multi Symbol Scanner This EA utility will scan all symbols which are selected in marketwatch and alert when such condition is formed in chart when Candle low is above EMA 5 for Sell alert and Candle high is lower from EMA5 so you can be ready before selling or buying for scalping purpose on 5min chart For more details watch attached video Logic : When a candle closes above 5 EMA in 5 mins chart, Wait for its low to break and Sell when low is broken by wick, Your SL sh
Multi Symbol ZigZag Breakout Scanner는 마켓워치에서 선택한 모든 기호를 스캔합니다. 가격이 해당 수준에 도달하려고 할 때 이중 상단, 이중 하단 또는 모든 피보나치 확장 수준을 쉽게 찾는 데 도움이 됩니다. Timeframe 및 Zigzag의 여러 Extdepths(최대 3개)를 선택할 수 있습니다. 권장 ZigZag는 21,34 및 55로 모든 유형의 지그재그 및 필터 노이즈를 포함합니다. 터미널 경고 또는 푸시 알림 또는 둘 다를 수신하도록 설정할 수 있습니다. Multi Symbol ZigZag Breakout Scanner는 마켓워치에서 선택한 모든 기호를 스캔합니다. 가격이 해당 수준에 도달하려고 할 때 이중 상단, 이중 하단 또는 모든 피보나치 확장 수준을 쉽게 찾는 데 도움이 됩니다. Timeframe 및 Zigzag의 여러 Extdepths(최대 3개)를 선택할 수 있습니다. 권장 ZigZag는 21,34 및
Fibo Musang FMBCR CB1 Breakout-Scanner MT5 Fibo Musang CB1 oder Candle Break 1 ist eine Strategie, die sehr gut mit Gold XAUUSD und anderen Forex-Symbolen funktioniert. Dieser Scanner hilft Ihnen dabei, Währungen mit mehreren Symbolen sehr schnell zu scannen und Benachrichtigungen über den Ausbruch von FMCBR CB1 zu erhalten Bitte sehen Sie sich das Video für weitere Details an, da es vollständig nach den Vorlieben des Händlers anpassbar ist: 1. Sie können den Zeitrahmen und den Balken
다중 기호 차트의 아무 곳이나 더블 클릭하여 가격 알림을 설정하고 터미널 알림 또는 푸시 알림에서 알림을 받습니다. 1. 차트에 EA 유틸리티 추가 2. <- 왼쪽 또는 -> 오른쪽 화살표 키로 차트 탐색 3. 차트의 아무 곳이나 두 번 클릭하면 선이 추가됩니다. 이 선을 드래그하여 원하는 가격을 설정하면 짜잔, 알림이 설정됩니다! 가격이 라인에 도달하면 유틸리티 설정에 따라 터미널 또는 푸시 알림으로 알려줍니다. 이 경고는 터미널을 다시 시작해도 계속 작동합니다. 4. 여러 종목을 계속 탐색하고 알림을 받고자 하는 많은 차트에 라인을 계속 추가합니다. 5. 새로 시작하려는 경우 D를 눌러 설정한 모든 알림을 삭제합니다. 6. 수평선을 삭제하면 경고가 비활성화됩니다. -- 다중 기호 차트의 아무 곳이나 더블 클릭하여 가격 알림을 설정하고 터미널 알림 또는 푸시 알림에서 알림을 받습니다. 1. 차트에 EA 유틸리티 추가 2. <- 왼쪽 또는
Control Candle is the candlestick which holds multiple inside bars and are in control until its high low range is broken by close of any candlestick. When control candle is broken, price may act on these control candle as support and resistance. This indicator create rectangles on chart which will help you find control candles fast. Control candle indicator box is customizable by color, style, width and other options in indicator settings.
Fibonacci Font Label
Rajesh Kumar Nait
이 표시기를 사용하면 큰 글꼴 크기로 피보나치 레벨 레이블을 표시할 수 있습니다. . 최대 25개의 피보나치 레벨을 지원합니다. - 피보나치를 그리자마자 선택한 색상과 글꼴로 큰 글꼴 크기의 입력 매개변수로 추가한 레벨이 표시됩니다. 맞춤형 옵션: 1. Fibo 텍스트 글꼴 2. Fibo 텍스트 크기 3. Fibo 텍스트 색상 3. 각 레벨에 설명 추가 4. 앵커 및 각도와 같은 기타 옵션 이 표시기를 사용하면 큰 글꼴 크기로 피보나치 레벨 레이블을 표시할 수 있습니다. . 최대 20개의 피보나치 레벨을 지원합니다. - 피보나치를 그리자마자 선택한 색상과 글꼴로 큰 글꼴 크기의 입력 매개변수로 추가한 레벨이 표시됩니다. 맞춤형 옵션: 1. Fibo 텍스트 글꼴 2. Fibo 텍스트 크기 3. Fibo 텍스트 색상 3. 각 레벨에 설명 추가 4. 앵커 및 각도와 같은 기타 옵션
이 지표는 동일한 차트에서 추적하려는 다른 기간 캔들스틱을 효율적으로 추적합니다. 1. 동일한 차트에 막대를 로드하려면 더 높은 기간을 선택하세요. 2. 촛대의 색상과 스타일을 사용자 정의하세요 3. 캔들스틱을 그릴 막대 수를 선택하세요. 4. 심지 및 몸체와 함께 더 높은 기간의 전체 양초를 추적합니다. 5. 차트 전환을 원하지 않는 사람들을 위해 쉽고 편리합니다. 이 지표는 동일한 차트에서 추적하려는 다른 기간 캔들스틱을 효율적으로 추적합니다. 1. 동일한 차트에 막대를 로드하려면 더 높은 기간을 선택하세요. 2. 촛대의 색상과 스타일을 사용자 정의하세요 3. 캔들스틱을 그릴 막대 수를 선택하세요. 4. 심지 및 몸체와 함께 더 높은 기간의 전체 양초를 추적합니다. 5. 차트 전환을 원하지 않는 사람들을 위해 쉽고 편리합니다.
Cobra Pivot Points는 DEMO를 다운로드하여 직접 백테스트할 수 있는 가장 최적화된 피벗 포인트를 표시하는 지표입니다. 1. 두 가지 최고의 피벗 모드 선택: Cobra Pivots 또는 Camrilla Pivots 2. D1에 국한되지 않고 원하는 시간대를 사용할 수 있습니다. 3. Shift 매개변수를 사용하면 전일 고저 종가 값으로 플레이할 수 있습니다. 1 = 이전 막대, 2 = 이전 막대 앞의 막대 등. 이 매개변수는 피벗에 대한 연구 및 개발에 도움이 됩니다. 4. 레벨 터치 시 경고, 이메일 또는 푸시 알림을 한 번 누릅니다. 레벨을 터치하면 피벗 레벨이 완화된 것으로 간주되어 다시 경고하지 않습니다. 알림을 다시 받으려면 기간을 변경하여 알림을 재설정해야 합니다. 5. 선 색상, 선 스타일, 선 너비, 텍스트 색상 및 글꼴을 완전히 사용자 정의합니다. Cobra Pivots는 LZone(스캘핑을 위해 매우 가까운 레벨)
다중 통화 이전 캔들 또는 이전 막대 스캐너를 사용하면 지표 설정에서 선택한 사용자 정의 기간으로 다중 기호 차트를 스캔할 수 있습니다. 제품 기준 : https://www.mql5.com/en/market/product/78657 전날 고가, 전주 고가, 전월 고저 또는 사용자 정의 기간에 대한 다중 기호를 스캔하는 데 사용할 수 있습니다. 이전 4시간 차트 고저 노이즈를 필터링하고 가격이 고점 또는 저점에 도달할 때 방향 알림을 제공합니다. 전략은 간단합니다. 전날, 주 또는 월 최고가에 도달하면 5분과 같은 더 짧은 시간 내에 가격이 거부되는 것으로 보입니다. 다양한 경고 유형을 선택하는 옵션이 있습니다. 밀리초 단위로 스캔할 빈도를 선택하고 설정할 수 있습니다. 1000은 시장 시계의 모든 기호를 매초마다 검색한다는 의미입니다. 제품 특징 1. 터미널 알림 2. 이메일 알림 3. 푸시 알림
피벗 포인트 다중 기호 스캐너는 Floor, Woodie, Camarilla, Demark 또는 Fibonacci 피벗 포인트에 대해 마켓워치에서 사용할 수 있는 모든 기호를 스캔합니다. 원하는 기간을 선택하여 피벗 포인트를 계산하고 가격이 이러한 지지 및 저항 수준에 도달하면 알림을 받을 수 있습니다. 시각적 피벗 포인트의 경우 이 제품에 관심이 있을 수 있습니다: https://www.mql5.com/en/market/product/110072 다양한 경고 유형을 선택하는 옵션이 있습니다. 밀리초 단위로 스캔할 빈도를 선택하고 설정할 수 있습니다. 1000은 시장 시계의 모든 기호를 매초마다 검색한다는 의미입니다. 제품 특징 1. 터미널 알림 2. 이메일 알림 3. 푸시 알림
필터:
리뷰 없음
리뷰 답변