DYJ PeakAndTroughSQWMA
- 지표
- Daying Cao
- 버전: 3.1
- 업데이트됨: 23 9월 2023
- 활성화: 5
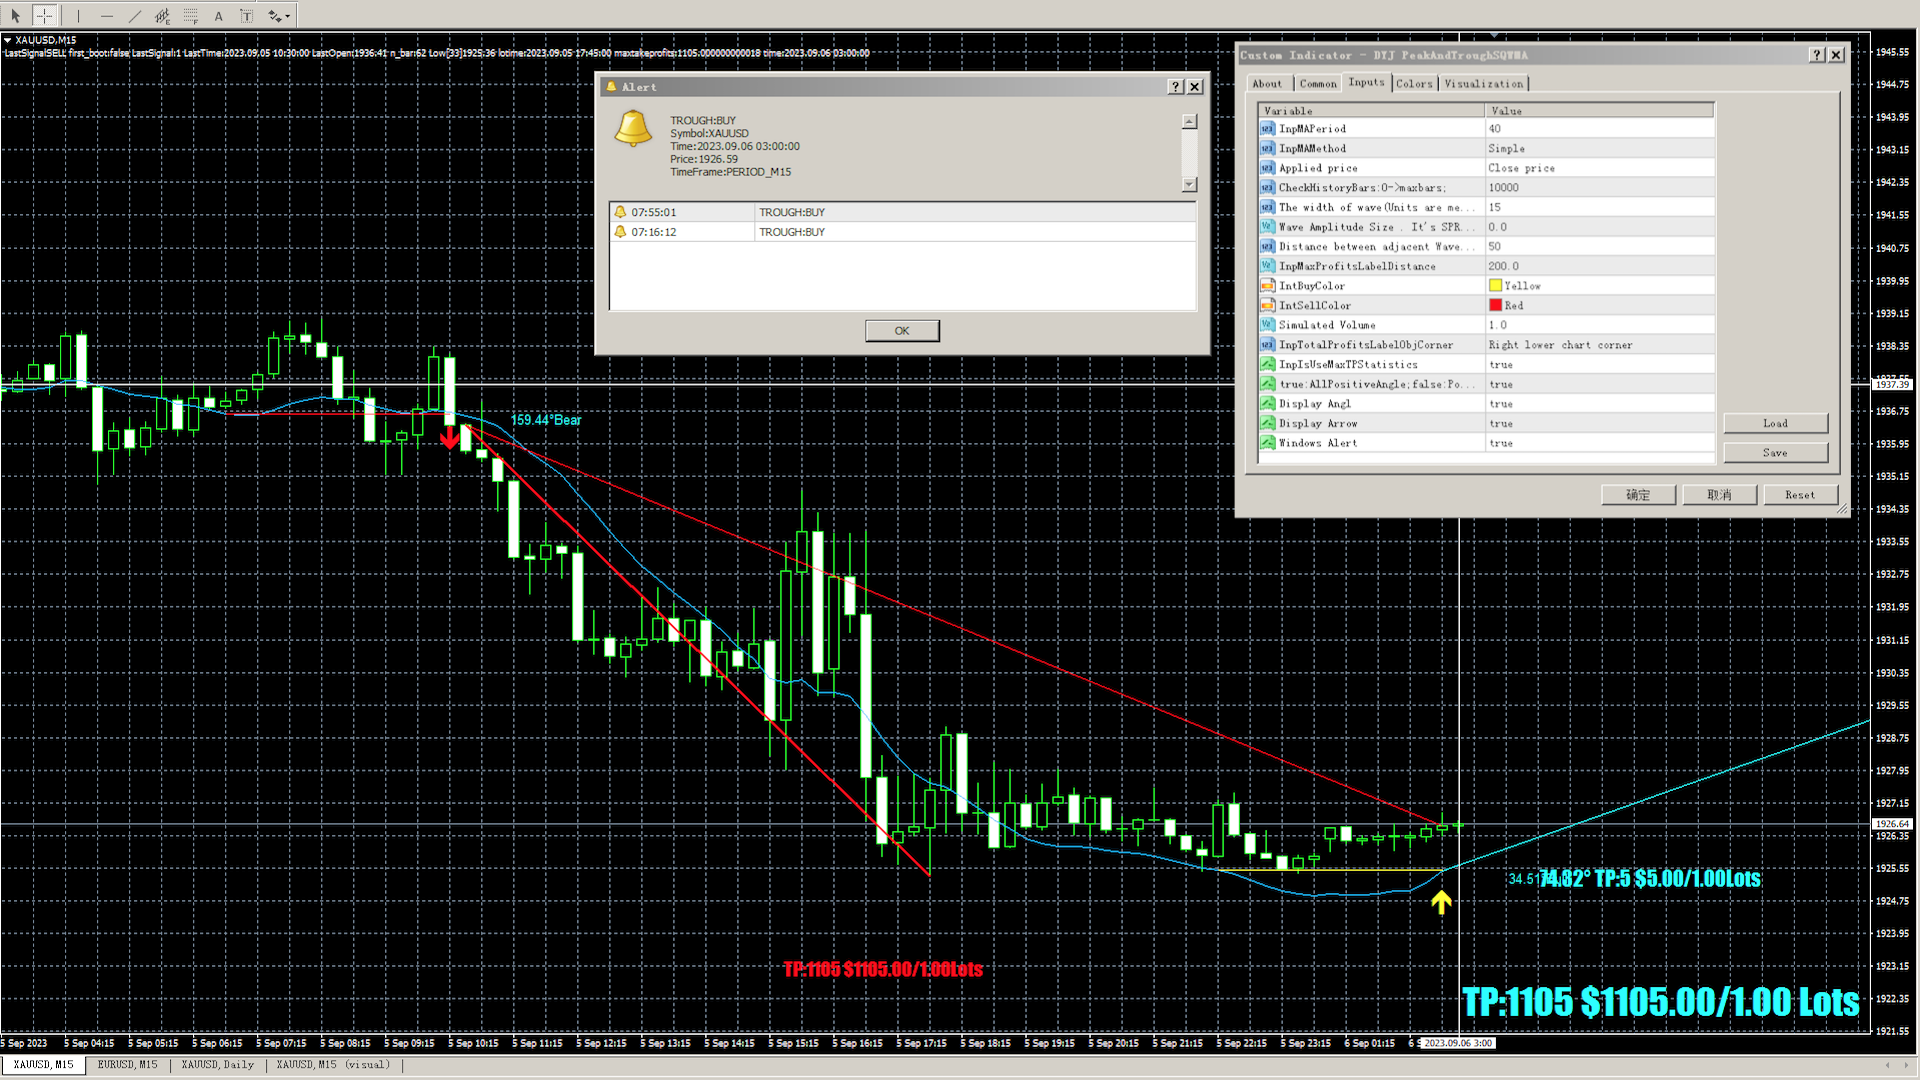
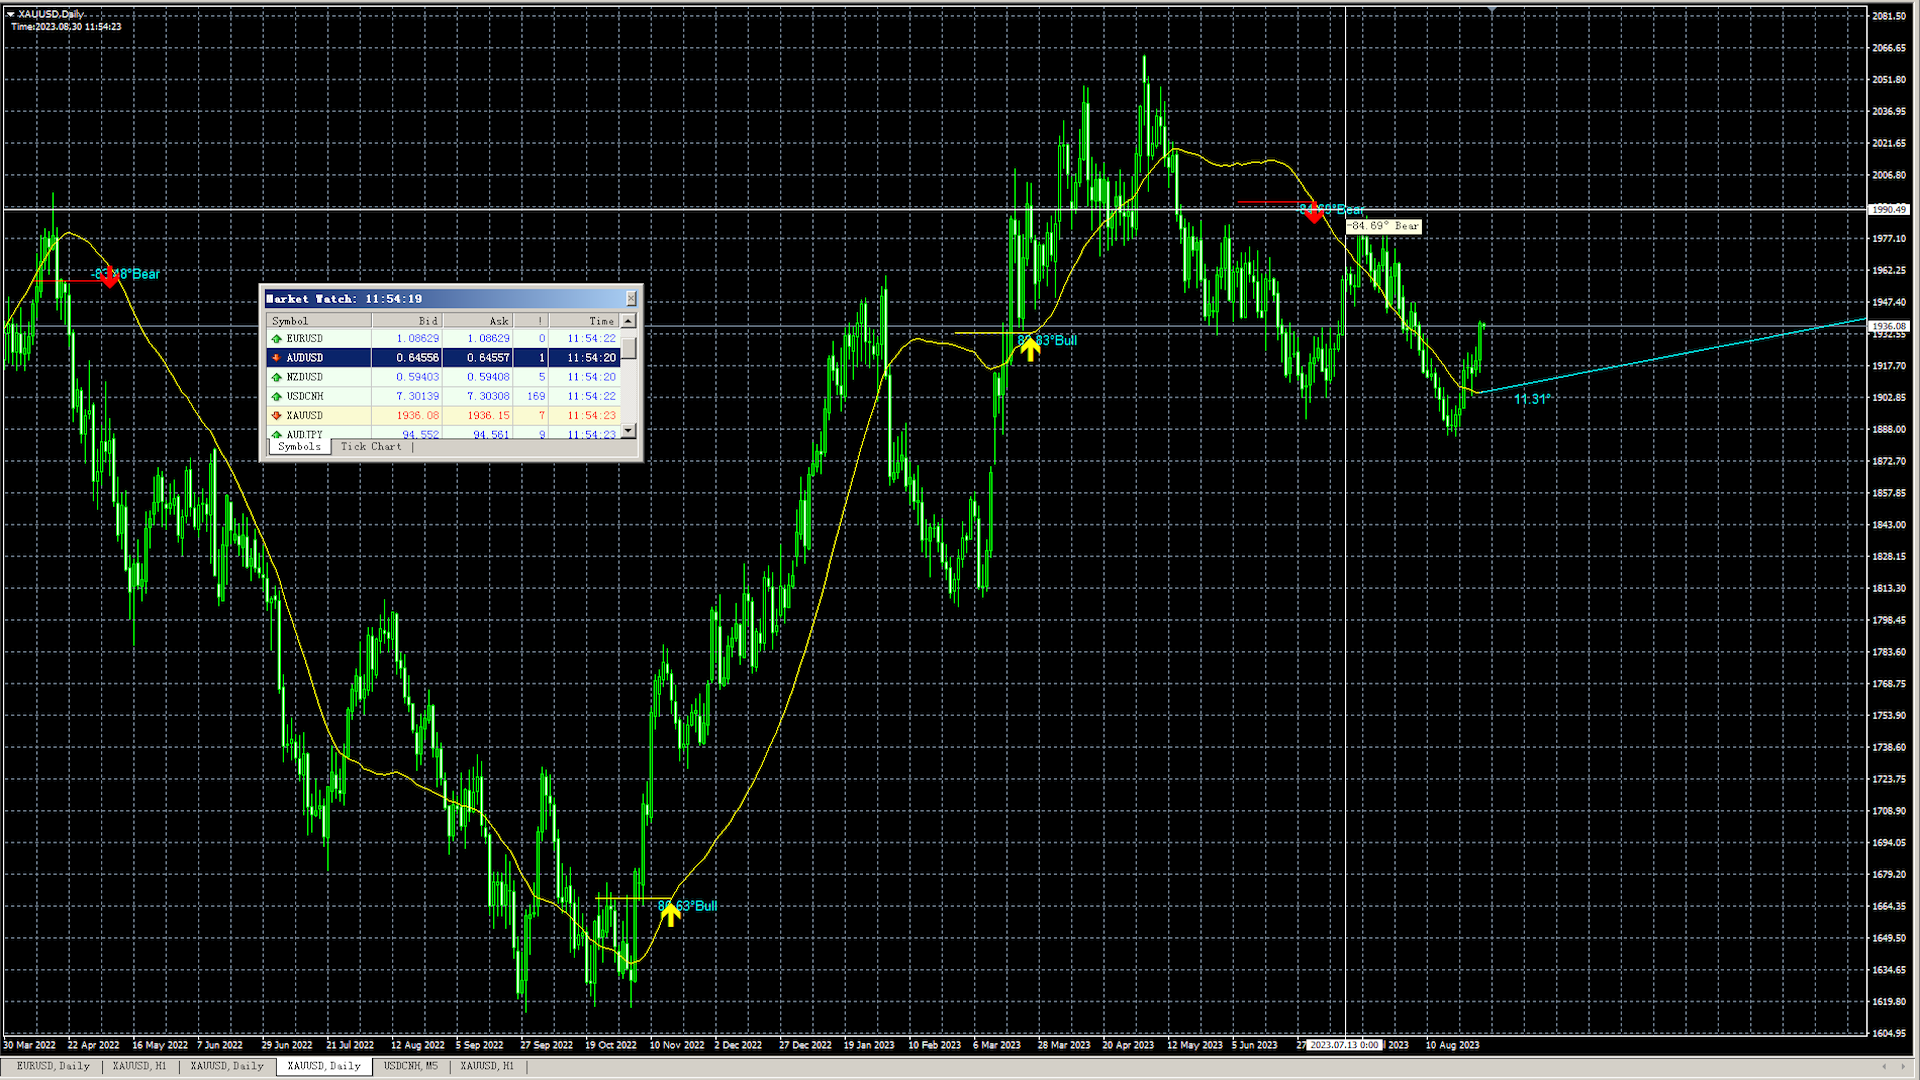
DYJ 피크 밸리 지표는 선진적인 제곱 가중 평균 거래 시스템이다.
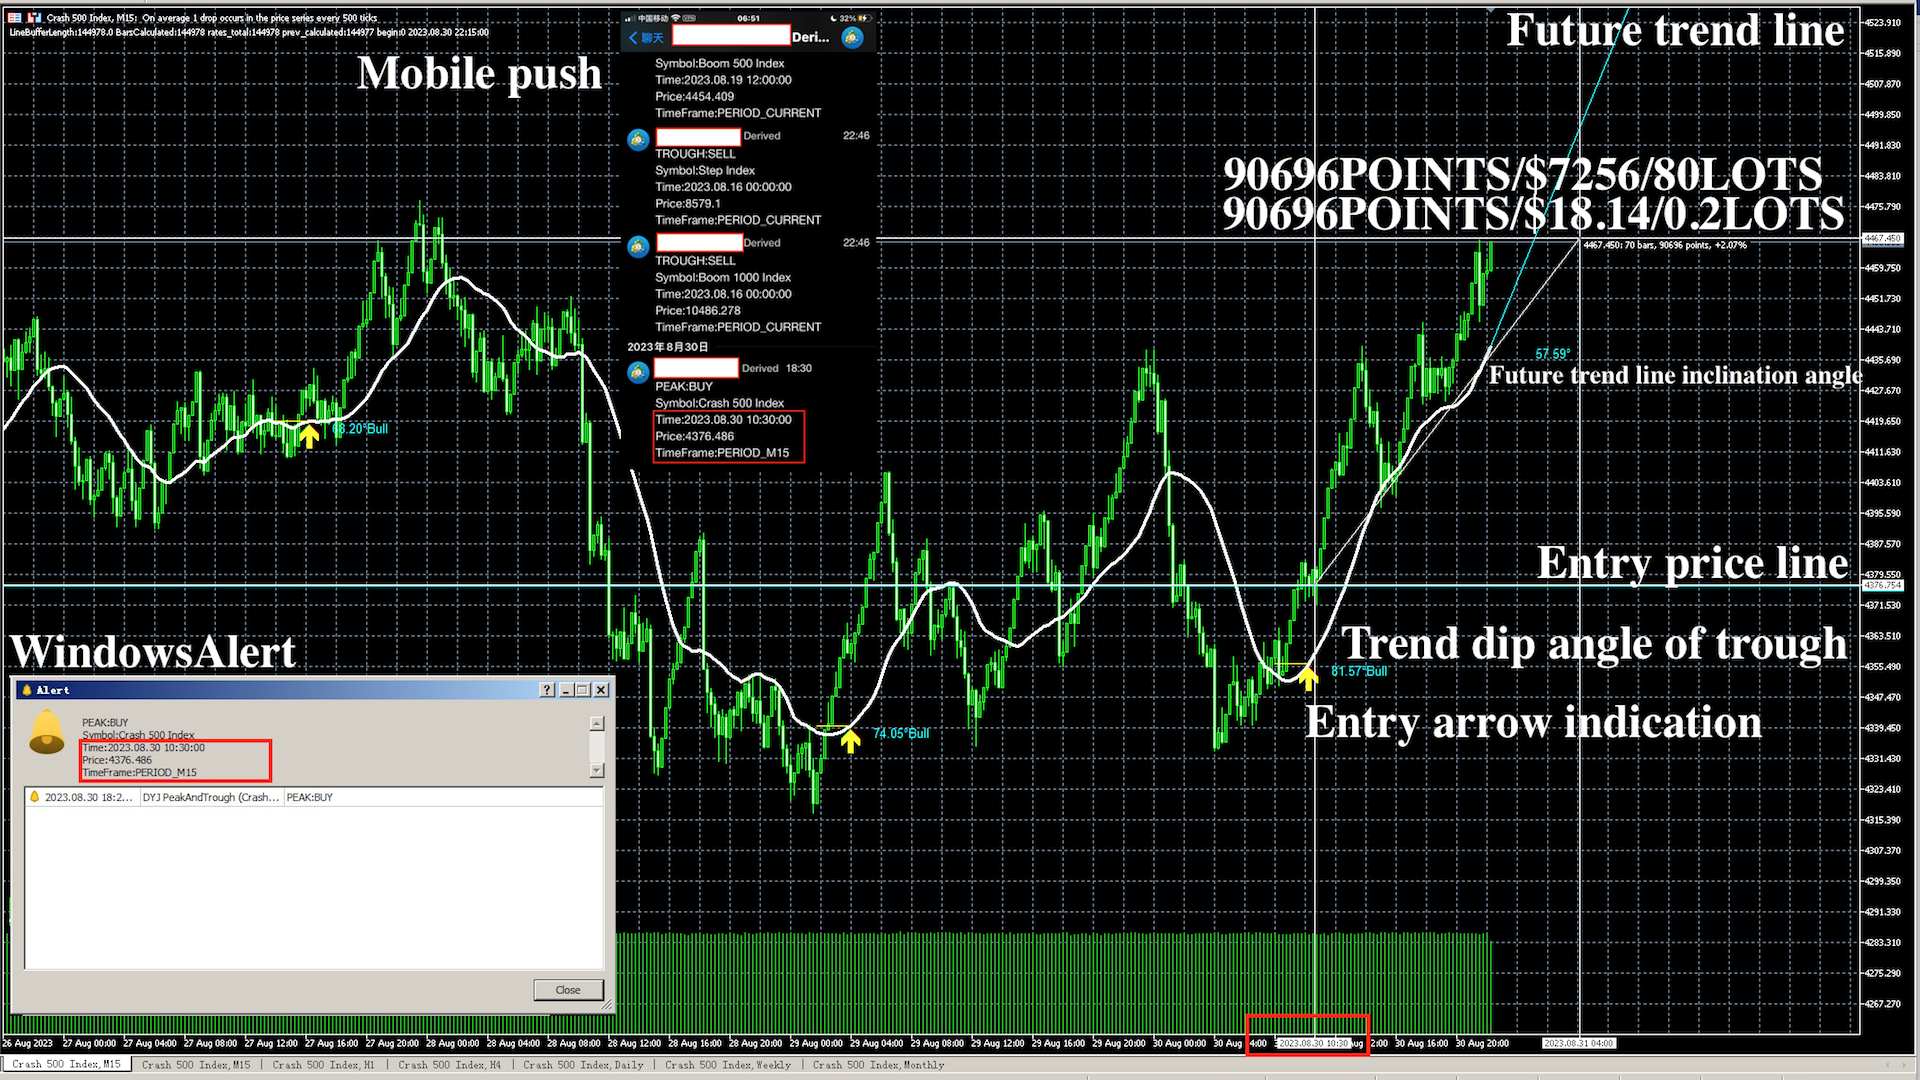
여기에는 미래 추세선과 추세 각도, 각 봉우리 골짜기의 각도 표시가 포함되어 있다.
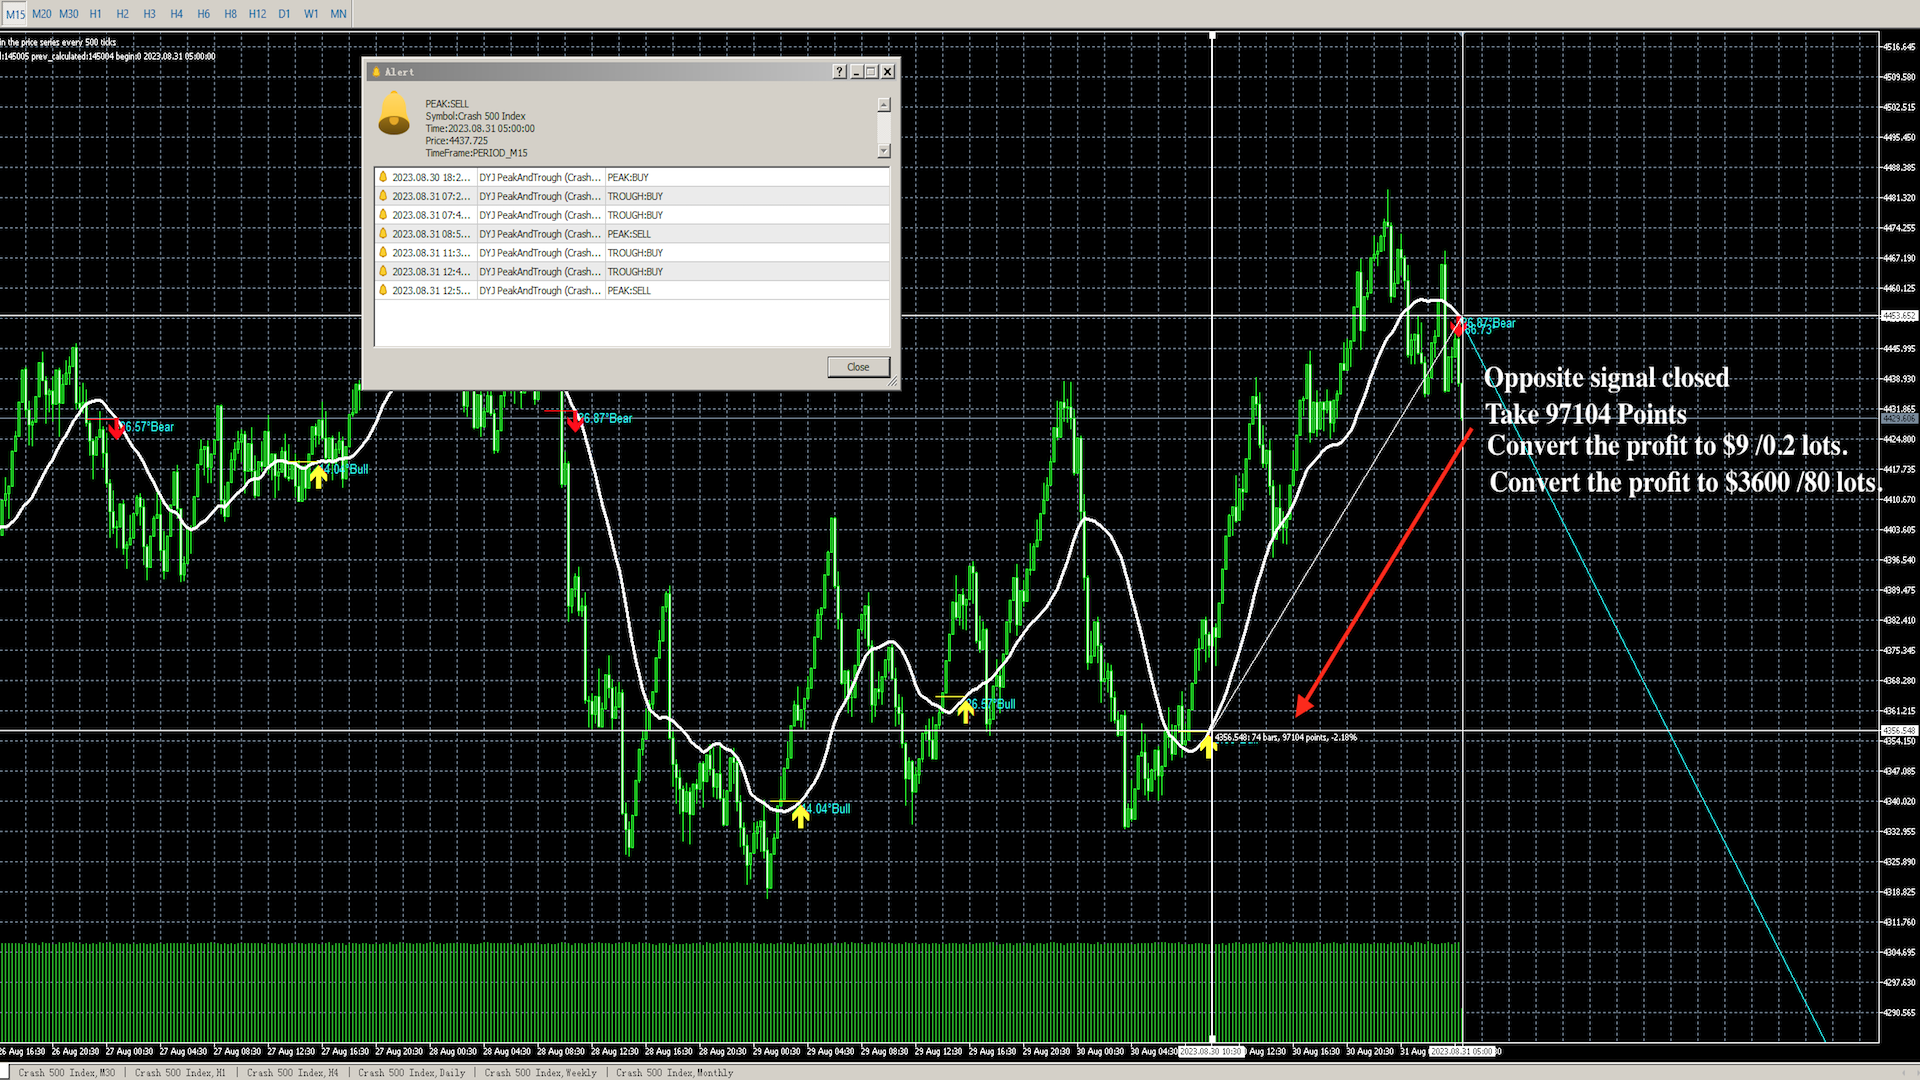
SQWMA 의 최고치가 끝날 때, 하락 추세가 있습니다.
SQWMA 의 밑바닥에는 상승 추세가 있다.
지표 신호는 거래량 개창 통계를 시뮬레이션하여 신호 확률에 대한 자세한 이해를 제공합니다
Please download the XAUUSD parameter template file (Link) in the comments section.
Input
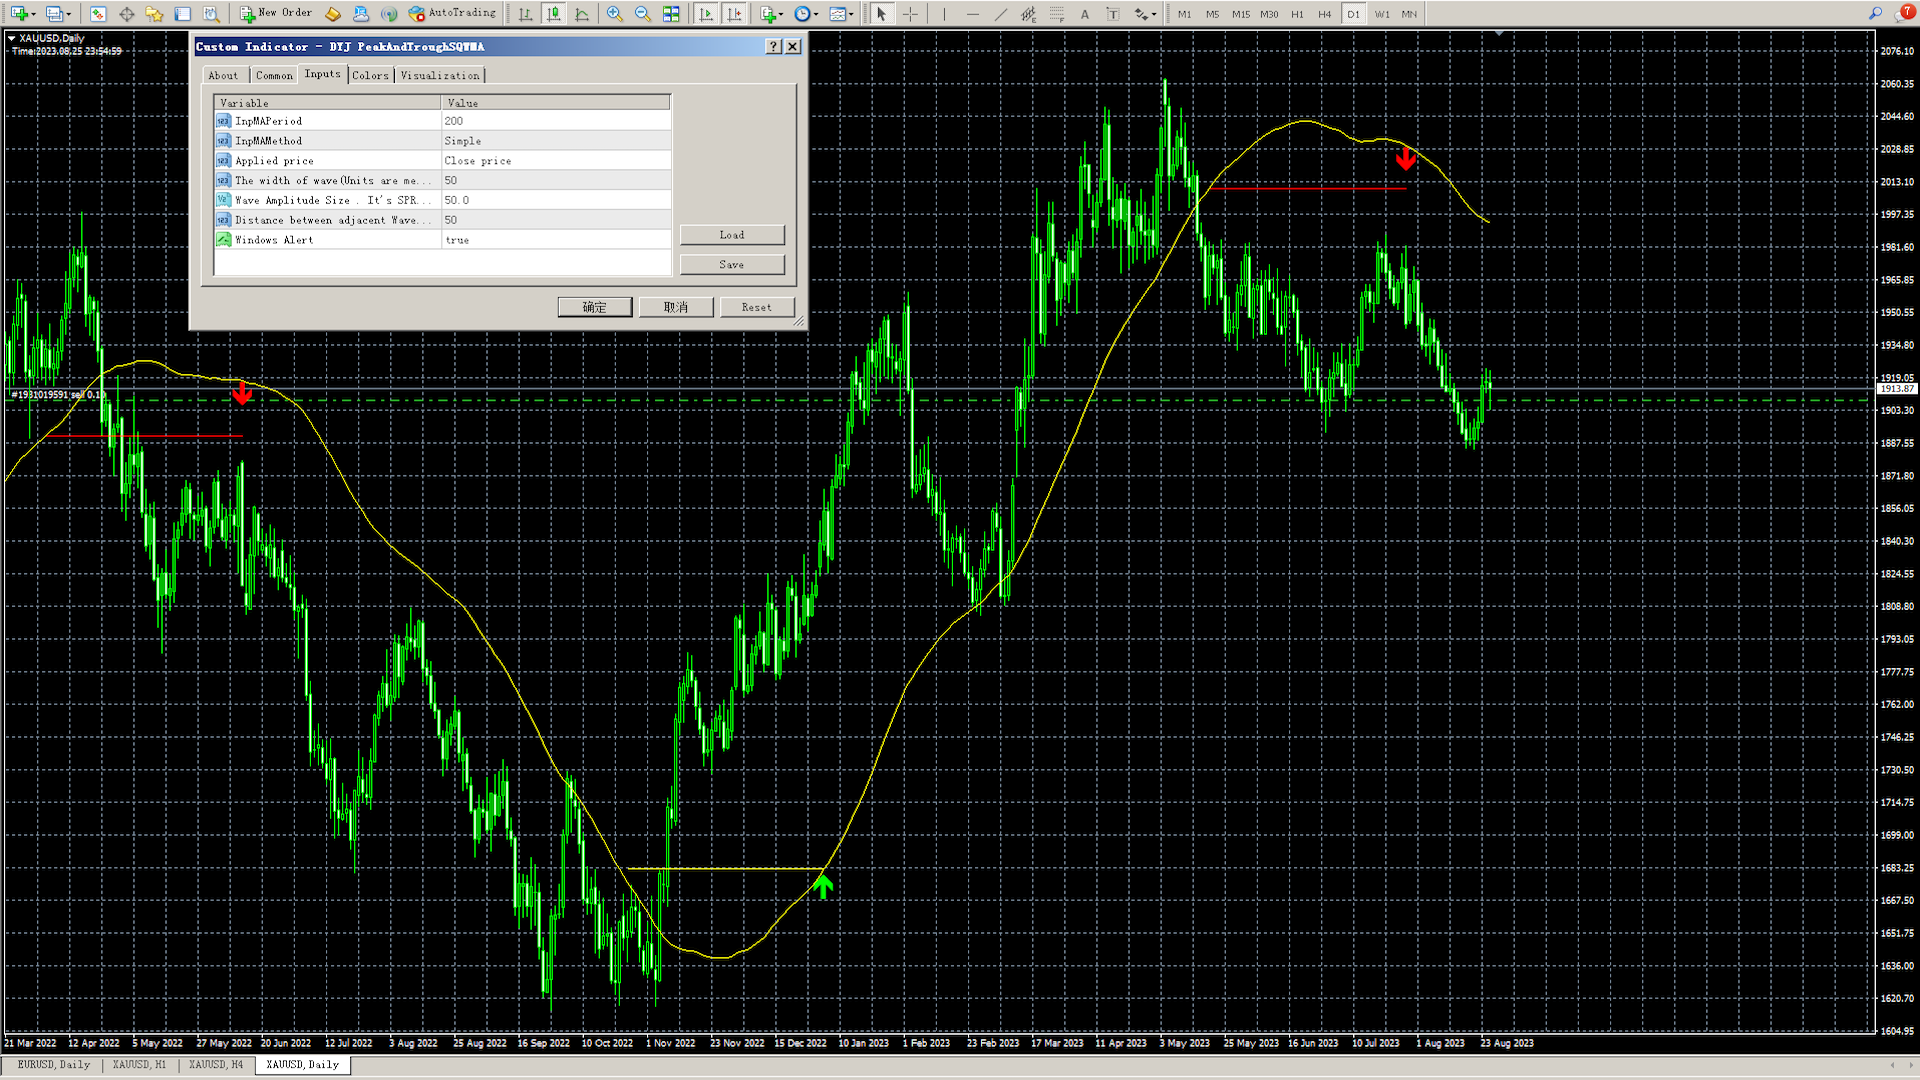
- InpMAPeriod = 25
- InpMAShift = 0
- InpMAMethod= MODE_SMA
- InpAppledPrice = PRICE_CLOSE
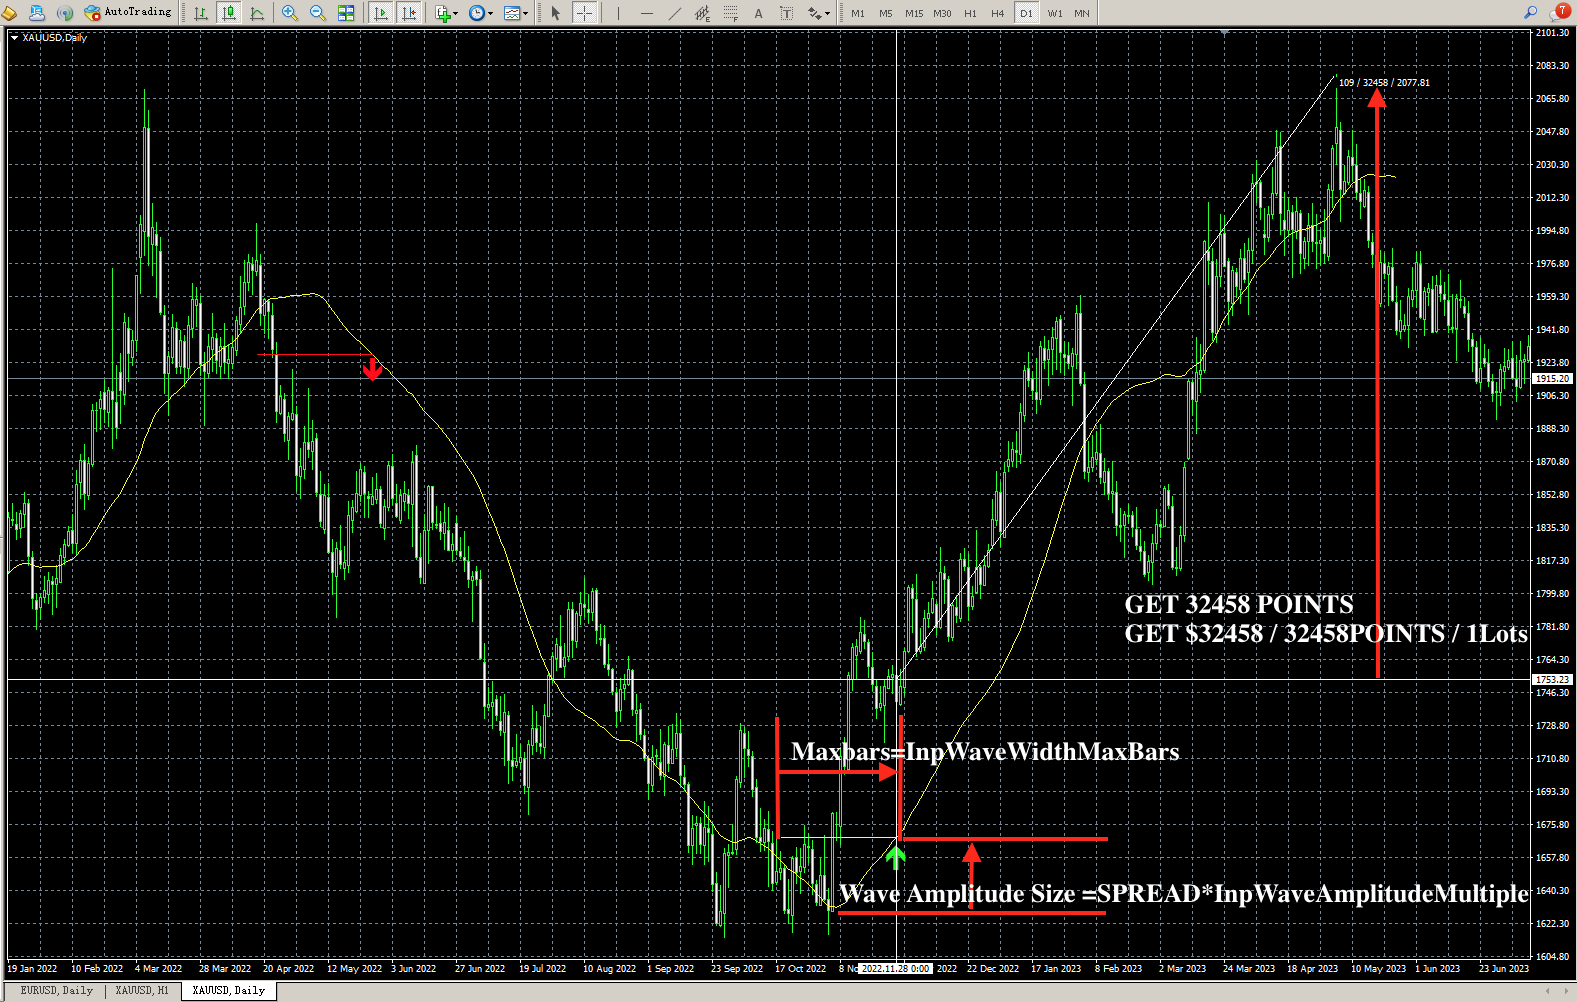
- InpWaveWidthMaxBars = 10 -- The width of wave(Units are measured in Bars)
- InpWaveAmplitudeSize = 2 -- Wave Amplitude Size . It's SPREAD Multiple
- InpMinBarOfSignal = 100 -- Distance between adjacent Wave(Units are measured in Bars)
- InpIsAlert = true;